AI Data Analysis: A Practical 2026 Guide for Data Teams

AI data analysis is the use of machine learning, natural-language interfaces, and agentic workflows to automate routine data work and surface faster, more actionable insights. The single best next step for any data team is to pilot AI on data preparation and exploratory data analysis (EDA) with predefined success criteria before touching modeling or deployment. Microsoft and Databricks both point to data prep as the highest-ROI starting point, and platforms like Plotstudio are built specifically to make that pilot reproducible and auditable from day one.
What a well-scoped pilot delivers:
- Faster turnaround: AI analyzes data in seconds to minutes versus days for manual workflows, compressing the time from raw data to first insight.
- Higher-quality inputs: Automated cleaning, missingness detection, and schema matching reduce the error rate before any model sees the data.
- Reproducible audit trail: Agentic systems that gate analysis behind a pre-approved plan produce a traceable record of every transformation and decision.
- Broader access: Natural-language querying lets non-coders interrogate datasets without writing SQL or Python.
Table of Contents
- What AI data analysis actually covers
- How AI helps at each stage of the analytics lifecycle
- Tool categories to consider for your workflow
- Research-backed findings: where AI actually saves time
- How to evaluate AI data analysis tools before you buy
- A practical roadmap for piloting AI in your analytics workflow
- Common risks and how to mitigate them from day one
- AI-enhanced data preprocessing techniques
- Industry-specific applications of AI in data analysis
- Best practices for maintaining and updating AI models over time
- Key Takeaways
- The gap between “AI-assisted” and actually reproducible
- Plotstudio brings research-grade agentic analytics to your workflow
- Useful sources for deeper study
What AI data analysis actually covers
The term gets used loosely, so a working definition matters. AI data analysis applies machine learning (ML), natural language processing (NLP), and automated code generation to the full analytics workflow: ingesting data, cleaning it, exploring structure and distributions, building predictive models, generating visualizations, and monitoring outputs in production.
It handles structured tables, semi-structured formats like JSON logs, and unstructured sources such as free-text survey responses or documents. Core capabilities include anomaly detection, schema matching, natural-language querying, AutoML-assisted modeling, and agentic orchestration of multi-step workflows.
Traditional analytics relies on analysts writing SQL, building static dashboards, and running ad hoc scripts. AI-assisted analytics operates at a different scale: it processes larger datasets faster, surfaces patterns a human might miss in initial exploration, and handles sources that previously required specialized NLP pipelines. What it does not replace is human framing. Deciding which question to ask, validating that a method fits the data-generating process, and interpreting results in domain context remain analyst responsibilities.
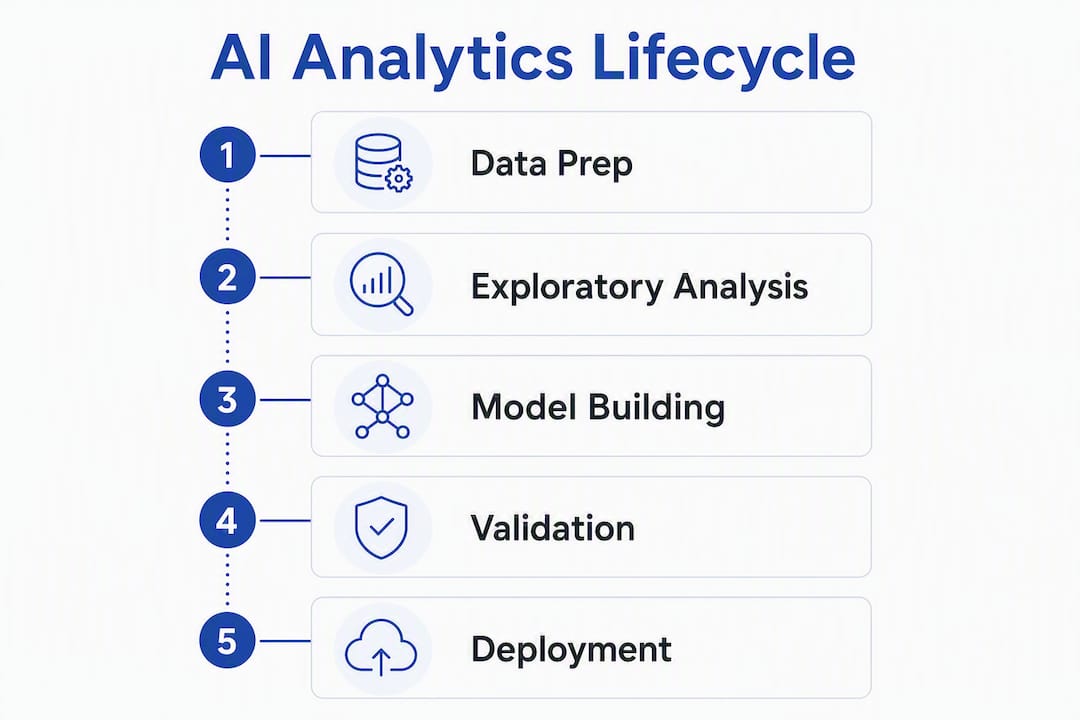
How AI helps at each stage of the analytics lifecycle
The analytics lifecycle has six recognizable stages, and AI adds something distinct at each one.
-
Ingestion and collection. AI-powered connectors handle format normalization and schema inference automatically, reducing the manual mapping work that slows pipeline setup. For streaming sources, ML classifiers can tag and route records in real time.
-
Preparation and cleaning. This is where AI delivers its largest practical gains. Automated anomaly detection, duplicate identification, imputation of missing values, and schema matching compress tasks that historically consume the bulk of analyst time. What took a day of scripting can run in minutes.
-
Exploratory data analysis. Natural-language interfaces let analysts ask “What drives variance in this column?” and receive a ranked summary with supporting statistics. IBM’s research confirms that NLP-driven interfaces widen access to EDA results beyond the core data team, letting product managers and domain experts engage directly with the data.
-
Feature engineering and modeling. AutoML systems automate preprocessing, model selection, and hyperparameter tuning to reduce iteration time on initial modeling. The catch: analysts must still validate assumptions, check for data leakage, and confirm that the winning model makes sense for the problem. AutoML accelerates the search; it does not replace judgment.
-
Visualization and narrative. AI can generate chart recommendations based on data types, write plain-language summaries of dashboard findings, and flag when a trend crosses a significance threshold. AI-assisted visualization tools now produce annotated outputs that explain what a chart shows, not just what it looks like.
-
Deployment and monitoring. Once a model is in production, ML-powered monitoring detects data drift, distribution shifts, and performance degradation automatically. Fraud detection systems and demand forecasting pipelines both depend on this layer to catch when the real world has moved away from training conditions.
The most significant shift comes when these stages are orchestrated together. Agentic analytics systems coordinate multi-step workflows across all six stages, passing outputs from one agent to the next and maintaining a visible action trace throughout. That orchestration is what separates a collection of AI features from a genuinely automated analysis pipeline.
Tool categories to consider for your workflow
No single platform covers every use case well. The right category depends on your data sensitivity, reproducibility requirements, and where in the lifecycle you need the most help.
| Category | Best for | When to choose it | Key limitation |
|---|---|---|---|
| AI-enabled BI platforms | Dashboard automation, NL querying of structured data | Teams needing self-service analytics on clean, cloud-resident data | Limited support for custom statistical methods |
| AutoML platforms | Rapid model prototyping, feature selection | Data scientists accelerating initial model search | Requires analyst validation; can mask assumptions |
| Generative code assistants (notebook-integrated) | Code generation, SQL drafting, script debugging | Engineers and data scientists in Jupyter or VS Code workflows | No execution environment; outputs must be run and checked manually |
| Agentic analytics platforms | End-to-end automated analysis with audit trails | Teams needing reproducible, multi-step workflows with governance | Higher setup cost; requires defined analysis plans |
| Anomaly detection and streaming services | Real-time monitoring, fraud detection, IoT data | Operations teams watching live data pipelines | Narrow scope; not suited for exploratory or ad hoc work |
| Spreadsheet AI tools | Quick calculations, formula generation, small datasets | Analysts working in Excel or Google Sheets on structured tables | Scale and reproducibility constraints |
| Local and sandboxed execution environments | Sensitive data, IRB/GDPR-governed research | Any workflow where raw data cannot leave local infrastructure | Requires local compute; less convenient for collaboration |
Pro Tip: When data sensitivity is a constraint, the execution model is the first filter, not the feature list. A cloud-based platform with strong AutoML capabilities is irrelevant if your IRB protocol or data-sharing agreement prohibits uploading raw records. Shortlist local or sandboxed execution environments first, then evaluate features within that subset. See the AI analytics platform guide for a deeper breakdown of capability tradeoffs.
Research-backed findings: where AI actually saves time
The time-savings case for AI in analytics is well-documented, but the gains are not evenly distributed across the workflow.
AI analyzes data in seconds to minutes, a dramatic compression compared with manual workflows that can take days for the same dataset at scale.
The Databricks research is specific about where automation yields the highest return:
- Data preparation and cleaning produces the largest ROI because it historically consumes the majority of analyst time on repetitive, low-judgment tasks.
- Anomaly detection and real-time monitoring benefit from ML’s ability to process streaming data continuously, catching issues that batch-review processes would miss until the next reporting cycle.
- EDA and summarization compress exploration time significantly when NL interfaces replace manual script-writing for distribution checks and correlation analysis.
Human oversight remains non-negotiable for model validation, causal interpretation, and any decision with regulatory or ethical stakes. Databricks experts frame this clearly: AI handles routine cleaning and exploration while humans frame questions, validate methods, and interpret results.
What agentic systems add is qualitatively different from a single AI feature. They orchestrate multi-step workflows, run generated code in sandboxed environments, and stream action traces so every intermediate step is visible and inspectable. That inspectability is what makes agentic outputs reproducible rather than just fast. For governance-sensitive work, the action trace functions as a built-in audit log.
Implications for teams planning a pilot:
- Require a visible action trace from any agentic tool before committing to it.
- Define reproducibility criteria upfront: can a colleague re-run the analysis from the same inputs and get the same outputs?
- Build governance checkpoints into the pilot timeline, not as an afterthought.
How to evaluate AI data analysis tools before you buy
Procurement decisions for AI analytics tools fail most often when teams focus on demo features rather than operational requirements. A structured evaluation checklist prevents that.
Evaluation dimensions and vendor questions:
- Supported languages: — R and Python support matters for teams with existing codebases or domain-specific statistical packages.
IBM’s guidance emphasizes that governance and data quality controls are the primary adoption challenges, not feature gaps. Build those requirements into your RFP before evaluating demos.
For proof-of-concept metrics, require vendors to demonstrate: time-to-insight on a representative dataset, reproducibility on a re-run, and at least one quality check (missingness report, outlier detection, or schema validation) that matches your team’s standards.
Pro Tip: Ask every vendor for a sample reproducibility package from a real analysis: the exported notebook, the PDF report, and the action trace. If they cannot produce one in the demo, they will not produce one in production.
A practical roadmap for piloting AI in your analytics workflow
Databricks recommends starting small with a focused pilot on one workflow area before scaling. The three-phase structure below translates that principle into a plannable timeline.
| Phase | Timeline | Key milestones | Success metrics |
|---|---|---|---|
| Pilot | 4 weeks | Select dataset, define baseline metrics, run AI on data prep and EDA, document action traces | Time-to-insight reduction, error rate vs. manual baseline, reproducibility on re-run |
| Validate and harden | 2–4 months | Governance checklist review, reproducibility test with second analyst, integration with existing pipeline, bias and drift checks | Reproducibility score, quality checks passed, stakeholder sign-off |
| Production and sustainment | Ongoing | Deployment plan, monitoring cadence, model refresh schedule, user training | Drift detection lead time, sustained time savings, audit trail completeness |
Phase milestones in detail:
- Pilot: Choose a dataset your team knows well so you can spot errors. Define baseline metrics before the AI runs anything. Focus on data prep and EDA first.
- Validate: Have a second analyst re-run the analysis independently using the exported reproducibility package. If outputs diverge, the audit trail tells you where.
- Harden: Run the governance checklist: PII sanitization confirmed, action trace complete, model assumptions documented, bias checks passed.
- Production: Set a monitoring cadence for drift detection. Schedule model refresh reviews quarterly or when upstream data distributions change.
Typical cost drivers for a small-to-mid pilot include compute (local or cloud), platform licensing (seat or credits), integration engineering time, and analyst hours for validation. The engineering and validation time is often underestimated. Budget at least as much for validation as for the initial setup.
Common risks and how to mitigate them from day one
AI analytics introduces risks that traditional analytics does not. Building mitigations into the pilot design is far cheaper than retrofitting them after deployment.
- Bias in training data: AI models inherit the biases present in historical data. Mitigation: audit training data for representation gaps before modeling; document known limitations in the analysis plan.
- Hallucination in generative outputs: LLM-based tools can produce plausible-sounding but incorrect summaries or code. Mitigation: require sandboxed execution so generated code runs in a controlled environment and outputs are verified against raw data before acceptance.
- Data leakage and PII exposure: Cloud-based tools that process raw data outside your infrastructure create compliance risk. Mitigation: use local or sandboxed execution for sensitive datasets; run automated PII detection and anonymization before any data touches an external API.
- Model drift: Production models degrade as real-world distributions shift away from training conditions. Mitigation: implement continuous monitoring with automated alerts when performance metrics cross defined thresholds.
- Over-reliance on automation: Teams that accept AI outputs without validation accumulate silent errors. Mitigation: require human-in-the-loop sign-off at defined checkpoints, particularly for outputs that inform decisions with regulatory or financial consequences.
IBM’s governance guidance is direct: strict controls on data quality and bias are the primary safeguards, especially for LLMs operating on sensitive or unstructured data. Agentic systems that expose action traces reduce the black-box risk by making intermediate steps inspectable, but they do not eliminate the need for human validation at key checkpoints.
Pro Tip: Treat the analysis plan as your primary governance artifact. Defining scope, methods, success criteria, and PII handling before any code runs functions as a pre-registration: it prevents post-hoc rationalization and gives auditors a clear record of intent versus outcome.
AI-enhanced data preprocessing techniques
Data preprocessing is where AI earns its keep most consistently. The techniques below are well-established, and AI accelerates each one.

Missing value imputation. Traditional approaches use mean/median substitution or listwise deletion. ML-based imputation methods, such as k-nearest neighbors or iterative imputation via regression, preserve more distributional information and handle missingness patterns that simple substitution distorts.
Outlier detection. Isolation Forest, Local Outlier Factor, and autoencoder-based methods identify anomalies in high-dimensional data that rule-based thresholds miss entirely. These are particularly useful in financial transaction data and sensor streams where outlier patterns are complex.
Feature encoding and normalization. AI-assisted pipelines can infer the appropriate encoding strategy for categorical variables (ordinal vs. nominal, target encoding vs. one-hot) based on cardinality and downstream model type, reducing manual decision-making in pipeline setup.
Duplicate and near-duplicate detection. Fuzzy matching algorithms and embedding-based similarity search identify records that refer to the same entity even when string representations differ, a common problem in CRM and survey data.
Schema inference and type casting. ML classifiers trained on column names, sample values, and statistical properties can infer data types and flag likely mismatches automatically, catching errors that would otherwise propagate silently into downstream analysis.
Text normalization for unstructured inputs. NLP preprocessing pipelines handle tokenization, stopword removal, stemming, and entity recognition at scale, converting free-text fields into structured features suitable for ML models.
Each of these techniques is available in open-source libraries (scikit-learn, spaCy, pandas) and is increasingly surfaced through AI-assisted interfaces that generate the preprocessing code from a natural-language description of the problem.
Industry-specific applications of AI in data analysis
The analytics lifecycle looks different across industries, and AI’s impact is most visible where data volumes are high and decision cycles are short.
Healthcare and clinical research. Survival analysis, Cox proportional hazards models, and mixed-effects models are standard tools for clinical trial analysis. AI accelerates the preprocessing of electronic health records, flags protocol deviations in trial data, and supports reproducible reporting for regulatory submissions. For IRB-governed datasets require local execution as a hard requirement: raw patient data cannot leave institutional infrastructure.

Financial services. Fraud detection systems use real-time anomaly detection on transaction streams, flagging suspicious patterns within milliseconds. Credit risk models rely on AutoML to search feature spaces that would take weeks to explore manually. Regulatory reporting workflows benefit from automated data lineage tracking.
Retail and e-commerce. Demand forecasting models trained on sales history, promotional calendars, and external signals (weather, events) use AI’s predictive capabilities to reduce inventory costs and stockout rates. Customer segmentation pipelines run continuously as purchase behavior updates.
Manufacturing and operations. Predictive maintenance models analyze sensor data from equipment to forecast failure before it occurs. Quality control pipelines use computer vision and statistical process control to detect defects at line speed.
Academic research. Reproducibility is the defining constraint. Researchers need analysis workflows that produce exportable notebooks, PDF reports, and complete audit trails that a peer reviewer or supervisor can trace. The statistical methods required (ANOVA, regression, multiple-comparison correction, mixed-effects models) are specific to each discipline, and generic AI tools often apply inappropriate defaults.
Marketing analytics. Attribution modeling, A/B test analysis, and cohort analysis all benefit from AI-assisted EDA and automated significance testing. The risk here is over-reliance on automated p-value reporting without checking test assumptions, particularly variance homogeneity and independence.
Best practices for maintaining and updating AI models over time
A model that performs well at deployment will drift. The question is how quickly you detect it and how efficiently you respond.
Monitor input distributions, not just output metrics. Performance metrics like accuracy or F1 score can lag behind the actual problem. Tracking the statistical distribution of input features catches data drift before it degrades predictions, giving you lead time to retrain.
Version everything. Model weights, training data snapshots, preprocessing pipelines, and hyperparameter configurations should all be version-controlled. When a model needs to be retrained or rolled back, you need to reproduce the exact conditions of the previous version.
Schedule regular retraining reviews. Quarterly reviews are a reasonable default for most production models, but high-velocity environments (fraud detection, real-time pricing) may require more frequent cycles. Tie the review cadence to the rate of change in the underlying data-generating process, not to a fixed calendar.
Document model assumptions explicitly. Every model encodes assumptions about the data: stationarity, independence, distributional form. When those assumptions break, the model breaks. Keeping a living document of assumptions makes it easier to diagnose failures and communicate limitations to stakeholders.
Separate monitoring from alerting. Continuous monitoring generates signals; alerting converts signals into actions. Define thresholds for when a drift signal triggers a human review versus an automated retrain. Alerting on every minor fluctuation creates noise that teams learn to ignore.
Maintain a rollback plan. Before deploying a new model version, confirm that the previous version can be restored within a defined time window. Production failures in AI systems often require rapid rollback while the root cause is investigated.
Key Takeaways
AI data analysis delivers the highest ROI when piloted on data preparation and EDA first, with governance, reproducibility, and privacy controls built in from the start rather than added later.
| Point | Details |
|---|---|
| Pilot on data prep first | AI’s largest time savings come from automating cleaning, schema matching, and anomaly detection before modeling begins. |
| Require audit trails from day one | Agentic systems that expose action traces make outputs reproducible and auditable, which is non-negotiable for governed or research-grade work. |
| Execution model is the first filter | For IRB, GDPR, or sensitive data, local or sandboxed execution must be confirmed before evaluating any other feature. |
| Governance is the primary adoption risk | Bias, hallucination, and model drift are manageable with pre-registered analysis plans, PII sanitization, and continuous monitoring. |
| Plotstudio for research-grade workflows | Plotstudio’s local execution, analysis-plan gating, and exportable reproducibility packages make it the strongest option for academic and privacy-sensitive analysis. |
The gap between “AI-assisted” and actually reproducible
Most articles about AI in analytics focus on speed. That framing is not wrong, but it is incomplete in a way that matters for serious practitioners.
The real question is not whether AI can analyze your data faster. It can. The question is whether the output is defensible: can you show a peer reviewer, a regulator, or a senior stakeholder exactly what happened to the data between ingestion and conclusion? Most general-purpose AI tools cannot answer that question. They produce outputs without exposing the intermediate steps, which means you are accepting results you cannot fully audit.
This is where the distinction between AI-assisted analytics and research-grade agentic analytics becomes concrete. An agentic system that gates every analysis behind a pre-approved plan, runs code in a sandboxed environment, and exports a complete action trace is not just faster than manual analysis. It is more defensible. The audit trail is not a compliance checkbox; it is the mechanism that lets you catch errors, reproduce results, and communicate methodology to anyone who needs to verify your work.
For teams working with sensitive data, the local execution requirement is equally non-negotiable. The convenience of a cloud-based tool evaporates the moment your data-sharing agreement or IRB protocol prohibits uploading raw records. Choosing a tool that runs locally is not a compromise on capability; it is a prerequisite for doing the work at all.
Speed matters. Reproducibility matters more when the stakes are high.
Plotstudio brings research-grade agentic analytics to your workflow
For teams where reproducibility, privacy, and methodological rigor are requirements rather than preferences, Plotstudio is built to meet those constraints directly. Data stays on your machine: no cloud upload, no third-party processing, which makes it the only workable option for IRB-governed, GDPR special-category, or NHS patient data. Every analysis is gated behind a plan you review and approve before any code runs, producing a pre-registration and audit trail in one step.

Plotstudio runs R and Python natively and covers the statistical methods academic and enterprise work actually requires: survival analysis, Cox proportional hazards, mixed-effects models, ANOVA, and multiple-comparison correction. Exports include annotated Jupyter notebooks, PDF reports, and permanent searchable analysis pages. For organizations needing managed deployment, the enterprise platform supports Azure-hosted instances with seat-based licensing. Academic teams can access the research partnership program for credits and priority access. Start with a focused pilot on your most sensitive dataset and see what a defensible, reproducible analysis actually looks like.
Useful sources for deeper study
The sources below back the claims in this guide and point toward further reading for specific needs.
- AI Data Analytics: Enhance Your Data Analysis | Microsoft AI — Best starting point for understanding time-savings claims and predictive analytics integration.
- DA-Studio: An Agentic System for End-to-End Data Analysis | arXiv — Research paper demonstrating agentic workflow orchestration, sandboxed execution, and action trace design.
- Using AI for Data Science Analysis | Intuit Blog — Practical AutoML guidance and analyst validation requirements.
- AI for Data Analysis | Coursera — Structured learning path for practitioners building hands-on skills in AI-assisted analytics.
- Best AI Tools for Data Analysis in 2026 | Plotstudio AI — Tested and ranked tool roundup for teams shortlisting specific platforms.
- What Is Agentic Analytics? | Plotstudio AI — Definition and rationale for agentic workflows, with emphasis on reproducibility and research-grade use cases.