Researchers: 11 Manifest Fields for an IRB Ready Analysis Audit Trail

An analysis audit trail is the provenance record that ties raw data to every transformation, script, environment, and decision behind a reported result. It is what lets a reviewer, IRB panel, or supervisor reconstruct exactly how a number in a paper was produced. Without it, a result is a claim. With it, a result becomes evidence someone else can independently verify.
TL;DR:
- An analysis audit trail must include raw data identifiers, transformation details, output files, environment captures, execution logs, decision logs, and archival information for full reproducibility.
- Building a practical audit trail involves automating capture fields, using version-controlled scripts, and obtaining pre-analysis plan approval before running code.
- Machine-readable formats like PROV, research compendia, workflow managers, lockfiles, and persistent identifiers are essential for reliable provenance documentation.
- Integrating provenance capture into daily workflows, with tools like continuous integration and pipeline hooks, prevents retroactive reconstruction failures.
- PlotStudio supports research-grade provenance by enabling local analysis, pre-approved plans, and exporting traceable reports without exposing sensitive data.
Table of Contents
- What Must an Analysis Audit Trail Include?
- How Do You Build a Practical Audit Trail Manifest?
- Which Tools and Formats Capture Provenance Reliably?
- How Do You Operationalize This in a Lab?
- How Does PlotStudio Support Research-Grade Provenance?
- Why Provenance Habits, Not Paperwork, Win Artifact Reviews
- Build Your Audit Trail Without Leaving Your Data Exposed
- Sources
What Must an Analysis Audit Trail Include?
Reviewers and IRB panels are not looking for a narrative methods paragraph. They want a manifest, a concrete list of artifacts that together let someone else reconstruct your result from scratch. The computational provenance and reproducibility guidance from GigaScience frames this as a full chain of evidence: raw inputs, workflow scripts, output files, and documented environmental dependencies, all linked together rather than scattered across a hard drive and a lab notebook.
That chain breaks down into specific, checkable items:
- Raw data identity. A version number and checksum for the exact dataset used, not “the spreadsheet from March.”
- Transformations. Which code ran, with which parameters, and how many rows or observations each step affected.
- Outputs. The figures and tables actually reported, traceable back to the script that generated them.
- Environment capture. A lockfile or container digest pinning every package version, since a script that ran in 2024 can silently produce different output on 2026 dependencies.
- Execution logs. Timestamps and checksums showing when each step ran and against what inputs.
- Decision and assumptions log. The pre-analysis plan, plus any deviations from it and why.
- Archival deposit info. A DOI or SWHID pointing to a permanent, citable copy of the code and data.
Each item earns its place for a different reason. A checksum on raw data proves nobody’s cleaning script silently altered the source file between runs. A parameter log means a reviewer does not have to guess whether you used a 0.05 or 0.01 significance threshold. An environment lockfile matters because a t.test() call in R or a scipy.stats function in Python can behave differently across package versions, and unpinned dependencies are one of the most common ways a “reproducible” analysis quietly stops reproducing.
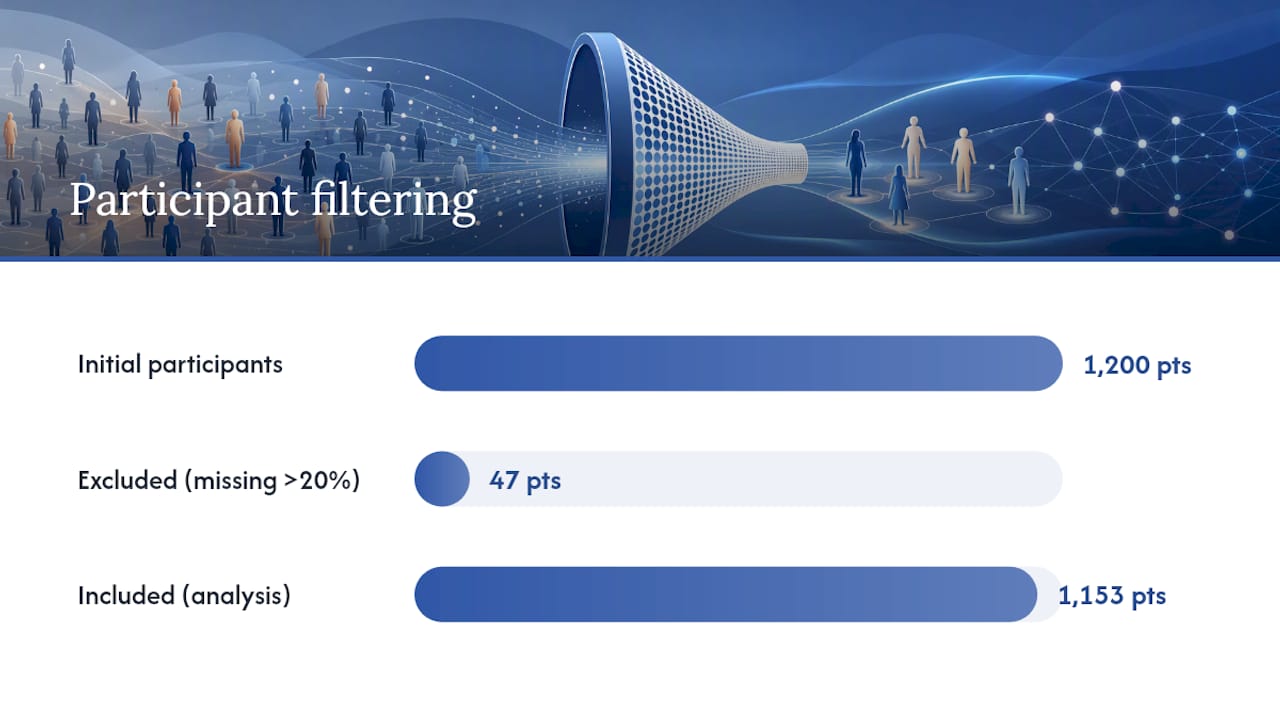
Consider a filtering step that excludes 47 of 1,200 participants for incomplete survey responses. Logged properly, that step records the exclusion count, the criterion (missing more than 20 percent of items), and the rationale (to avoid biasing the mean on partially completed scales). Logged poorly, it is a comment in a script that says “removed some bad rows,” which tells a reviewer nothing and an IRB even less.
How Do You Build a Practical Audit Trail Manifest?
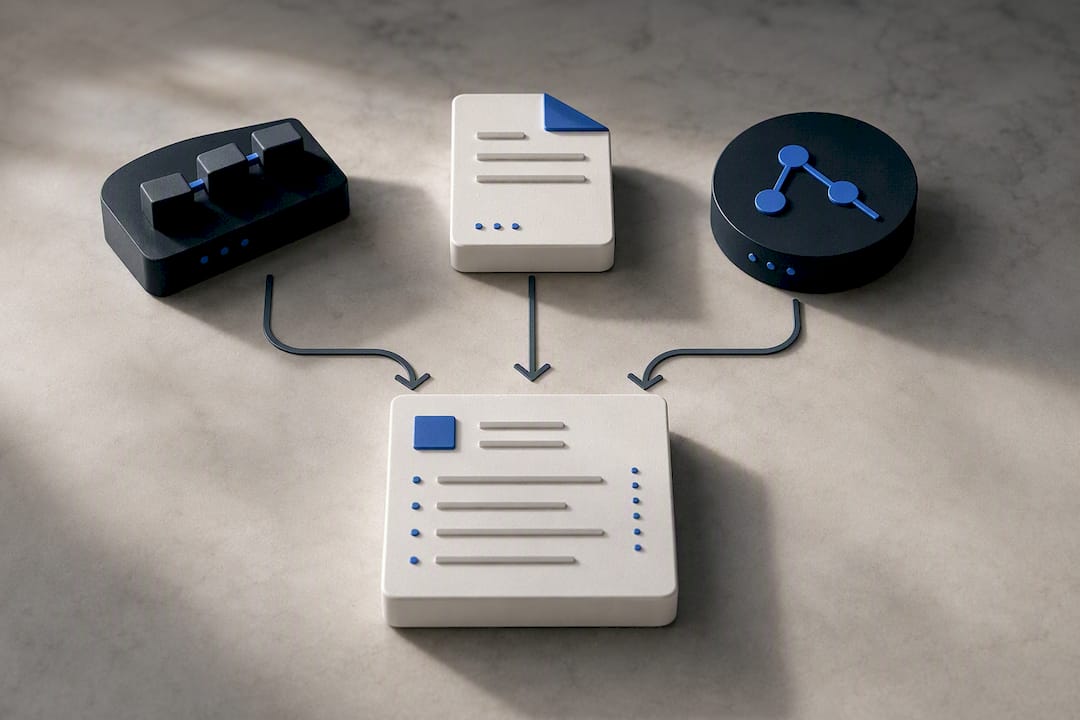
A manifest does not need to be elaborate to work. It needs to be consistent, machine-readable where possible, and populated as you go, not reconstructed from memory after a reviewer asks for it.
A minimal but sufficient manifest schema includes:
- ID — a unique identifier for this analysis run.
- Author — who executed the step.
- Timestamp — when it ran.
- Input checksum — a hash confirming which exact data file was used.
- Command or script path — the precise file and function invoked.
- Parameters — every threshold, seed, or setting passed to the code.
- Rows removed — a count at each filtering step, not a vague description.
- Rationale — why that filter or decision was made.
- Commit or tag — the version-control reference for the code state.
- Environment ID — the lockfile hash or container digest in use.
- Archive DOI or SWHID — the permanent record once deposited.
Counts matter more than most researchers assume. A reviewer who sees “excluded outliers” learns nothing; a reviewer who sees “excluded 12 of 340 observations, Cook’s distance greater than 4/n” can actually judge whether your decision was reasonable. The StatsTest guidance on documenting analysis decisions is direct on this point: real-time capture of filters, counts, and rationale is far easier than reconstructing that history weeks later from memory or scattered notebook cells.
Pro Tip: Capture the manifest fields automatically wherever you can, through pipeline hooks, electronic lab notebook (ELN) entries, or Git commit hooks, rather than filling them in by hand at the end of a project. The gap between what you did and what you remember doing widens fast.
Build the habit of getting a pre-analysis plan approved before code runs. That single step converts your audit trail from a retroactive defense into something closer to a pre-registration.
Which Tools and Formats Capture Provenance Reliably?
Manual notes get you partway there. Machine-readable formats and workflow tooling get you the rest of the way, and they are what artifact reviewers increasingly expect to see.
- PROV / PROV-DM. The W3C’s provenance data model organizes provenance into entities, activities, and agents, giving you a standard, machine-processable way to describe what happened to your data. It shines when you need automated provenance capture across a multi-step pipeline rather than a plain-text log.
- RO-Crate and research compendia. Packaging tools such as rrtools bundle your data, code, and environment specification into a single structure a reviewer can run end-to-end. NCEAS’s guidance on research compendia notes that a small, runnable example inside that package is often what separates an artifact judged “functional” from one judged merely “submitted.”
- Workflow managers. Nextflow, Snakemake, and CWL each generate execution logs recording commands, container versions, parameters, and checksums automatically as your pipeline runs, closing much of the gap that manual note taking leaves open.
- Environment capture. Lockfiles pin package versions for a given language; container digests pin the entire operating environment. Use both when your analysis spans R, Python, and system-level dependencies together.
- Archival deposits. Zenodo mints a DOI for a citable release, and Software Heritage archives the code itself with a persistent SWHID. The CASRAI guide to reproducibility infrastructure recommends pairing both, since a DOI alone does not guarantee the underlying code survives a decade of link rot.
How Do You Operationalize This in a Lab?
None of this works as a one-time effort bolted onto a paper’s submission. It has to live inside your data management plan and your team’s daily habits, or it collapses back into retroactive reconstruction under deadline pressure.
Start by naming who owns capture and deposit for each project, then automate the parts that do not need a human:
- Run continuous integration to rebuild your analysis artifacts automatically on each significant change.
- Tag the exact commit tied to every reported result, so “Figure 3” maps to one immutable code state.
- Wire pipeline hooks to emit a manifest entry every time a script runs, rather than relying on someone to fill one in later.
- Integrate your ELN so decision rationale gets logged where the work happens, not reconstructed from memory.
The deliverables reviewers actually check are predictable: a README that a stranger could follow, a pinned environment, a small runnable example, a tagged commit, and a DOI or SWHID pointing to the deposited artifact.
Pro Tip: The three failures that sink most audit trails are unpinned dependencies, hardcoded file paths that only work on the original author’s machine, and documentation written after the fact instead of during the run. Fix the first two with containers and relative paths; fix the third by making capture part of the pipeline, not a task on your to-do list.
How Does PlotStudio Support Research-Grade Provenance?
PlotStudio was built around this exact requirement. Analysis runs locally, so IRB-governed and GDPR special-category data never leaves the researcher’s machine, addressing one of the hardest constraints in privacy-first academic analytics. Every analysis is gated behind a plan the researcher approves before code executes, methods and thresholds stated up front, functioning as both pre-registration and audit trail. Running R and Python natively, it exports annotated notebooks, PDF reports, and searchable analysis pages so a supervisor or reviewer can trace a result back to its origin.
Why Provenance Habits, Not Paperwork, Win Artifact Reviews
Most labs treat the audit trail as paperwork to assemble after the analysis is done, when it should be the analysis’s exoskeleton from the first line of code. I think that instinct is backwards, and it costs researchers more than they realize at review time.
Reconstructing provenance retroactively is exponentially harder than logging it as you go, and it shows: reviewers can tell within minutes whether a manuscript’s methods section was written from a real manifest or from memory. A small runnable example with a pinned environment consistently outperforms three extra pages of prose methods description in artifact evaluations, because it is something a reviewer can actually execute rather than just trust. If your lab adopts one habit from this guide, make it that pre-analysis plans get approved before code runs, and every filter gets a count and a reason attached the moment it happens.
— Aymen
Build Your Audit Trail Without Leaving Your Data Exposed
PlotStudio is the alternative to stitching together spreadsheets, screenshots, and a hopeful methods paragraph after the fact. Every run stays on your own machine, every analysis starts from a plan you approve before code executes, and every output exports as an annotated notebook or PDF report a supervisor or reviewer can actually trace back to source.

For labs juggling survival analysis, mixed-effects models, or repeated ANOVA runs across a growing dataset, that pre-approval step doubles as the pre-registration reviewers increasingly expect, without adding a separate paperwork process. If your group is evaluating tools for advanced statistical workflows or comparing options for handling raw CSV exports from a study platform, see how PlotStudio structures that workflow with a free trial, or contact the enterprise team about institutional deployment across a department or research group.