Privacy First Analytics for Product Managers: Research Grade Checklist

Analytics for product managers, in the research context, means privacy-first statistical workflows that produce defensible, auditable results, not dashboards tracking user behavior. The right approach: write an analysis plan before touching data, keep sensitive data local when IRB or GDPR rules apply, and export a reproducibility package a stranger could rerun. Tools like Zenodo, Docker, and PlotStudio each solve a piece of that chain.
TL;DR:
- Reproducible analytics require a detailed, machine-readable workflow, an exact dependency environment, and a permanent code version record, verified by review.
- Automating the entire pipeline and keeping data local or zero-leakage are essential when working with sensitive or regulated data to ensure compliance.
- Publishing a self-contained package with setup instructions, a license, sample outputs, and workflow files, linked to a durable archive, is critical for long-term reproducibility.
- Common failures like absolute local file paths, unset random seeds, and mutable container tags cause analysis failures for outsiders; run your pipeline in a fresh environment before submission.
- Product managers should focus on statistical validity, provenance, and uncertainty rather than just metrics, ensuring interpretations are transparent and confidence intervals are properly communicated.
Table of Contents
- What Are the Core Elements of Reproducible Analytics for Product Managers?
- A Compact Reproducible Workflow: Explore, Refine, Produce
- How Should You Handle Sensitive or Regulated Data?
- What Artifacts Do Journals and Funders Actually Expect?
- What Are the Most Common Reproducibility Failures?
- What Analytics Concepts Should Product Managers Understand First?
- What Metrics and KPIs Matter Most in Research-Grade Product Analysis?
- How Do You Interpret Analytics Results for Product Decisions?
- Which Tools Do Research Teams Rely on for Analytics Work?
- How Should You Communicate Analytics Findings to Stakeholders?
- How Do You Integrate Qualitative Data With Quantitative Analytics?
- Author Perspective: Engineering Reproducibility and Privacy Together
- How PlotStudio Maps to This Reproducibility Checklist
- Sources
What Are the Core Elements of Reproducible Analytics for Product Managers?
Reviewers and reproducibility auditors do not grade on effort. They grade on whether a stranger, given your repository and nothing else, can rerun your analysis and get your numbers back. That requires three things working together, not in isolation.
The first is workflow logic: a machine-readable record of every analytical step, structured as a directed acyclic graph rather than a loose collection of scripts run “in the right order.” The second is a pinned computational environment, meaning an exact snapshot of the OS, runtime, and package versions, so the code behaves identically on a reviewer’s laptop as it did on yours. The third is durable code identity: a permanent, citable record of exactly which version of the code produced which result, independent of whether your GitHub account still exists in five years. Together, these three elements are what the reproducibility literature considers the minimum bar for independently verifiable research.
A pre-registered analysis plan and a proper README round this out by documenting your hypotheses, thresholds, and exclusion criteria before you saw the data, and by giving a reviewer a map of the repository.
Before submission, confirm you have:
- A workflow file (Snakemake, Nextflow, or CWL) that defines every step, not just a narrative description
- A lockfile or container digest pinning every dependency version
- A Zenodo DOI or Software Heritage SWHID tied to the exact code version used
- An analysis plan written and dated before the first model ran
- A README that a collaborator outside your lab could follow cold
Pro Tip: Write your README as if the person reading it just inherited your project after you left the lab. If it doesn’t answer “how do I run this from scratch,” it’s not done.
A Compact Reproducible Workflow: Explore, Refine, Produce
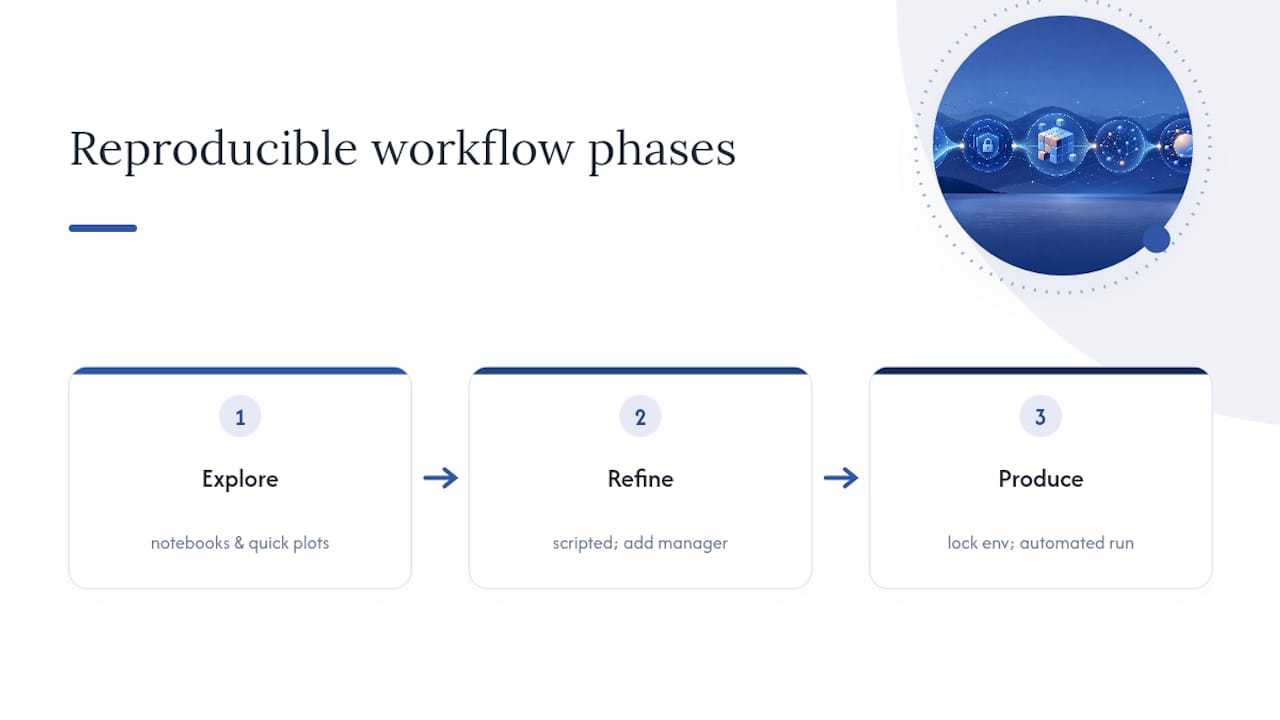
Most reproducibility failures aren’t caused by bad statistics. They’re caused by workflows that were never designed to be rerun. A three-phase structure fixes this by matching each phase to a different audience and a different level of rigor, an approach PLOS Computational Biology frames as Explore, Refine, and Produce.
1. Explore. This is messy by design. Notebooks, quick plots, dead ends. Keep it in its own directory and never let it touch your final pipeline.
2. Refine. Once an analysis approach earns its place, convert it into scripted, parameterized steps. This is where you introduce a workflow manager. For a handful of sequential scripts, make all is often enough. For anything with branching dependencies or parallelizable steps, Snakemake (snakemake --cores 4) or Nextflow scales better and gives you a visual DAG for free.
3. Produce. Lock the environment, run the whole pipeline automatically, and generate outputs meant for submission.
A directory layout that survives peer review typically looks like this: raw data stays immutable and read-only; intermediate files are treated as fully regenerable and never manually edited; final outputs regenerate from the pipeline, never hand-assembled in Excel.
For environment pinning, pick one and commit to it: renv::snapshot() for R projects, a conda environment.yml with pinned versions for Python, or a Docker build referenced by its content digest rather than a mutable tag like latest. Journal-grade guidance treats automated environment files as a submission requirement, not a nice-to-have.
Automate the full run with a single command, whether that’s snakemake --cores all or a CI job triggered on every push, and have it produce your actual deliverables: annotated Jupyter or R Markdown notebooks, a compiled PDF report, and a replication package folder structured for a reviewer to unzip and run.
How Should You Handle Sensitive or Regulated Data?
If your dataset carries IRB approval, NHS provenance, or GDPR special-category status, cloud upload usually isn’t a judgment call. It’s a compliance question with one answer: process locally, or don’t process at all. Tools like PlotStudio that run analysis entirely on the researcher’s own machine sidestep the question by design, since data that never leaves the device can’t trigger a cross-border transfer review.
When de-identified sharing is genuinely required, differential privacy is the leading formal option, but it isn’t free. Adding calibrated noise to protect individual records also inflates standard errors and can bias point estimates if the mechanism isn’t accounted for in your inference. Research on privacy-protected inference shows that naive analysis of DP-noised data routinely produces confidence intervals that are too narrow unless you apply bias corrections designed for the specific mechanism used.
Differential privacy also breaks assumptions baked into standard frequentist workflows, including how control variables scale and how exploratory analysis behaves, which is why some DP researchers recommend Bayesian alternatives when the noise mechanism is severe.
Design choices that keep inference valid under these constraints:
- Pre-register your analysis before allocating any privacy budget to exploratory queries
- Bound sensitivity parameters up front rather than tuning them after seeing results
- Cap the number of queries against the same dataset to avoid budget exhaustion
- Prefer robust or bias-corrected estimators over standard OLS when noise is non-trivial
- Report your privacy parameters (epsilon, delta) alongside your confidence intervals, not as a footnote
Two-part validation server patterns, where a public synthetic extract supports exploration and a locked validation server confirms final numbers, offer a middle path when full local processing isn’t feasible but full public release is unacceptable.
What Artifacts Do Journals and Funders Actually Expect?
A GitHub link alone will not satisfy most reproducibility editors anymore. What they expect is a self-contained replication package that survives independently of any single platform’s uptime.
The baseline package includes:
- A README explaining setup, data access, and how to reproduce every figure and table
- A
CITATION.cffor.zenodo.jsonfile with machine-readable citation metadata - A stated license
- Sample outputs a reviewer can diff against their own run
- The workflow definition file itself, whether Snakemake, Nextflow, or CWL, alongside the pinned environment or container it depends on
Archival strategy matters as much as the package contents. CASRAI’s reproducibility infrastructure guide recommends pairing a working repository with a durable deposit: Zenodo for a versioned DataCite DOI, and Software Heritage for content-addressed, long-term preservation via a SWHID. Neither substitutes for the other. Zenodo gives you a citable, versioned snapshot; Software Heritage guarantees the code still exists even if every other host disappears.
Your code availability statement should link both the live repository and the archival deposit, never just one. For workflow documentation and handoff standards more broadly, our research reproducibility guide walks through building this package end to end. Export formats matter too: annotated notebooks that explain each decision inline, a compiled PDF for readers who won’t run code, and the full bundle zipped for archival upload.
What Are the Most Common Reproducibility Failures?
Most failures trace back to a handful of repeat offenders. Provenance best practices research flags absolute local file paths (/Users/yourname/project/) as one of the single most common causes of a pipeline that runs for you and fails for everyone else. Mutable container tags, unset random seeds, and missing lockfiles round out the usual list.
Run this before submission:
- Clone the repository into a fresh directory and run it with zero manual fixes
- Confirm your random seed is set and produces identical output on rerun
- Verify your container by digest, not tag
- Let CI execute the full pipeline and confirm it produces every expected file
Pro Tip: If differential privacy noise is involved, rerun your smoke test twice with the same seed. Identical noise draws confirm your mechanism is deterministic given the seed; drifting results mean your privacy budget accounting has a bug.
What Analytics Concepts Should Product Managers Understand First?
Analytics for product managers running research programs rests on a different foundation than dashboard metrics. The concepts that matter most are statistical validity, provenance, and uncertainty, not click-through rate.
Statistical validity means your conclusions hold up under the assumptions you actually made, not the ones that were convenient. Provenance means every number in your report traces back to a specific script, a specific data version, and a specific environment, so nothing is reconstructed from memory. Uncertainty means every estimate carries a confidence interval or credible interval wide enough to reflect real sampling variation, privacy noise, or missing data, whichever applies.
Product managers running research-grade analysis also need a working grasp of missingness patterns, since data that’s missing not-at-random can quietly bias an entire model if it isn’t flagged before analysis begins. Mixed-effects models, survival analysis, and proportional-hazards methods show up constantly in academic and clinical product work, far more than in typical business dashboards, because the underlying data often involves repeated measures on the same subjects over time.
None of this requires reinventing statistics from scratch. It requires treating your analysis plan as a contract you write before you see the data, and your workflow as something a reviewer, not just you, needs to trust.
What Metrics and KPIs Matter Most in Research-Grade Product Analysis?
The KPIs that matter for defensible research analytics look different from growth-team dashboards. Effect size and its confidence interval matter more than a single p-value, since a statistically significant result with a trivial effect size rarely survives peer review scrutiny intact.
Variance explained, whether reported as R-squared, McFadden’s pseudo-R-squared, or a comparable model fit statistic, tells reviewers how much of the outcome your model actually accounts for. Missingness rate by variable flags which parts of your dataset need imputation strategy documentation before analysis, not after a reviewer asks. Multiple-comparison correction rates, using methods like Bonferroni or Benjamini-Hochberg, become essential the moment you’re running more than a handful of hypothesis tests against the same dataset.
For product teams working with regulated data specifically, track your privacy budget consumption as its own KPI: how many queries you’ve run against a dataset under differential privacy, and how much epsilon remains before further exploration risks degrading your final inference. Reproducibility rate, meaning the percentage of your team’s analyses that pass a fresh-clone smoke test before submission, is a metric worth tracking internally even though no journal will ask for it directly.
How Do You Interpret Analytics Results for Product Decisions?
Interpretation starts before you ever look at output, with the analysis plan you locked in advance. If a result matches what you pre-specified as your primary hypothesis, you can state it with confidence. If it emerged from exploring the data after the fact, label it exploratory and say so explicitly. Conflating the two is one of the more common ways defensible research quietly becomes indefensible.
When a result carries wide confidence intervals, don’t round that uncertainty away in the summary. A hazard ratio of 1.4 with a confidence interval spanning 0.9 to 2.1 is not the same finding as a hazard ratio of 1.4 with a tight interval, even though the point estimate looks identical on a slide. Product decisions built on the first should acknowledge that the direction of the effect isn’t fully settled.
Sensitivity analysis matters here too. If your finding disappears when you swap one reasonable modeling choice for another, equally reasonable one, that instability is itself a finding worth reporting, not a nuisance to bury in a footnote. Robust results survive small changes in specification; fragile ones don’t, and stakeholders deserve to know which kind they’re getting.
Which Tools Do Research Teams Rely on for Analytics Work?
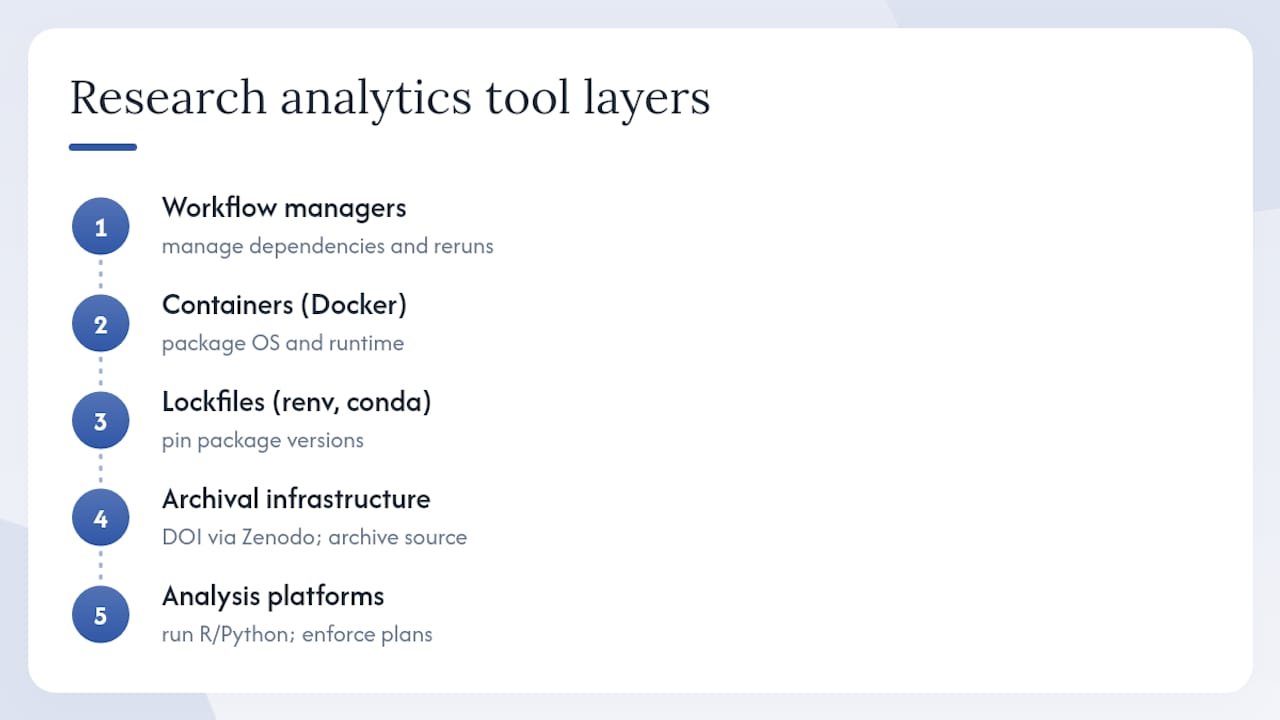
The tool stack for research-grade analytics splits into layers that solve different problems, and conflating them is where a lot of teams go wrong.
Workflow managers, Snakemake and Nextflow chief among them, handle re-execution logic: which script depends on which input, and in what order things rerun when a file changes upstream. Docker handles environment consistency, packaging the OS and runtime so a pipeline behaves identically regardless of where it runs. For lighter-weight dependency pinning without a full container, renv and conda lockfiles capture package versions in a form any collaborator can restore with one command.
Archival infrastructure is its own layer entirely. Zenodo issues a citable DOI tied to a specific, versioned release of your code and data, while Software Heritage preserves the underlying source at the content level, so it survives even if the original hosting platform vanishes. Neither is optional if you want your work citable and recoverable a decade from now.
For the analysis layer itself, agentic platforms like PlotStudio combine statistical execution with the documentation trail reviewers expect, running R and Python natively while keeping data local and gating every run behind an approved analysis plan. That combination matters more for regulated product research than raw computational power does. For teams weighing analysis platforms more broadly, our advanced analytics software guide breaks down the trade-offs.
How Should You Communicate Analytics Findings to Stakeholders?
A stakeholder outside your immediate research team rarely needs your full model specification. They need three things: what you found, how confident you are in it, and what decision it supports.
Lead with the effect size and its uncertainty in plain language before the statistical machinery. “Feature adoption increased response rates by 12 percentage points, with a range of roughly 8 to 16 points depending on modeling assumptions” tells a stakeholder more than a table of coefficients ever will. Save the full model output, diagnostic plots, and robustness checks for an appendix or a linked replication package, not the main narrative.
Visualizations should show uncertainty, not hide it. A bar chart with no error bars implies a precision your data doesn’t have. Annotated notebooks exported alongside a PDF summary let a technical stakeholder trace every claim back to its source while a non-technical one still gets the plain-language version up front. For teams building shared documentation standards across analytics and business functions, this guide on turning data into decision-ready insights covers handoff practices worth adapting for research contexts.
Frame limitations as part of the finding, not a disclaimer tacked onto the end. A result that holds under three sensitivity checks but breaks under a fourth is more useful to a stakeholder than a confident-sounding summary that hides the fragility.
How Do You Integrate Qualitative Data With Quantitative Analytics?
Quantitative results tell you that something happened. Qualitative data, interview transcripts, open-ended survey responses, field notes, tends to tell you why, and research-grade product analysis loses credibility fast when it treats the two as separate workstreams that never talk to each other.
The most defensible approach treats qualitative coding as its own documented analysis plan, with coding schemes decided and, ideally, inter-rater reliability checked before you start pulling themes. Mixed-methods triangulation, where a quantitative pattern gets checked against qualitative explanations for consistency, catches confounds that pure statistics miss. If usage data shows a feature drop-off at a specific step but interview data reveals users found that step confusing rather than undesirable, that’s a materially different product decision than a pure numbers read would suggest.
Document the integration point explicitly in your analysis plan: which quantitative finding motivated which qualitative follow-up, and in what order. Reviewers and grant committees increasingly expect mixed-methods work to show that sequencing rather than presenting two disconnected result sections stitched together after the fact.
Author Perspective: Engineering Reproducibility and Privacy Together
Planning-first isn’t a purity test. It’s what makes privacy-preserving analysis survivable, because you can’t retrofit a pre-registered plan onto data you’ve already explored six different ways. The two disciplines, reproducibility and privacy, actually reinforce each other: locking your analysis plan before you see the data is also what protects you from privacy-budget exhaustion. Adopt the checklist here for your next grant protocol or IRB submission before you need it, not after a reviewer asks where your lockfile is.
— Aymen
How PlotStudio Maps to This Reproducibility Checklist
Every element in this checklist has a corresponding feature in PlotStudio, which is precisely the point of building it this way. Local execution means your IRB-governed or NHS patient data never leaves your machine, satisfying the compliance requirement outright rather than working around it. Gated analysis plans, reviewed and approved before any code executes, function as the pre-registration and audit trail reviewers ask for. Skills let your lab encode discipline-specific methods, required steps, statistical thresholds, forbidden shortcuts, once, so every subsequent analysis follows your field’s conventions automatically rather than a generic default.

Native R and Python support means you’re not forced into a single ecosystem to run survival analysis, mixed-effects models, or Cox proportional hazards regression. And the exports, annotated notebooks, PDF reports, and permanent searchable analysis pages, give you the replication package a journal or grant reviewer expects without assembling it by hand.
If you’re preparing a submission where privacy and defensibility both matter, start with a free trial to test PlotStudio’s AI data analyst against your own dataset, or explore enterprise deployment options if your institution needs organization-wide governance built in from day one.
Sources
- Reproducible Research: A Guide for Researchers (NCBI Bookshelf)
- Reproducibility
- Statistically valid inferences from privacy-protected data (American Political Science Review / Cambridge)