Automated Statistical Analysis for Reproducible Research

Automated statistical analysis can deliver reproducible, assumption-checked, exportable results for routine and repeated inferential workflows, provided you apply pre-registered analysis plans and sandboxed execution. That last clause matters: automation without those controls just produces faster wrong answers. With them, a system can profile your data, run diagnostics like Shapiro-Wilk and Levene’s test, select an appropriate model, and hand you an audit trail a reviewer can actually trace.
This works whether you’re running the analysis in R, Python, or a platform that orchestrates both. What it does not replace is judgment on study design, causal claims, or genuinely novel modeling questions.
- Speed: automation reduces manual test selection and diagnostic checking time significantly
- Reproducibility: every step gets logged, from data ingestion to final output
- Assumption checking: key assumptions like normality, variance homogeneity, and independence are tested before trusting a p-value
Pro Tip: If you’re new to this, start with a project you’ve already analyzed manually. Compare the automated output against your own results before trusting it on new data. Read on for the workflow stages, the tools that support them, and a checklist for setting this up on your own data this week.
Key Takeaways
Automated statistical analysis becomes research-grade only when assumption checks, a reviewed analysis plan, and reproducible exports gate every step before results reach a paper or report.
| Point | Details |
|---|---|
| Diagnostics come first | Run Shapiro-Wilk, Levene’s test, and independence checks before selecting a statistical test. |
| Plan before you run code | A pre-registered analysis plan sets methods and success criteria, functioning as an audit trail. |
| Match architecture to the task | Use R for specialized biostatistics packages, Python for general linear models, or both natively. |
| Know the poor fits | Skip automation for exploratory theory-building work and bespoke causal inference designs. |
| PlotStudio gates execution behind plan review | PlotStudio runs R and Python locally, reviews analysis plans before code runs, and exports notebooks, PDF reports, and searchable pages. |
Table of Contents
- What Is Automated Statistical Analysis?
- How Does Automation Handle Assumption Checking and Model Selection?
- What Tools and Architectures Support Automated Data Analysis?
- When Should You Automate, and When Should You Not?
- How Do You Start Automating a Statistical Workflow?
- How Does PlotStudio Apply These Controls in Practice?
- What Should You Actually Prioritize First?
- Get Research-Grade Automation Without Sending Data Anywhere
- Frequently Asked Questions
- Sources
What Is Automated Statistical Analysis?
Automated statistical analysis combines four functions that used to require a human at every step: planning the analysis, generating the code to run it, executing that code, and interpreting the result into a report. A system that only does one of those (say, auto-generating a chart) isn’t automating analysis. It’s automating a task inside one.
The canonical workflow looks like this in most research-grade tools:
- Ingest the dataset and detect its structure (types, encodings, missing patterns)
- Profile variables for distributions, outliers, and cardinality
- Clean according to documented rules, not silent defaults
- Run diagnostics to check assumptions behind the intended test or model
- Select the statistical test or model based on what the diagnostics allow
- Execute the code in a controlled environment
- Interpret the output into plain-language findings
- Export a reproducible package: code, results, and reasoning together
Research-grade automation adds three things a generic chart tool skips: an audit trail showing every decision the system made, outputs you can regenerate identically from the same inputs, and control over where your data physically runs. That third point matters more than most researchers realize until an IRB reviewer asks about it directly.
How Does Automation Handle Assumption Checking and Model Selection?
The technical core of trustworthy automation is diagnostic checking before test execution, not after. Automated pipelines run diagnostic checks for normality, variance homogeneity, and independence as a gate, flagging violations and suggesting alternatives rather than plowing ahead with an invalid parametric test.
That gate has to produce a decision, not just a warning. If your data fails normality, the system should route you to an appropriate nonparametric alternative test instead of the parametric test originally planned. When you’re running dozens of comparisons at once, correction procedures for multiple comparisons should be applied automatically rather than relying on manual intervention.
The orchestration pattern that makes this defensible follows a specific shape:
- An analysis plan states the intended method, the assumptions it depends on, and what counts as a meaningful result
- The system generates code iteratively, checking its own outputs as it goes
- Execution happens in a controlled execution environment, isolated from your live data and system
- Every intermediate result gets logged, not just the final number
Execution-grounded systems that stream these action traces in real time let you watch the reasoning unfold instead of receiving a black-box verdict. That streaming matters for review: a peer or supervisor can see exactly where a decision was made, not just what the final decision was.
Pro Tip: Never accept a p-value from an automated system without checking which test actually ran. A one-line summary that says “significant difference found” is meaningless if you can’t see whether it came from a t-test or its nonparametric substitute.
What Tools and Architectures Support Automated Data Analysis?
Choosing an architecture for automated data analysis work comes down to a handful of real trade-offs, not brand preference.
R versus Python for inferential statistics is less a rivalry than a division of strengths. R’s ecosystem, including survival for time-to-event data, lme4 for mixed-effects models, still leads for specialized biostatistics work. Python’s statsmodels and scipy.stats cover general linear models and hypothesis testing with cleaner integration into broader data pipelines. Systems that run both natively, rather than forcing a translation layer, avoid the reproducibility gaps that creep in when you convert code between languages mid-project.
Agentic orchestration versus single-model helpers is the bigger architectural question. A single large language model asked to “analyze this data” will happily generate plausible-looking code with no verification step. Multi-agent systems built for end-to-end data analysis separate planning, execution, and verification into distinct steps, so a coding error gets caught before it reaches your report rather than after.
Sandboxing through session-scoped Docker containers keeps generated code from touching anything outside its own isolated environment, which is non-negotiable once you’re running code an AI system wrote rather than code you wrote yourself.
For exports, insist on:
- Annotated notebooks (Jupyter remains the standard format for code, output, and narrative together)
- PDF reports for non-technical stakeholders
- Searchable analysis pages you can retrieve months later
- Versioned analysis plans tied to each run
R packages like AutoStat show where this is headed: natural-language requests turning into executable, auditable R code with an interpreted report attached, and configurable generation parameters so output stays consistent across runs.
When Should You Automate, and When Should You Not?
Automation earns its keep on repetitive, well-specified work. It struggles on anything requiring genuine judgment about what question to ask.
Good fits:
- Routine group comparisons on similar datasets
- Exploratory data analysis across multiple similar cohorts or sites
- Scheduled monitoring reports
- Standard diagnostic checks before formal tests
Poor fits:
- Exploratory, theory-building research with evolving questions
- Custom causal inference designs needing domain expertise
- Novel modeling approaches lacking established implementations
The risks cluster around three failure modes: garbage-in-garbage-out (automation doesn’t fix a bad sampling design), misapplied tests when diagnostics get skipped or overridden, and over-trusting a language model’s plain-English interpretation of a statistical result without checking the underlying numbers.
Controls that catch most of this: pre-registering the analysis plan before running anything, running sensitivity analyses on your key results, and having a colleague review the exported notebook before submission, not after.
How Do You Start Automating a Statistical Workflow?
A working setup takes less time than most researchers expect. Here’s the order that actually holds up in practice.
- Define the question and pre-register the plan. Write down the method, the assumptions it depends on, and what result would count as meaningful, before touching the data.
- Confirm data governance. If you’re working with IRB-governed, NHS, or GDPR special-category data, settle where the analysis will physically run before you start.
- Run automated profiling. Let the system flag missingness, encoding issues, and outliers, then set explicit rules for how missing data gets handled.
- Document variables and units. A model can’t catch a units mismatch if nobody told it what the units are.
- Choose your runtime and enable sandboxed execution. Set the assumption-check thresholds and decide the fallback rule now, not mid-analysis.
- Inspect the diagnostic trace. Read what the system actually checked before you trust what it concluded.
- Run sensitivity tests on any borderline result.
- Export the full package: annotated notebook, PDF report, and the archived analysis plan together.
- Schedule recurring runs with monitoring alerts if the workflow repeats on new data.
Pro Tip: Archive your analysis plan even for exploratory work you don’t intend to publish. Six months later, you will not remember why you chose Levene’s test over Bartlett’s, and the plan will.
How Does PlotStudio Apply These Controls in Practice?
PlotStudio treats the analysis plan as a gate, not a formality: methods, assumptions, and success criteria get reviewed and approved before any code executes, functioning as a pre-registration record and an audit trail in one document. That single design choice separates research-grade tooling from a chat interface that just runs whatever it’s asked.

Analysis runs locally on the researcher’s own machine, which makes it a workable option for datasets that legally cannot leave the device, alongside enterprise deployment for labs managing this across a team. PlotStudio runs R and Python natively and covers methods academic work actually needs: survival analysis, Cox proportional hazards, mixed-effects models, ANOVA with multiple-comparison correction.
Every run exports a full reproducibility package: annotated notebooks, PDF reports, and a permanent searchable analysis page.
Skills let a lab encode how their field does analysis once, required steps, statistical thresholds, forbidden shortcuts, so every subsequent run follows that discipline’s methodology instead of a generic default.
- Local execution for sensitive data
- Analysis-plan review before code runs
- R and Python support for advanced methods
- Notebook, PDF, and searchable exports
What Should You Actually Prioritize First?
The conventional advice on automating statistics focuses almost entirely on speed: how fast can a tool get you from raw data to a p-value. That’s the wrong first question. The right one is whether you can hand the output to a skeptical reviewer and trace every decision back to a stated assumption.
Most automation failures I’ve seen in research contexts trace back to skipping the plan, not skipping the code. A researcher runs a quick automated comparison, likes the result, and never documents what test actually ran or why. Six months later, at revision stage, nobody can reconstruct it. Automation didn’t cause that problem. It just made it faster to reach.
What should change first isn’t the tooling, it’s the habit: write the analysis plan before you touch the data, whether or not you’re using an automated system at all. The tools that force that step, gating execution behind a reviewed plan, are solving the actual failure mode. The ones that just generate a fast chart are solving a problem researchers didn’t have.
Get Research-Grade Automation Without Sending Data Anywhere
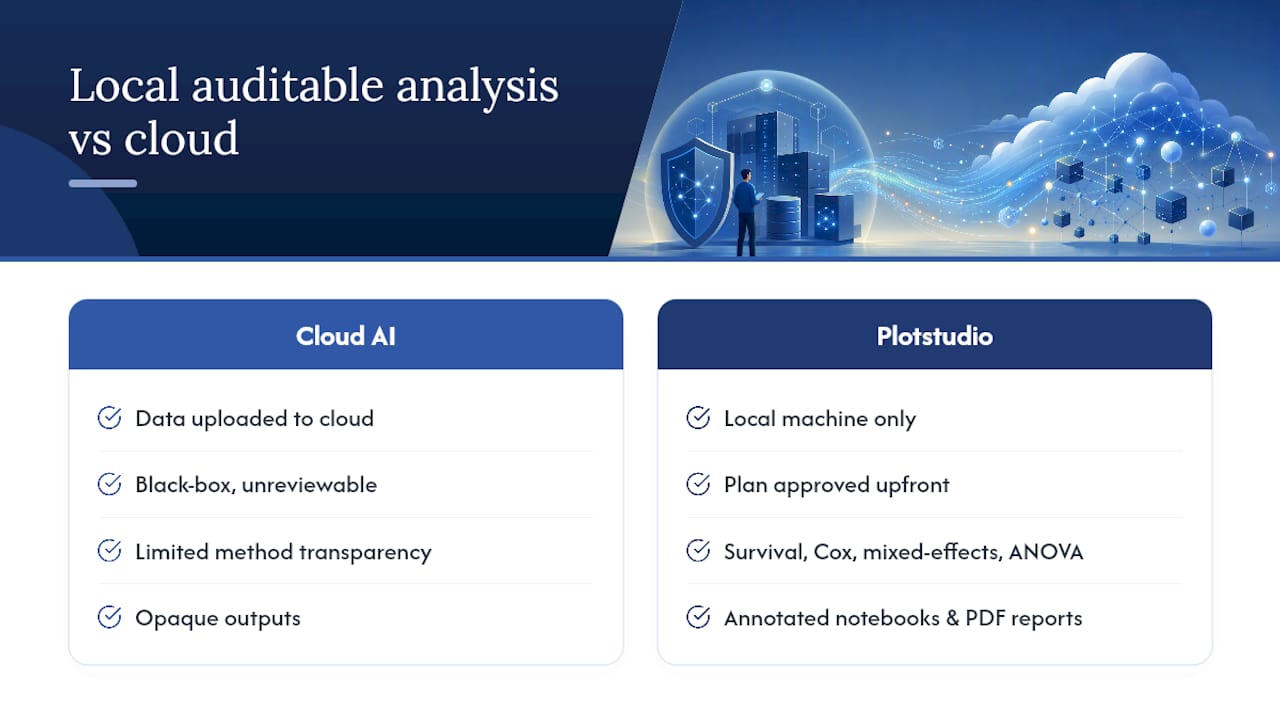
Plotstudio gets you from raw dataset to a defensible, reviewer-ready result without uploading anything to a cloud server, which is the practical dividing line for IRB-governed, NHS, or GDPR special-category work that most general AI analytics tools simply can’t touch.

Where other AI analytics tools run in the cloud and hand you an unreviewable black box, Plotstudio gates every analysis behind a plan you approve first, methods, assumptions, and success criteria stated up front, then runs the actual computation locally on your machine. You get survival analysis, Cox models, mixed-effects models, and ANOVA with proper correction, in R or Python, exported as annotated notebooks and PDF reports a supervisor or peer reviewer can actually trace. Labs can encode their own methodology as reusable Skills so every analysis follows the same discipline-specific standards.
If your next paper, thesis chapter, or grant analysis needs to survive peer review, start with a project you already understand and try Plotstudio’s enterprise deployment to see the audit trail for yourself.
Frequently Asked Questions
Is automated statistical analysis reliable enough for peer-reviewed research?
It can be, if the system runs diagnostic checks before test selection and exports a full audit trail. Reliability depends on the controls around the automation, not the automation itself.
Does automated statistical analysis replace a statistician?
No. It removes repetitive work like test selection and code writing, but study design, causal reasoning, and interpreting borderline results still need a trained human.
Which is better for automating statistics, R or Python?
Neither wins outright. R’s package ecosystem (survival, lme4) leads for specialized biostatistics; Python’s statsmodels integrates more easily into broader data pipelines. Tools that run both natively avoid translation errors.
What happens when an automated system’s assumption check fails?
A well-built pipeline should flag the violation and switch to an appropriate alternative test, such as a nonparametric method, rather than proceeding with an invalid parametric result.
Can automated statistical analysis handle sensitive patient data?
Only if it runs locally or in a controlled environment you manage. Cloud-only tools generally can’t be used for IRB-governed, NHS, or GDPR special-category data without violating data governance rules.
Sources
- statpilot on PyPI
- DA-Studio: An Agentic System for End-to-End Data Analysis (arXiv)
- AutoStat — GitHub