Best Regression Software for Reproducible Academic Research

For academic researchers who need peer-review-ready, privacy-compliant regression analyses, Plotstudio is the recommended platform. It runs analyses locally on your machine, gates every model run behind a researcher-approved analysis plan, and exports full reproducibility packages — annotated notebooks, PDF reports, and permanent searchable analysis pages. That combination directly satisfies the three requirements peer reviewers and IRB protocols impose: a traceable audit trail, documented pre-registration, and data that never leaves your environment.
Getting started takes three steps:
- Start a free trial or apply for research partner credits to access the full feature set without a long-term commitment.
- Load a small, IRB-approved dataset and run a sample regression — mixed-effects, OLS, or Cox — to verify local processing and method coverage.
- Export the reproducibility package and confirm the annotated notebook and PDF report meet your journal’s or supervisor’s documentation standards.
Table of Contents
- Why reproducibility and privacy are non-negotiable in academic regression
- What are the two dominant regression software paradigms?
- What should you check before committing to regression analysis software?
- How does Plotstudio meet the research-grade checklist?
- A step-by-step reproducible regression workflow
- What should U.S. academic buyers expect for costs and deployment?
- Key Takeaways
- The case for choosing your paradigm deliberately
- Plotstudio gives academic researchers a faster path to defensible results
- Useful sources and further reading
Why reproducibility and privacy are non-negotiable in academic regression
Peer review increasingly demands more than a coefficient table. Journals and funding agencies now expect researchers to supply the full chain: raw data, cleaning decisions, model assumptions, diagnostics, and final outputs linked into a traceable audit trail. Saving scripts alone does not meet that standard. Duke University’s regression diagnostics guidance makes the point explicitly: documenting tests for residuals, multicollinearity, missing data handling, and model-selection decisions is what separates a reproducible analysis from a replicable-in-theory one.
Privacy constraints add a second layer of complexity. U.S. academic work frequently involves HIPAA-governed patient records, IRB-restricted survey data, or datasets with direct identifiers. Uploading those files to a cloud analysis tool is not a gray area — it is a compliance violation. Local data processing, combined with automated PII detection and anonymization, is the only architecture that keeps sensitive data within the approved data environment.
Audit trails and pre-registered analysis plans reduce reviewer friction in a concrete way. When the methods, assumptions, and success criteria are locked before any code runs, post-hoc model fishing becomes structurally impossible. That is not just good practice; it is the mechanism that makes a result defensible under scrutiny.
Pro Tip: Gate your analysis plan before touching the data. Approving the plan first — specifying covariates, transformations, and hypothesis tests — creates a timestamped record that functions as a pre-registration even when a formal registry submission is not required.
What are the two dominant regression software paradigms?
Regression analysis software in 2026 splits cleanly into two paradigms, and choosing the wrong one for your workflow creates reproducibility problems that are hard to fix later.
Code-first econometrics platforms — R base stats, Python statsmodels, gretl, and similar scripted environments — give researchers direct control over formula specification, estimator choice, and postestimation diagnostics. They support robust and clustered standard errors, GMM, LASSO/Ridge via glmnet, and custom estimators. The reproducibility burden falls entirely on the researcher: version control, script organization, and documentation are manual.
Workflow-driven platforms surface assumption checks and evaluation through visual pipelines or node graphs. Tools like KNIME and RapidMiner let non-programmer collaborators build repeatable preprocessing-to-modeling chains without writing code. IBM SPSS sits in a middle position, offering interactive diagnostic plots and standardized reporting inside a GUI. The trade-off is less estimator flexibility and, often, weaker postestimation depth.
| Dimension | Code-first platforms | Workflow-driven platforms |
|---|---|---|
| Estimator flexibility | High — custom formulas, GMM, IV, LASSO | Moderate — standard models, limited custom estimators |
| Diagnostic depth | Full postestimation suite | Standardized plots, limited influence diagnostics |
| Reproducibility mechanism | Manual (scripts, version control) | Pipeline-native, but audit trail quality varies |
| Collaboration for non-programmers | Low | High |
| Publication-ready output | Requires additional formatting | Often built-in reporting templates |
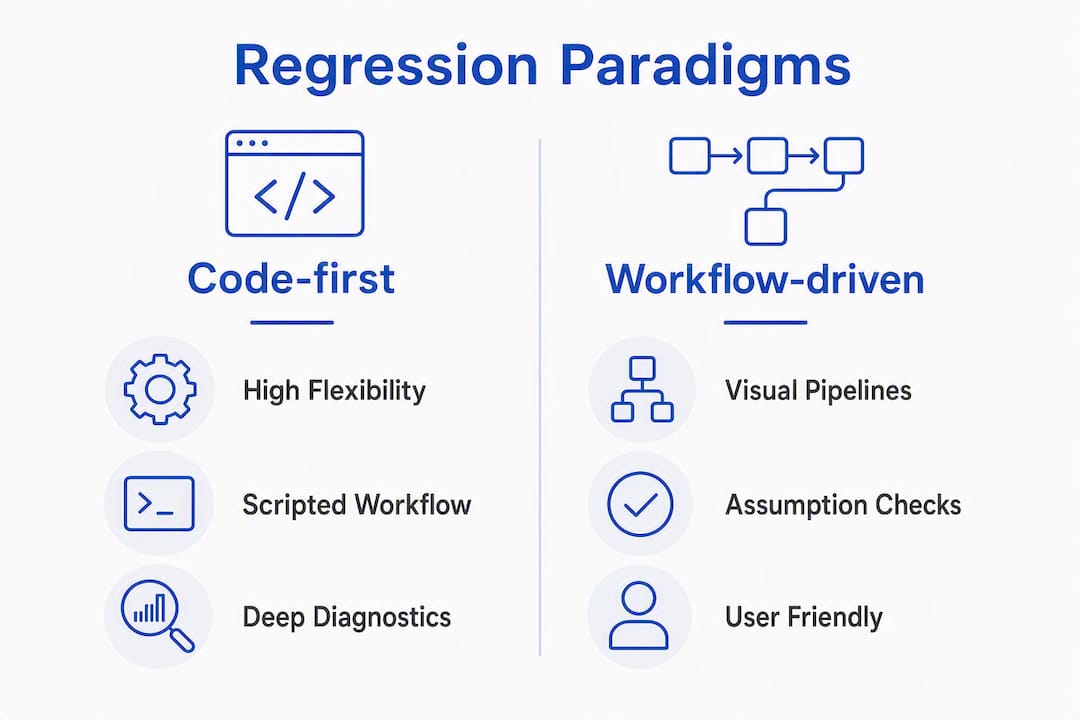
Plotstudio occupies a distinct third position: it runs R and Python natively (code-first depth) inside a gated, audited workflow (workflow-driven structure), combining the diagnostic precision of scripted environments with the repeatable pipeline discipline that makes outputs defensible.
What should you check before committing to regression analysis software?
A hands-on trial with your actual data is the only reliable evaluation method. Work through this checklist before signing any license.
- Core method coverage: Confirm native support for mixed-effects models, survival/Cox proportional hazards, instrumental variables, ANOVA, and robust/clustered standard errors. A platform strong in OLS but silent on postestimation tools will create gaps in published work.
- Reproducibility exports: Request an annotated notebook and a PDF report from a sample run. If the platform cannot produce both, the audit trail is incomplete.
- Analysis-plan gating: Ask whether the platform enforces plan approval before code execution. If model specification can be changed after seeing preliminary results, the pre-registration value is zero.
- Local data handling: Confirm that no data leaves the device during analysis. Ask for documentation of the data-residency architecture, not just a verbal assurance.
- PII detection and anonymization: For datasets with direct identifiers, verify automated detection and anonymization are built in, not bolted on.
- Diagnostics suite: Run VIF for multicollinearity, Breusch-Pagan or White tests for heteroskedasticity, and Cook’s distance for influence. If any require manual computation outside the platform, factor in the error risk.
- Scalability: Fit a model on your largest expected dataset. Note wall-clock time and whether parallel or cluster options exist.
- Licensing and data residency for U.S. procurement: Ask for a data processing agreement, SLA documentation, and confirmation of FERPA/HIPAA compatibility before routing to institutional IT.
Red flags during trial: a platform that cannot export a notebook, requires cloud upload for any processing step, or lacks influence diagnostics should not advance past the pilot stage for IRB-governed research.
How does Plotstudio meet the research-grade checklist?
Plotstudio was built specifically for the constraints academic researchers face. Every feature maps to a concrete checklist requirement.
Local processing means the data never leaves your machine — the architecture that makes it viable for IRB-governed, HIPAA-adjacent, or GDPR special-category datasets where cloud upload is prohibited. Analysis-plan gating requires the researcher to review and approve methods, assumptions, and success criteria before any code runs, creating a timestamped pre-registration and audit trail in a single step.

The platform runs R and Python natively, covering mixed-effects models, survival analysis, Cox proportional hazards, instrumental variable regression, ANOVA, and multiple-comparison correction. Diagnostics — residuals, VIF, Cook’s distance, heteroskedasticity tests — are automated and logged. Every completed analysis exports an annotated notebook, a PDF report, and a permanent searchable analysis page that a supervisor or reviewer can access to trace the full method chain.
| Feature | Plotstudio capability |
|---|---|
| Local data processing | Yes — no cloud upload at any stage |
| Analysis-plan gating | Yes — plan approval required before code runs |
| Reproducibility exports | Annotated notebook, PDF report, searchable analysis page |
| Native R and Python | Yes — both runtimes supported |
| Advanced methods | Mixed-effects, Cox, IV, ANOVA, survival, multiple-comparison correction |
| Automated diagnostics | VIF, Cook’s distance, residual plots, heteroskedasticity tests |
A practical example: a researcher running a Cox proportional hazards model on de-identified patient survival data loads the CSV locally, approves an analysis plan specifying the covariates, time variable, and proportional-hazards assumption test, then runs the model. Plotstudio executes in R, logs every preprocessing decision, runs the Schoenfeld residuals test automatically, and exports the full package — notebook, PDF, and analysis page — ready for supervisor review. The PlotStudio regression interpretation guide provides additional support for reading coefficient tables and diagnostics within that workflow.
A step-by-step reproducible regression workflow
This sequence applies to a single-author project. Team projects add a review gate between steps 4 and 5.
- Data ingestion and format checks — Load the dataset, verify column types, and confirm no automatic type coercion has occurred. Output: ingestion log.
- Missing-data strategy — Document missingness patterns, choose an imputation method (listwise deletion, multiple imputation), and log the decision with justification. Output: missingness report.
- Variable construction — Build derived variables via script, not manual edits. Log every transformation. Output: variable construction script.
- Pre-registered analysis plan — Specify the model formula, covariates, estimator, assumption tests, and success criteria. Approve and timestamp before proceeding. Output: locked analysis plan.
- Model specification and estimation — Run the model. For robust standard errors, specify the covariance estimator in the plan. Output: coefficient table, model fit statistics.
- Assumption checks — Run residual plots, VIF, heteroskedasticity tests, and Cook’s distance. Flag violations and document remediation. Output: diagnostics file.
- Sensitivity and robustness checks — Re-run with alternative specifications or subsamples. Output: sensitivity table.
- Export and documentation — Generate the annotated notebook, PDF report, and analysis page. Output: full reproducibility package.
| Phase | Single-author timeline | Team timeline |
|---|---|---|
| Data cleaning and ingestion | a few days | a few days |
| Modeling and diagnostics | several days | several days |
| Packaging and documentation | about a day | a couple of days |
Pro Tip: Document every non-obvious preprocessing decision — outlier exclusion thresholds, encoding choices for categorical variables, and imputation model parameters — in the analysis plan before running the model. These are the decisions that most commonly break replication when a collaborator tries to reproduce results six months later.
What should U.S. academic buyers expect for costs and deployment?
Plotstudio offers seat-based and credits-based subscriptions, a freemium trial, and enterprise licensing for lab-wide or departmental deployment. Research partnership credits are available for qualifying academic groups. Beyond the license fee, budget for onboarding time, any integration with institutional storage systems, and training for collaborators who have not used an agentic analytics platform before.
Deployment options matter for compliance:
- Local desktop install — the default for individual researchers; data stays on the device, satisfying most IRB and HIPAA data-residency requirements.
- Enterprise Azure deployment — available for institutions that need managed infrastructure, centralized access control, and IT-governed data environments.
- Freemium or research-partner trial — the fastest path to a pilot; start here before routing to institutional procurement.
For U.S. university procurement, prepare: a data processing agreement request, confirmation of FERPA/HIPAA compatibility, SLA documentation, a training plan for lab members, and confirmation that the deployment architecture matches your IRB-approved data environment. Typical timeline from trial to a lab-level subscription runs several weeks to a couple of months when IT and procurement are engaged early.
Key Takeaways
Plotstudio is the strongest choice for U.S. academic researchers who need local data processing, pre-registered analysis plans, and exportable reproducibility packages in a single platform.
| Point | Details |
|---|---|
| Local processing is non-negotiable | IRB and HIPAA constraints require data to stay on-device; cloud-upload tools are not compliant options. |
| Gate the plan before running code | Approving the analysis plan first creates a timestamped pre-registration and eliminates post-hoc model fishing. |
| Export the full reproducibility package | Annotated notebooks, PDF reports, and searchable analysis pages are the minimum for peer-review-ready documentation. |
| Match the paradigm to your workflow | Code-first tools give diagnostic depth; workflow-driven platforms add pipeline discipline — Plotstudio provides both. |
| Plotstudio for academic regression | Covers mixed-effects, Cox, IV, and ANOVA natively, with automated diagnostics and local processing built in. |
The case for choosing your paradigm deliberately
The conventional wisdom in academic statistics is that code-first tools are always the rigorous choice. That framing is too simple. A researcher who writes bespoke R scripts for every project has full estimator control, but also full responsibility for documentation, version control, and audit trails — and those responsibilities are where reproducibility actually breaks down in practice. The scripts exist; the decision log does not.
Workflow-driven platforms solve the documentation problem but often sacrifice diagnostic depth. The researcher who cannot run Cook’s distance or a Schoenfeld residuals test natively is computing them by hand, which introduces exactly the kind of human error that peer review is designed to catch.
The more useful question is not “code-first or workflow-driven?” but “where does my reproducibility risk actually live?” For most academic projects, the risk is not in the estimator — it is in the undocumented preprocessing step, the covariate added after seeing the first results, or the assumption check that was skipped because it required a separate package. A platform that gates execution behind an approved plan addresses those risks structurally, not through researcher discipline alone.
For hybrid workflows: keep raw data and variable construction scripts under version control (Git or an institutional repository), and use a gated platform for production model runs and exports. That combination gives you the auditability of a workflow-driven system and the transparency of scripted code.
Plotstudio gives academic researchers a faster path to defensible results
Researchers who need reproducible, privacy-compliant regression analyses without building a manual audit infrastructure from scratch have a direct option. Plotstudio runs analyses locally, gates every model run behind an approved plan, and exports a complete reproducibility package — all in one workflow.

Three ways to get started: apply for research partner access to run a pilot with your lab’s data at no cost; start a free trial and test local data handling, analysis-plan gating, and native R/Python execution on a small IRB-approved dataset; or contact the team via the enterprise page for Azure deployment details and institutional licensing. Export a reproducibility package from your first run and verify it meets your journal’s or supervisor’s documentation standard before committing to a full subscription.
Useful sources and further reading
- Testing Regression Assumptions — RNau, Duke University — practical guidance on residual diagnostics, multicollinearity, and model-selection documentation.
- PlotStudio: How to Interpret Regression Results — guide to reading coefficient tables, diagnostics, and reporting conventions.
- PlotStudio: Instrumental Variable Regression Guide — practical walkthrough for IV estimation and 2SLS workflows.
- PlotStudio: Robust Standard Errors Guide — when and how to apply heteroskedasticity-robust and clustered standard errors.