Churn Prediction Analytics: A Practical Guide for Analysts

Churn prediction analytics is the practice of using historical customer data to score the probability that a given account or user will stop paying, renewing, or engaging within a defined window. The recommended starting approach: prioritize data richness over model complexity, run an explainable ensemble model first, and connect the output to a decision-intelligence layer that routes scores into retention spend rather than a dashboard nobody reads.
Three moves get you there fastest:
- Define the churn window precisely (30/60/90 days or time-to-event) before touching a model.
- Assemble behavioral and billing signals — usage events, payment history, support tickets — as your feature base.
- Run a baseline gradient-boosted model (XGBoost or LightGBM) with SHAP explainability from day one, not as an afterthought.
Key Takeaways
Reliable churn prediction analytics combines explainable ensemble models, disciplined time-based validation, and a decision-intelligence layer that routes scores into budget-aware retention action.
| Point | Details |
|---|---|
| Start with explainable ensembles | Gradient-boosted trees like XGBoost deliver strong AUC-ROC while SHAP keeps drivers interpretable. |
| Fix your label before modeling | Lock the churn window and prevent leakage from future or post-churn signals. |
| Feature richness beats algorithm swaps | Relational joins and RFT patterns typically outperform choosing a fancier model. |
| Validate on time, not randomness | Time-split backtesting and calibration checks catch inflated performance early. |
| Connect scores to ROI | Uplift tests confirm interventions actually work before scaling retention spend. |
| Plotstudio for reproducible workflows | Local execution, pre-registered analysis plans, and exportable audit trails support defensible churn analysis. |
Table of Contents
- Why Predict Churn: Business Value and the KPIs That Matter
- How Should You Define Churn and Label It?
- Which Models Should You Try, and When?
- How Do You Evaluate a Churn Model Correctly?
- How Do You Turn Predictions Into Retention Actions?
- What Mistakes Wreck Churn Models, and How Do You Avoid Them?
- What Belongs on Your Deployment and Monitoring Checklist?
- How Do You Make Churn Analysis Defensible and Reproducible?
- What Should Analysts Prioritize in the First 90 Days?
- How Plotstudio Supports Defensible Churn Analytics
- Sources
Why Predict Churn: Business Value and the KPIs That Matter
Churn prediction only earns its keep when it’s tied to revenue math, not model accuracy for its own sake.
Track these KPIs, not just AUC:
- Customer churn rate and revenue churn rate separately. In B2B especially, revenue-weighted churn often tells a very different story than headcount churn, since losing one enterprise account can outweigh fifty small ones.
- Retention lift from targeted cohorts versus a holdout group.
- Lift@k (how much better your top decile performs than random selection).
- Cost-per-intervention and ROI on retention spend.
Pro Tip: If a false positive (contacting a customer who wasn’t leaving) costs you a discount you didn’t need to give, optimize for precision. If a false negative (missing a real churn risk) costs you the entire account, optimize for recall instead. The two rarely point the same direction.
How Should You Define Churn and Label It?
Churn labeling looks simple until you try to reproduce it six months later with a different analyst on the team. Subscription businesses typically define churn as non-renewal at contract end; consumption products often use an inactivity window (no login or usage event in N days); B2B platforms frequently need account-level labels that aggregate multiple seats.
The window you choose changes what “churn” even means statistically.
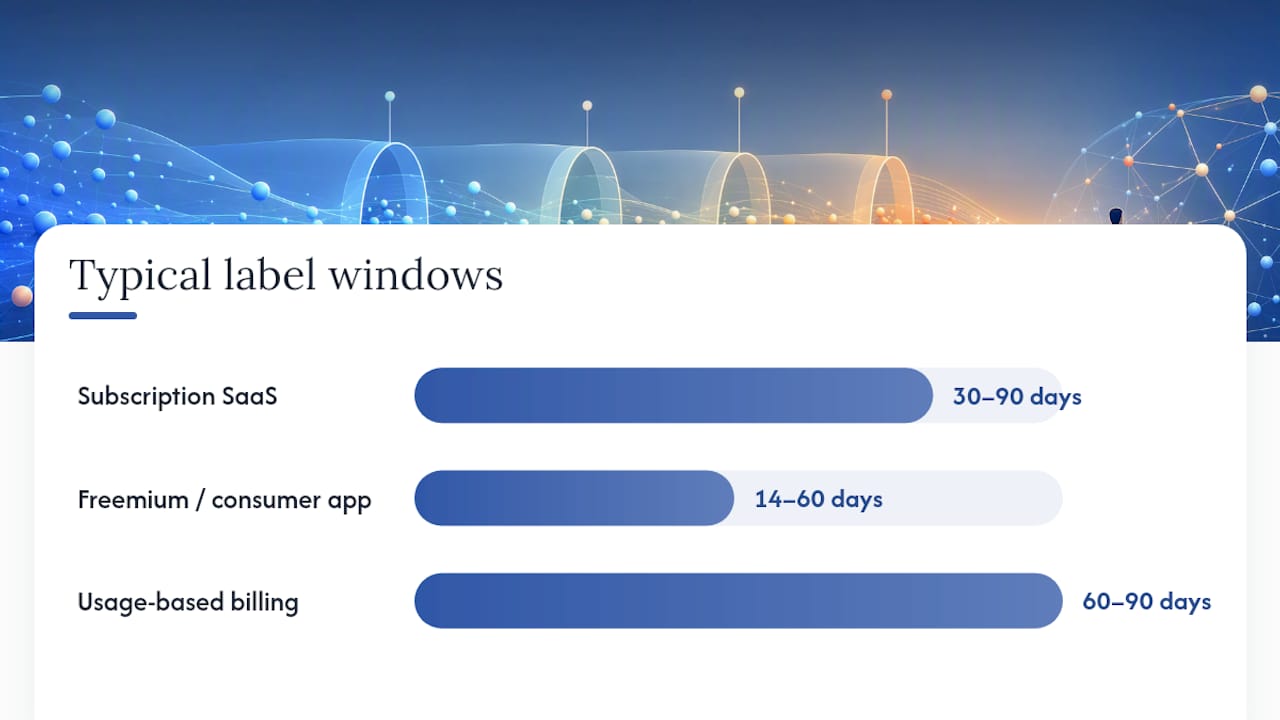
| Business model | Common churn definition | Typical label window |
|---|---|---|
| Subscription SaaS | Non-renewal or cancellation | 30 to 90 days post-renewal date |
| Freemium / consumer app | Inactivity (no core event) | 14 to 60 days since last session |
| Usage-based billing | Consumption drop below threshold | 60 to 90 days rolling |
| B2B multi-seat account | Seat count decline or non-renewal | Contract-cycle aligned |
When your product has a long, uncertain time-to-cancel rather than a clean binary event, a windowed label throws away information. That’s when time-split validation and survival analysis, which model time-to-event directly, outperform a fixed-window classifier.
The most common labeling error isn’t a wrong definition. It’s timestamp misalignment: pulling a “feature” from the same day or after the churn event itself, which silently trains a model to predict the past.
Which Models Should You Try, and When?
Start simple, add complexity only when the data justifies it. Here’s the practical roadmap analysts use, from fastest-to-ship to most powerful-but-expensive.
Logistic regression remains the right first model for most teams. It’s fast to train, coefficients map directly to business language (“a support ticket in the last 30 days multiplies churn odds by 1.4”), and it forces you to confront your feature set honestly before hiding weaknesses inside a black box.
Decision trees and Random Forest step up predictive power while keeping a legible structure. Trees hand you natural segment rules (“tenure under 6 months AND no login in 14 days”) that customer success teams can act on without a data science translator.
Gradient-boosted trees — XGBoost and LightGBM — are the workhorse for flat tabular churn data in production. A recent Frontiers study reported XGBoost reaching AUC-ROC of 0.932 with recall as high as 86.6% on telecom churn data, and a soft-voting ensemble hitting 0.918, using SHAP outputs to identify contract type, tenure, and technical support as the top individual drivers.
Survival analysis and Cox proportional hazards models matter when the business question is really “when will this account churn,” not just “will it.” They handle censored data (customers still active at the time of analysis) properly, which binary classifiers cannot.
Neural networks (MLPs) and graph neural networks earn their cost when you have relational or sequential depth: long event histories, team structures, or multi-touch usage patterns a flat model can’t represent.
Uplift and causal models answer the question none of the above can: not “who will churn,” but “who will churn and respond to an intervention.” This decision-intelligence layer, integrating predictive scores with uplift and budget-aware targeting, is what separates a model that scores accounts from one that actually saves revenue.
| Model family | Interpretability | Data volume needed | Latency/cost | Best use case |
|---|---|---|---|---|
| Logistic regression | High | Low to moderate | Very low | Fast baseline, coefficient-level explanation |
| Decision trees / Random Forest | High to moderate | Moderate | Low | Segment rules for CS teams |
| Gradient-boosted trees | Moderate | Moderate to high | Low to moderate | Production scoring at scale |
| Survival / Cox models | Moderate | Moderate | Low | Time-to-event, censored data |
| Neural nets / GNNs | Low | High | High | Relational, sequential signal |
| Uplift / causal models | Moderate | High | Moderate | Treatment targeting, budget allocation |
How Do You Evaluate a Churn Model Correctly?
Most inflated churn accuracy numbers come from one mistake: validating with random cross-validation on data where the label depends on the future. Time-split validation and backtesting train on past periods and test on later ones, which mirrors how the model will actually be deployed.
- Split chronologically, never randomly, so no future information leaks into training folds.
- Report AUC-ROC and PR-AUC together. PR-AUC matters more when churners are a small minority of the base.
- Check precision and recall at the specific threshold you’ll actually deploy, not just at 0.5.
- Calculate lift@k for the decile your retention team can realistically contact.
- Run a calibration check. A model that says “70% risk” should churn close to 70% of the time in that bucket.
Class imbalance needs explicit handling: class weights, resampling, or threshold tuning rather than accepting default decision boundaries built for balanced classes.
Pro Tip: Set your classification threshold using the retention budget, not statistical convention. If you can only fund 500 interventions this quarter, your threshold is whatever score cutoff produces roughly 500 flagged accounts, not the point where precision equals recall.
How Do You Turn Predictions Into Retention Actions?
A churn score sitting in a table changes nothing. The workflow that matters runs: score, explain, cohort, trigger.
- Score every active account on a defined cadence.
- Explain the top three to five drivers per account using SHAP or coefficient breakdowns, so a customer success manager knows why, not just that.
- Cohort by treatability and ROI — a high-risk account with low contract value may not justify a CSM call; a mid-risk enterprise account might.
- Trigger the matching playbook: in-app nudges for low-touch segments, CSM outreach for high-value accounts, targeted offers for price-sensitive churners.
Run the ROI math explicitly.
Prioritize by lift, not raw risk score. The highest-risk account isn’t always the one most likely to respond to an intervention; that’s exactly the gap uplift modeling is built to close. Confirm the program actually works with a treatment A/B or uplift test before scaling budget across the full customer base.
What Mistakes Wreck Churn Models, and How Do You Avoid Them?
Most failed churn programs don’t fail on algorithm choice. They fail on hygiene.
- Inconsistent churn definitions across teams (marketing counts differently than finance) make every downstream metric incomparable.
- Leakage from future features — a “days since last login” field computed after the churn date — inflates test accuracy and collapses in production.
- Ignoring calibration means a “high risk” label stops corresponding to actual outcomes over time.
- Never closing the loop on interventions means you can’t tell if the program works or just feels busy.
Mitigations are mostly engineering discipline: strict timestamp alignment between feature computation and label definition, feature freshness checks that flag stale pipelines, monitoring for label drift as your product or pricing changes, and pairing every SHAP explanation with an actual playbook step.
| Point | Details |
|---|---|
| Definition drift | Lock one churn definition in a shared doc before any model work starts. |
| Leakage | Audit every feature’s timestamp against the label’s decision date. |
| Stale calibration | Recheck predicted-versus-actual churn rates by score bucket quarterly. |
| Unclosed loop | Log every intervention and its outcome against the original score. |
What Belongs on Your Deployment and Monitoring Checklist?
Moving from notebook to production raises new questions analysts often skip until something breaks.
- Choose a scoring cadence: batch (daily or weekly) fits most retention programs; real-time scoring matters only when triggers need to fire inside the customer’s active session.
- Integrate scores into the systems your teams actually use: CRM, CDP, or marketing automation, not a spreadsheet nobody opens.
- Monitor for drift, calibration decay, and population shifts (a pricing change or new market segment can silently break a model trained on old behavior).
- Set retraining triggers based on drift thresholds, not a fixed calendar date.
Production systems increasingly lean on MLOps tooling for drift detection and scheduled retraining, since a model that scored well at launch degrades as customer behavior shifts.
- Restrict data access by role, and log every query against customer-level records.
- Document feature definitions, label windows, and model versions for anyone auditing the pipeline later.
- Run privacy checks before any external data source touches the model.
How Do You Make Churn Analysis Defensible and Reproducible?
A churn model that can’t be reproduced by a second analyst isn’t a finding, it’s an anecdote. Before running anything, write an analysis plan: churn definition, label window, train/test split logic, evaluation metrics, and success criteria, reviewed and approved before code executes.

Defensible artifacts include versioned datasets, annotated notebooks, model registry entries, SHAP or coefficient-based feature-importance outputs, and full evaluation notebooks a reviewer can rerun end to end. Without this trail, a stakeholder questioning why an account was flagged high-risk has no way to check your work, and neither do you six months later.
Pro Tip: Include an explicit calibration and uplift-validation block in every reproducibility package, not just the raw AUC. A reviewer trusts a model far more when they see it was checked against real intervention outcomes, not just held-out accuracy.
What Should Analysts Prioritize in the First 90 Days?
Skip the model bake-off. Stabilize your label and data pipelines first; a great model trained on inconsistent labels is worse than a mediocre model trained on clean ones.
Priority order: 1) label hygiene, 2) behavioral and billing features, 3) explainability from the first deployed model, 4) a small targeted pilot before any full rollout, 5) monitoring built in from day one, not bolted on later.
It’s the cheapest insurance against scaling a program that scores well but doesn’t move retention.
How Plotstudio Supports Defensible Churn Analytics
Building a churn model is one problem. Proving it to a VP, an auditor, or a peer reviewer six months later is another. Plotstudio runs the full workflow, from feature exploration through gradient-boosted modeling, survival analysis, and SHAP explainability, locally on your own machine, so account-level customer data never has to leave your environment.

Every analysis starts with a plan you review and approve before any code executes, giving you the pre-registration and audit trail this article argues for, not as an afterthought but as a default. Plotstudio runs R and Python natively and covers the methods churn work actually needs: Cox proportional hazards for time-to-event framing, mixed-effects models for account hierarchies, and exportable reproducibility packages including annotated notebooks and PDF reports a reviewer can trace line by line. Teams running uplift experiments or managing enterprise-scale deployments can explore the enterprise analytics platform to see how audit-ready churn workflows scale across a full analytics team.
Sources
- Explainable AI-driven customer churn prediction: a multi-model ensemble approach with SHAP-based feature analysis
- Decision intelligence and churn analytics (MDPI article)
- Churn Prediction and Prevention: Using Data Analytics to …
Recommended
- AI Analytics Platform Guide: Capabilities and Tradeoffs | PlotStudio AI
- Advanced Statistical Methods a Practical Guide for 2026 | PlotStudio AI
- Statistical Analysis Methodology: A Practical Guide for 2026 | PlotStudio AI
- The Future of Data Analytics in 2026 and Beyond: A Realistic View | PlotStudio AI