The best competitive analysis frameworks depend on the decision: structural models explain industry pressure, internal models assess capabilities, quantitative models expose performance gaps, and dynamic models examine interaction or uncertainty. PlotStudio AI applies agentic analytics to support that work by profiling evidence, executing multi-step Python analysis, and preserving reproducible outputs while researchers retain responsibility for questions, assumptions, and interpretation.
No single framework explains industry structure, internal capability, customer perception, relative performance, macro change, and strategic interaction equally well. Porter's Five Forces remains the foundational reference point because it was first published in 1979 in Harvard Business Review as “How Competitive Forces Shape Strategy,” but contemporary practice has expanded into a toolkit of 6 to 15 commonly cited framework families (Vanta Insights explains the historical role of Five Forces and Cascade describes the broader framework landscape).
The useful question isn't “Which framework is best?” It's “What must this analysis help me decide?” Each framework below identifies the question it answers, the data it needs, a repeatable application template, measurable outputs, a realistic example, and a limitation. The final workflow shows how PlotStudio AI can help turn fragmented evidence into auditable research data analysis rather than a one-shot answer.
1. Porter's Five Forces Analysis
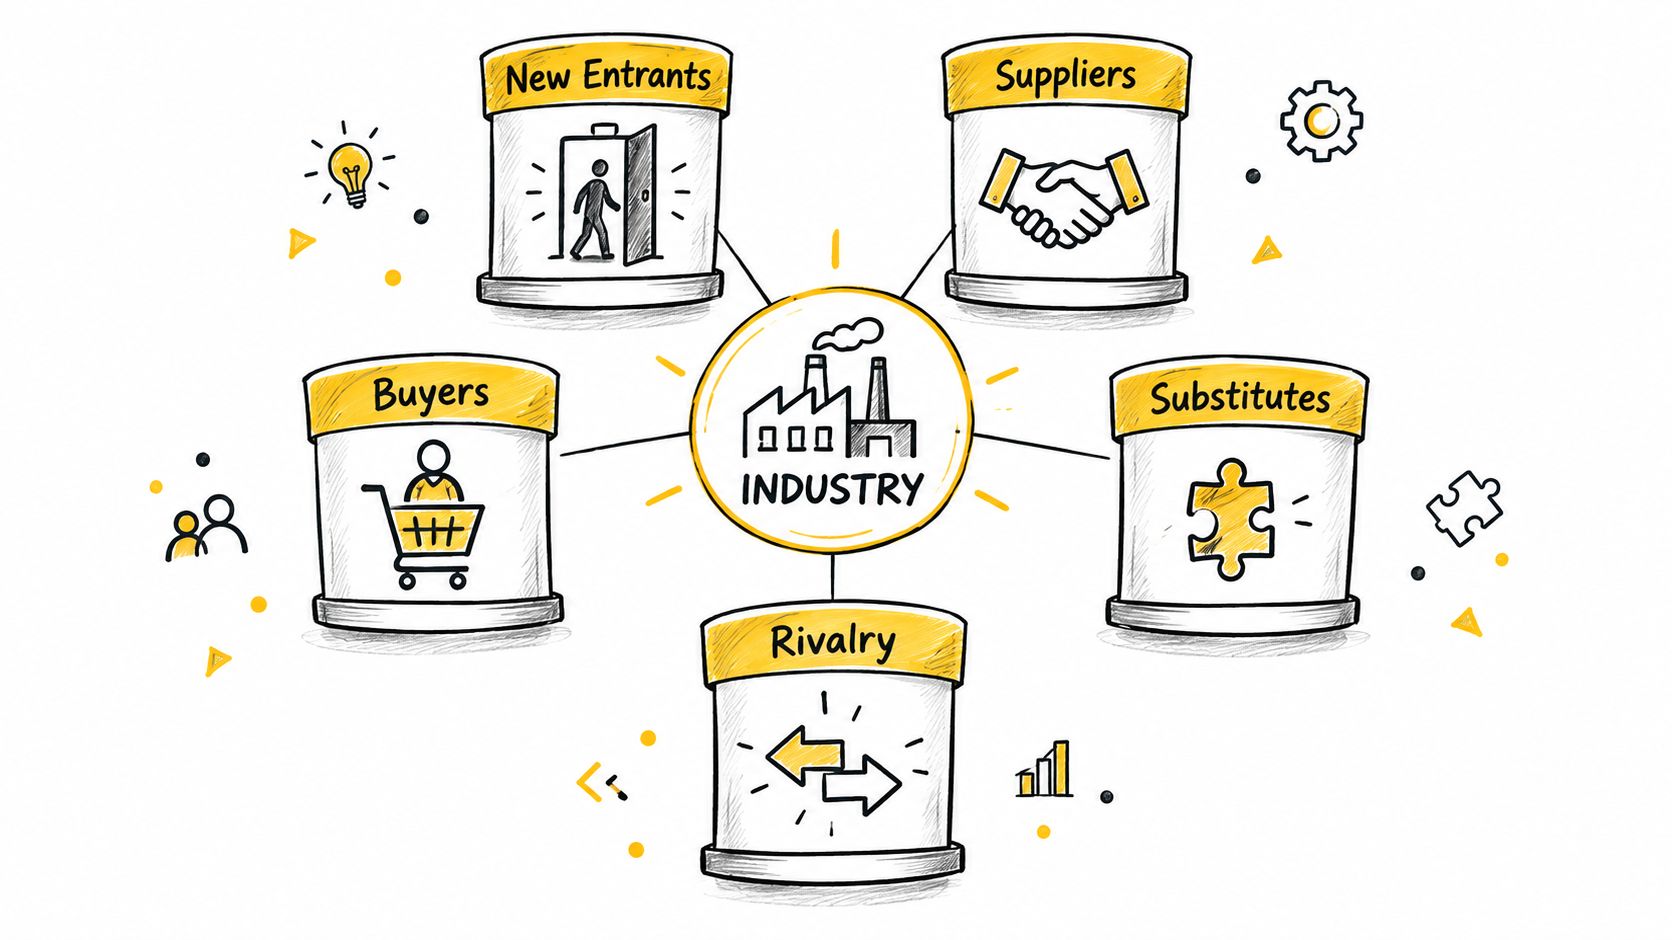
Porter's Five Forces is the strongest starting point when the question concerns industry attractiveness, structural pressure, or long-run profitability. The model evaluates rivalry among existing competitors, bargaining power of suppliers, bargaining power of buyers, the threat of new entrants, and the threat of substitute products or services. Porter's original framing separates these into three sources of horizontal competition and two sources of vertical competition (the framework's structure is summarized here).
Its data requirements are broader than a competitor list. Collect evidence on supplier concentration, switching costs, customer concentration, entry barriers, substitute performance, pricing behavior, capacity, regulation, and the intensity of rivalry. For a software market, that might include developer dependence, open-source alternatives, platform access, migration difficulty, and buyer purchasing power.
A repeatable application template
- Define the industry boundary. Separate the market, segment, geography, and customer job being analyzed.
- Score each force with evidence. Use qualitative ratings only after recording the supporting observations.
- Separate current pressure from expected change. Digital platforms, regulation, and new substitutes can alter the structure.
- Translate pressure into economics. Ask which force constrains pricing, raises costs, or increases customer acquisition difficulty.
- Record assumptions. Future updates should be able to challenge the original reasoning.
The output should be a force-by-force evidence register, an industry-attractiveness judgment, and a list of strategic responses. The model is tied to long-run returns on invested capital, not merely competitive description (the source PDF connects the forces with industry profit potential).
Practical rule: Analyze important segments separately. A supplier may have considerable leverage in one segment and little leverage in another.
The limitation is scope. Five Forces is an industry-level tool, so it won't reveal whether a specific company has the organizational capabilities to exploit favorable structure. It should usually be paired with SWOT, VRIO, or Value Chain Analysis.
2. SWOT Analysis
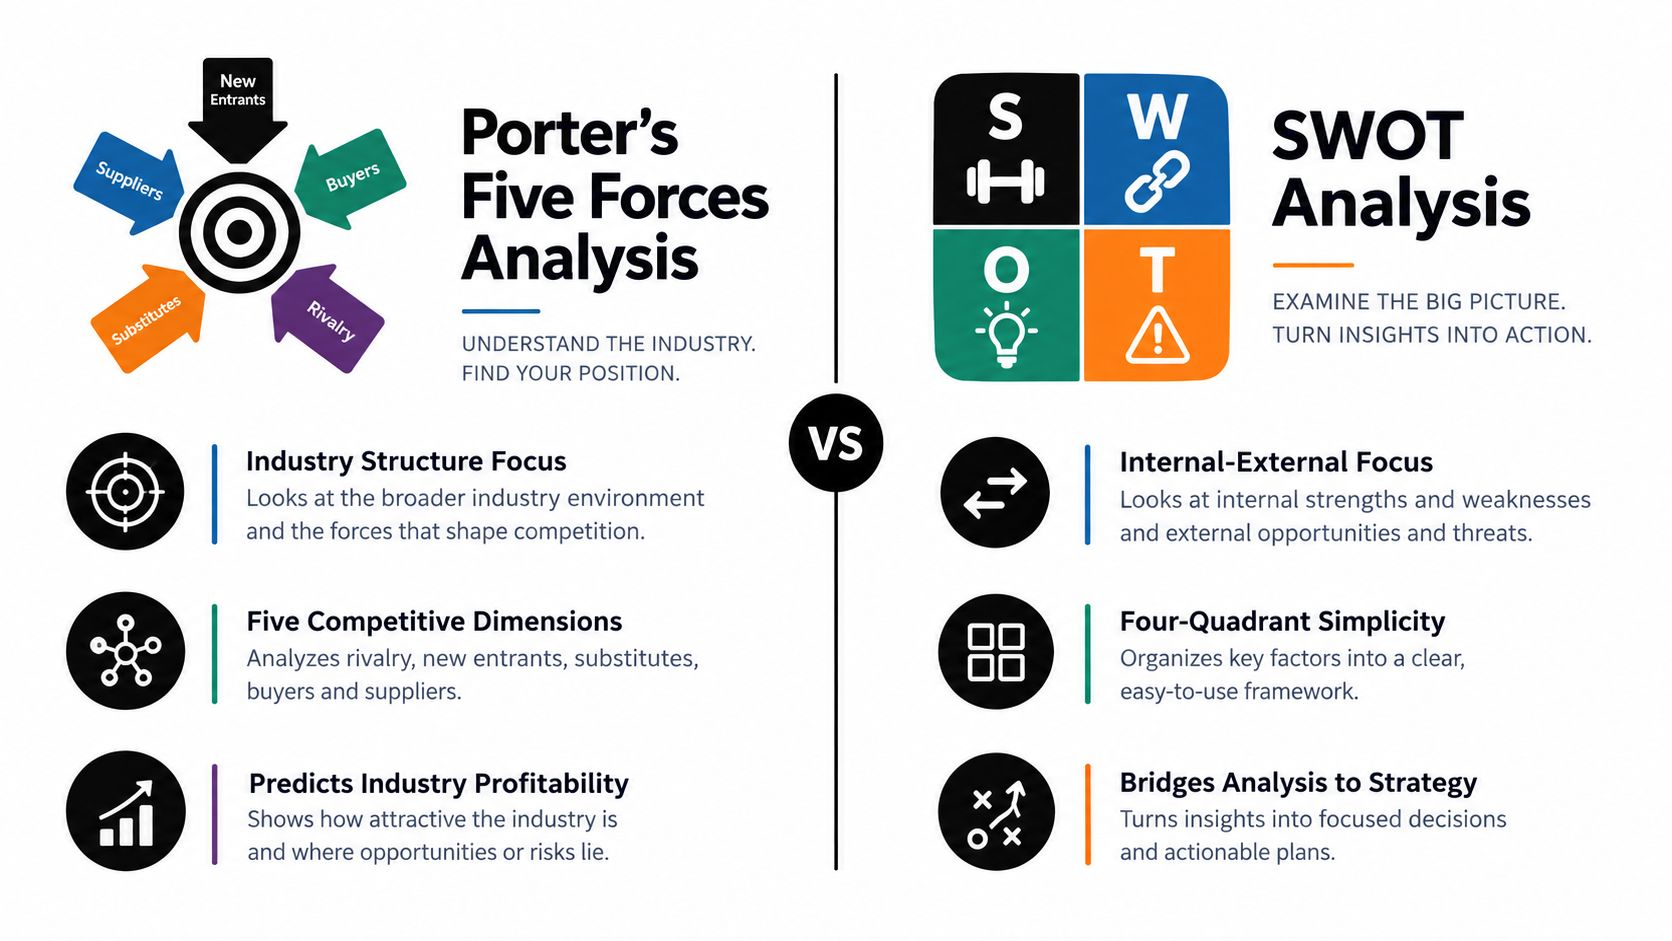
SWOT answers a different question: Given the competitive environment, what internal strengths and weaknesses shape our available choices? It organizes evidence into Strengths, Weaknesses, Opportunities, and Threats. Unlike Five Forces, which studies the industry's economy as a whole, SWOT is broader and company-focused (Business News Daily distinguishes the two levels of analysis).
A useful SWOT isn't a collection of flattering adjectives. It requires evidence from operating metrics, customer research, financial analysis, product performance, hiring capability, regulatory exposure, and competitor behavior. “Strong brand” should point to observable evidence such as customer preference, retention, or willingness to consider the product. “Weak distribution” should connect to channel reach, conversion, or partner dependence.
From four boxes to strategic choices
Build the matrix only after separating internal from external factors. Then rank each factor by impact and plausibility, not by how easy it is to write down. The resulting output should identify strategic questions such as:
- Strength to opportunity: Which capability can address an underserved customer job?
- Weakness to threat: Which internal constraint makes an external shift dangerous?
- Strength to threat: Which asset can reduce exposure to a substitute or entrant?
- Weakness to opportunity: What must change before the opportunity is economically reachable?
A healthcare startup might combine strong digital infrastructure with weak regulatory operating experience, then compare those internal conditions with telehealth demand and physician adoption barriers. The value lies in linking the items, not in filling every quadrant.
SWOT's trade-off is simplicity. It supports synthesis and communication, but it doesn't estimate causal effects, test competitive reactions, or establish whether one factor matters more than another. Treat it as a question-generation and prioritization tool, not a final strategic answer. Researchers can make the process more defensible by attaching each item to a source, date, confidence level, and missing-evidence note.
3. Competitive Positioning Map
A Competitive Positioning Map, also called a perceptual map, answers: How do customers or objective metrics place competitors relative to one another? It represents competitors on two selected dimensions, such as price and perceived quality, feature breadth and ease of use, or specialization and geographic coverage.
The map requires comparable observations. Customer survey responses can support perceptual coordinates, while price, feature counts, delivery time, or market presence can support objective coordinates. Mixing subjective and objective measures without labeling them creates a misleading visual. Researchers should also document the sample, coding choices, scaling method, and whether the axes measure perception or operational reality.
Build the map as a hypothesis test
Start with the customer decision, not with the axes that are easiest to obtain. Plot competitors, inspect crowded clusters, and identify empty spaces. Then ask whether those spaces represent unmet demand or just unattractive combinations that customers don't want.
A consulting market, for example, might map specialization depth against geographic coverage. A visible gap could suggest a regional specialist position, but the map alone can't establish demand, delivery feasibility, or profitability. The next analysis should test the hypothesis with customer research and operational data.
Use multiple maps rather than treating one diagram as the market's true geometry. These data visualization best practices are relevant because axis choice, scaling, labels, and visual encoding can change the interpretation.
The measurable outputs include competitor coordinates, cluster membership, distance between firms, movement across observation periods, and the proportion of respondents associating each brand with an attribute. Its main limitation is dimensional reduction. Two axes can clarify a strategic conversation, but they also hide attributes that may drive switching, compliance, trust, or adoption.
A map becomes more useful when paired with a customer job-to-be-done analysis. The important competitor isn't always the firm that looks most similar. It's the alternative that intercepts demand and gives buyers a reason to switch.
The following video offers a visual explanation of the framework:
4. Value Chain Analysis
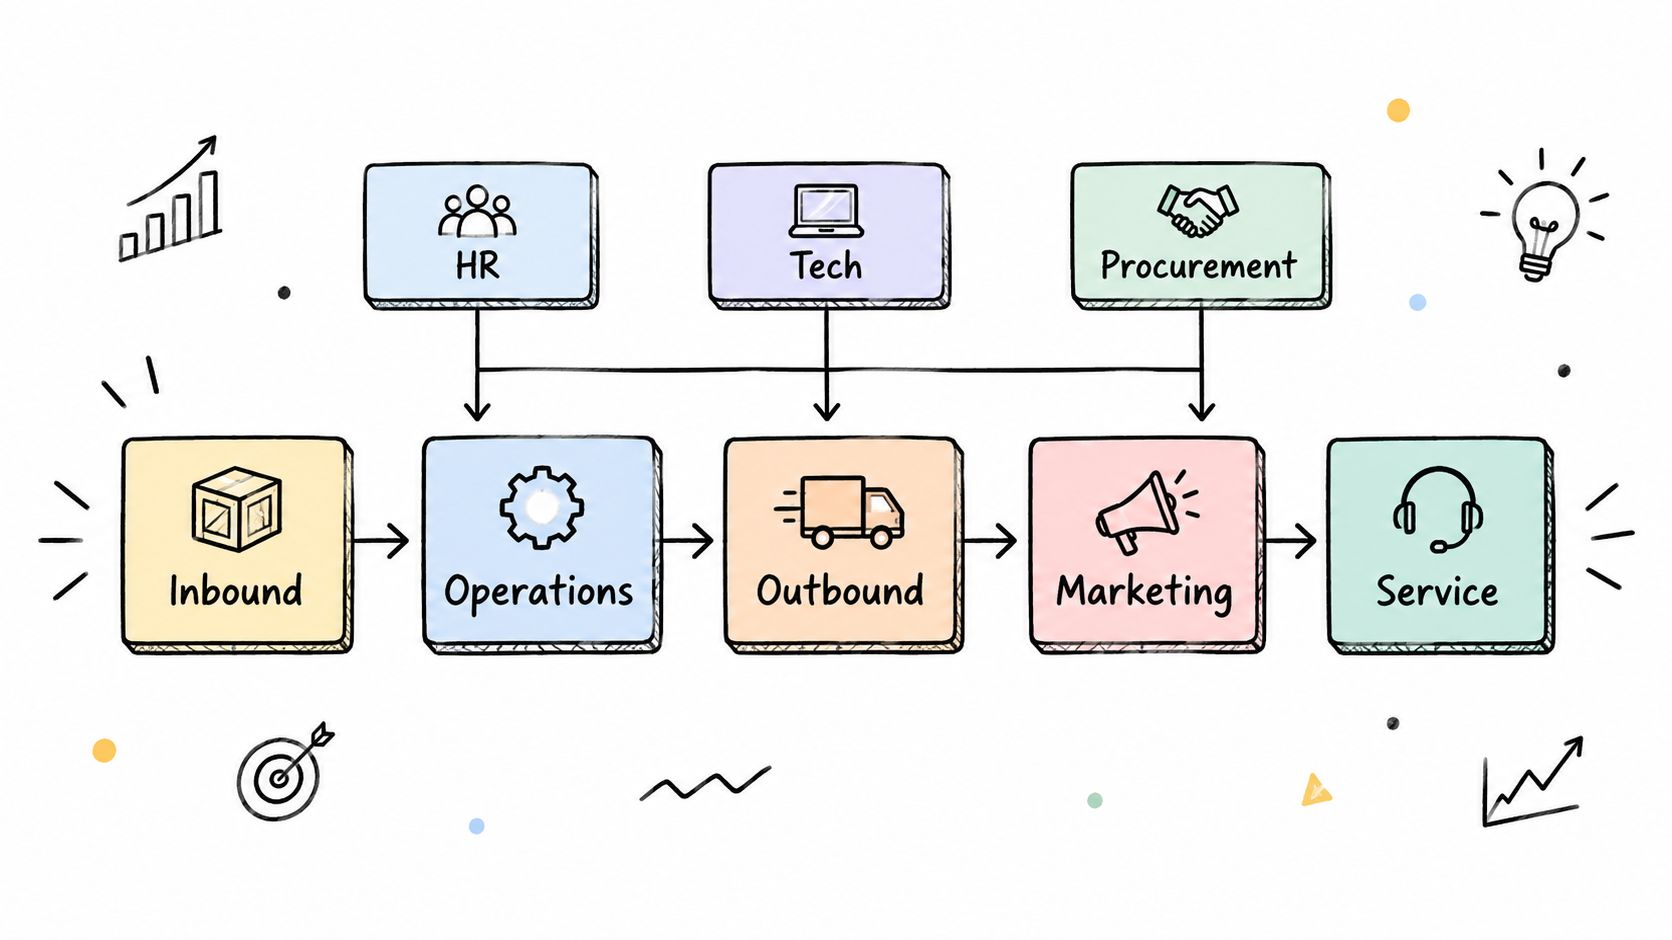
Value Chain Analysis asks: Which activities create customer value, absorb cost, or create dependence that competitors can't easily reproduce? It decomposes the organization into primary activities, such as sourcing, production, logistics, marketing, sales, and service, alongside support activities such as technology, procurement, human resources, and infrastructure.
The required data is operational. Gather activity-level costs, cycle times, defect rates, service measures, asset utilization, quality outcomes, supplier dependence, and customer-value indicators. Then map the same activities for major competitors where evidence is available. Public information may reveal partnerships, facilities, delivery promises, or product architecture, but internal cost estimates should be labeled as estimates rather than facts.
Look for linkages, not isolated advantages
A company may not win because one activity is superior. It may win because procurement, product design, logistics, and customer service reinforce one another. A pharmaceutical firm might find that research and regulatory capability create differentiation while manufacturing remains close to parity. A technology company may own distinctive software development and support practices while relying on commoditized hardware sourcing.
The application sequence is straightforward:
- Map activities: Record the full path from input to customer outcome.
- Assign economics: Attach cost, time, quality, and value indicators.
- Compare competitors: Distinguish genuine differences from unavailable evidence.
- Test linkages: Identify where coordination produces advantage.
- Choose interventions: Improve, protect, partner, automate, or outsource specific activities.
Outputs include activity-level cost pools, bottleneck maps, differentiation opportunities, dependency registers, and a make-or-buy hypothesis. The framework's limitation is data access. Competitor value chains are often partly inferred, so analysts should maintain confidence ratings and sensitivity analyses around uncertain activities.
Digital transformation can also change which activities matter. An activity that once supported the product may become a central source of adoption, trust, or switching cost. That makes periodic reassessment more useful than a permanently fixed diagram.
5. Blue Ocean Strategy
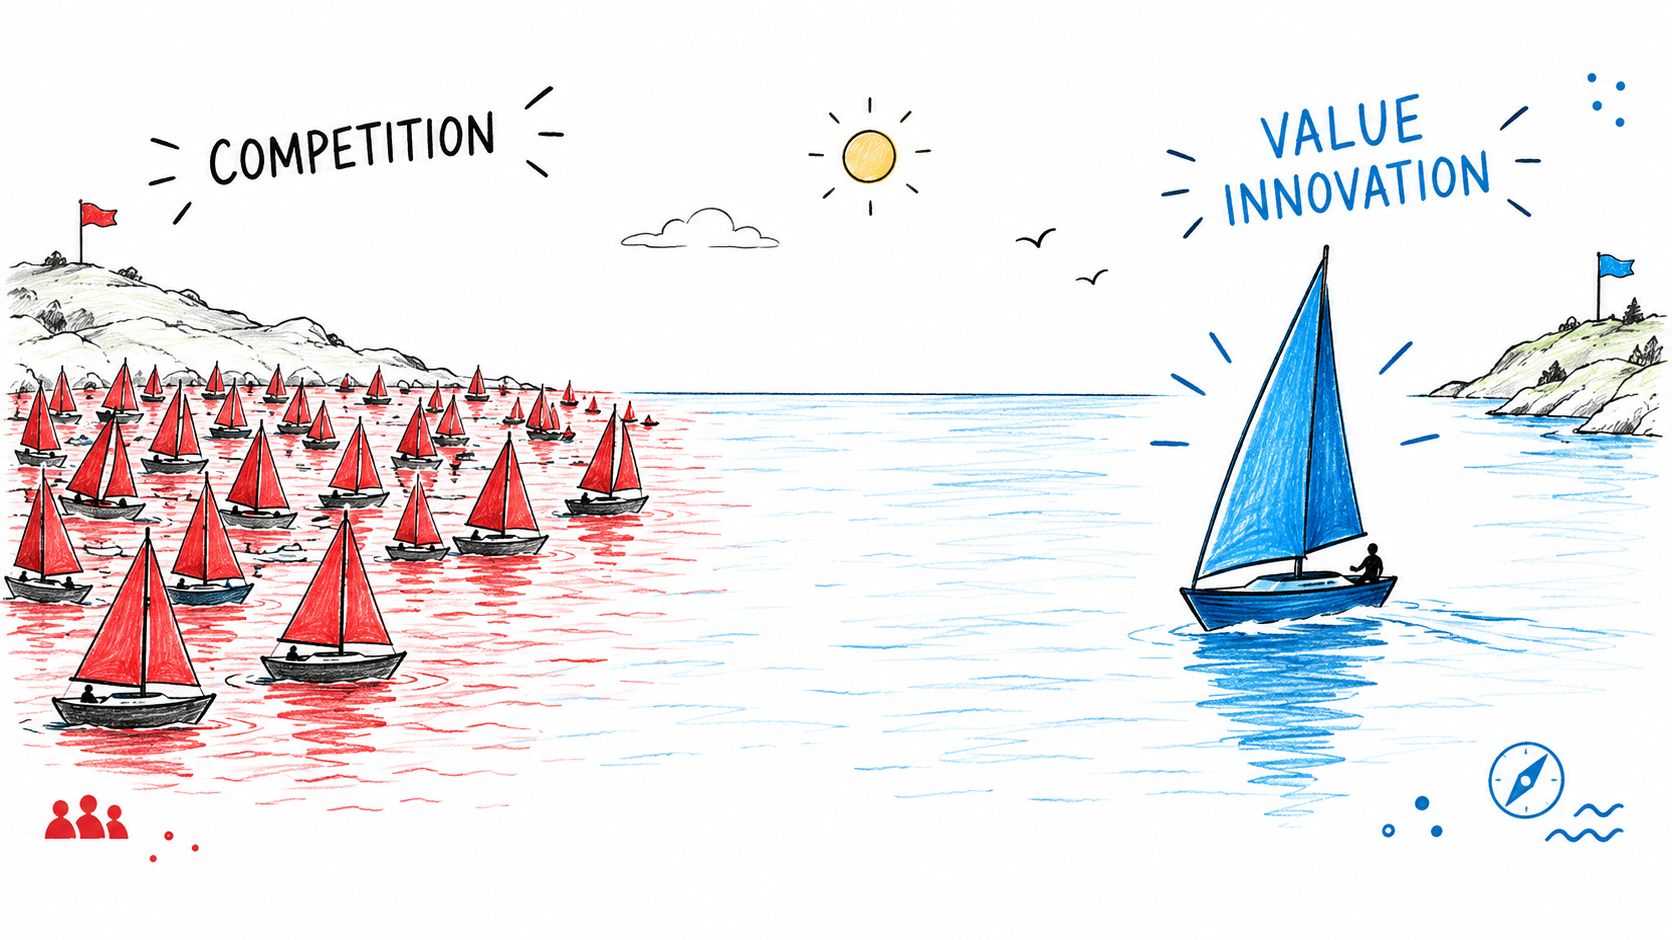
Blue Ocean Strategy is useful when the question is: Can we change the value equation instead of competing on the category's established factors? Its value innovation framework asks teams to eliminate factors the industry takes for granted, reduce factors below prevailing standards, raise selected factors, and create new sources of value.
This lens needs customer-job evidence, willingness-to-pay signals, usage barriers, adjacent-category comparisons, and capability constraints. The familiar examples of Netflix, Southwest Airlines, and Cirque du Soleil illustrate the logic, but an analyst shouldn't treat them as proof that every unconventional move will create uncontested demand.
Apply the four actions as a testable design
Begin by listing the factors competitors emphasize. Classify each factor as necessary, overprovided, underprovided, or absent. Then construct alternative value curves and test them with customers, early adopters, or niche segments. Measure changes in perceived value, adoption intent, cost-to-serve, and operational feasibility.
For a research-data software category, a possible value innovation hypothesis might reduce dashboard complexity, raise methodology visibility, and create a workflow around reproducible analysis. That hypothesis still requires testing. Novelty alone doesn't create a market, and differentiation on an irrelevant attribute can waste resources.
Trend analysis methods can help examine whether a proposed shift reflects a durable change or a temporary signal. Blue Ocean's central trade-off is that an apparently open space may attract imitation once demand becomes visible. The framework therefore needs a defensive analysis, including capabilities, switching costs, channels, and likely competitor responses.
Its outputs include a current and proposed value curve, an eliminate-reduce-raise-create matrix, customer-test results, and a capability-fit assessment. It complements Five Forces by changing the question from “How intense is rivalry?” to “Can we redefine what buyers compare?”
6. Benchmarking Analysis
Benchmarking answers: Where is our measurable performance different from a comparable reference point, and what might explain the gap? It can compare direct competitors, similar functions in another industry, internal processes, or strategic approaches.
The method depends on metric definitions. Costs, quality, delivery reliability, customer satisfaction, defect rates, acquisition economics, retention, and innovation output can all be useful, but only if the populations and denominators are comparable. A healthcare organization comparing patient outcomes must account for case mix. A manufacturer comparing defects must align product complexity and inspection rules. A software team comparing acquisition cost must clarify attribution and time window.
Turn a gap into an investigation
Create a benchmark register with the metric definition, source, observation period, comparable entities, normalization method, and uncertainty. Then decompose the gap. A lower cost may result from scale, product design, process efficiency, labor structure, or deferred investment. The benchmark identifies the difference, but it doesn't establish the cause.
Useful outputs include normalized performance distributions, gap rankings, driver hypotheses, and a plan for closing selected gaps. Don't optimize every metric. Choose measures connected to customer value or competitive advantage, then test whether improvement in the metric changes the decision outcome.
Benchmarking's limitation is false precision. A clean percentile or score can conceal inconsistent definitions and different strategic choices. It should be paired with qualitative investigation and thoroughness checks.
Competitive intelligence software adoption suggests that organizations increasingly treat this work as an operating capability. One market summary projects that the global competitive intelligence software market will surpass $12.8 billion by 2028, implying a 14.3% CAGR from 2021 (the market projection is reported by PMR). That projection signals category growth, not proof that a particular benchmarking program will produce better decisions.
7. Competitor Intelligence and PEST Analysis
Competitor Intelligence and PEST Analysis work together when the question is: What external signals could change competitive behavior before the change appears in performance data? Competitor intelligence tracks products, pricing, partnerships, hiring, messaging, customer feedback, and strategic moves. PEST organizes macro signals into Political, Economic, Social, and Technological factors.
The data is heterogeneous, so source governance matters. Regulatory filings, official announcements, product documentation, job postings, customer reviews, industry publications, and market research can each answer different questions. Analysts should record source date, direct observation versus interpretation, confidence, and whether independent evidence confirms the signal.
Build a signal-to-decision pipeline
Start by assigning ownership for competitor and environmental dimensions. Classify incoming evidence by strategic relevance, then connect meaningful signals to an explicit decision. A regulatory change matters only when the analyst explains which products, costs, channels, or customer requirements it could affect.
A financial-services team might monitor fintech product launches, regulatory developments, technology investment, and consumer trust signals. An automotive team could combine battery technology, government incentives, oil prices, and adoption behavior. These are not forecasts by themselves. They're inputs to a structured review.
Market analysis methods provide a complementary way to organize broader demand, industry, and customer evidence. Outputs should include a dated signal log, competitor profiles, a PEST heat map, escalation rules, and a recurring briefing that distinguishes “monitor” from “act.”
The limitation is noise. A competitor's announcement may describe intent rather than capability, while a hiring signal may reflect replacement rather than expansion. AI can help extract and classify evidence, but researchers still need source validation and domain judgment.
Independent review data indicates that competitive intelligence tools are mature enough to generate workflow-level adoption signals. G2 reports an average category rating of 4.59 out of 5, with a 9.8 out of 10 sub-score for “doing business” and an 8.5 out of 10 product detail score (the review-category evidence is summarized by Panoramata). These ratings describe perceived software value, not the validity of the intelligence produced.
8. Scenario Planning and Competitive Forecasting
Scenario Planning is appropriate when the decision must remain useful under multiple plausible futures. Competitive forecasting estimates likely near-term developments from historical patterns and observed behavior, while scenario planning deliberately avoids reducing uncertainty to one point estimate.
The method requires critical uncertainties, not an exhaustive list of possibilities. Select a small set of variables that could materially alter competitive outcomes, such as regulatory direction, technology adoption, competitor consolidation, or platform access. Construct internally consistent scenarios, then specify how customers, incumbents, suppliers, and entrants would behave in each one.
Make scenarios operational
Each scenario should contain:
- Assumptions: What conditions define the future?
- Competitive moves: Which strategies become more likely?
- Customer changes: Which jobs, constraints, or buying criteria shift?
- Early signals: What observable data would indicate movement toward the scenario?
- Response options: Which investments preserve flexibility across futures?
An energy company might compare futures shaped by carbon pricing, electric-vehicle adoption, and renewable scaling. A healthcare system could examine telehealth regulation, consolidation, and patient adoption. The output isn't a confident prediction. It's a decision map showing which actions are solid and which depend on a fragile assumption.
Scenario analysis workflows can support this structure by connecting assumptions with outcomes. Forecasting's limitation is path dependence. Historical behavior may not predict a competitor facing a new technology, regulation, or financial constraint. Analysts should run sensitivity analyses and revisit the scenario set when early signals contradict the original logic.
The strongest result is often an option or hedge. A team may delay an irreversible commitment, develop modular capabilities, or establish monitoring thresholds. Human judgment remains essential because scenario plausibility depends on institutional, technical, and domain knowledge that historical data can't fully encode.
9. Competitive Game Theory and Strategic Interaction Analysis
Game theory answers: What will competitors do when each player's payoff depends on the others' choices? This makes it different from static benchmarking. The analyst specifies players, strategies, payoffs, timing, information, and constraints, then examines possible equilibria and incentives.
An airline pricing problem may have a Prisoner's Dilemma structure. Each firm can undercut the other, even when both would prefer stable prices. A technology arms race may produce escalating feature investment with diminishing returns. Coordination problems resemble Battle of the Sexes, while brinkmanship resembles Chicken. These labels are useful only when the underlying payoffs and choices fit the game.
Build the model before naming the game
Define the strategic unit carefully. “Competitor” may mean a firm, platform, regulator, supplier, or buyer coalition. Then specify whether choices are simultaneous or sequential, whether players can observe moves, and whether cooperation is enforceable.
The data can include historical price responses, product-launch timing, capacity decisions, partnership behavior, contract terms, and observed retaliation. Model outputs include payoff matrices, best responses, equilibrium candidates, escalation paths, and sensitivity to payoff assumptions.
Game theory is especially useful for testing strategic narratives. If a model predicts repeated cooperation but the historical record shows continual defection, the analyst should revisit switching incentives, information asymmetry, enforcement, or the assumed payoffs. The model isn't a machine for predicting intent.
Its limitation is specification risk. Small changes in payoff assumptions can change the result, and many commercial settings include value creation alongside competition. Use the framework to identify incentives and traps, then validate the result against observed behavior and domain knowledge.
10. Competitive Profiling and VRIO Analysis
Competitive Profiling and VRIO Analysis answer: Which competitor capabilities are valuable, rare, difficult to imitate, and supported by the organization? Profiling creates a structured dossier covering strategy, resources, products, customers, public moves, constraints, and likely options. VRIO then tests whether an apparent strength is defensible or merely common.
The evidence base can include financial reports, product documentation, patents, customer reviews, partnerships, hiring patterns, organizational design, and market outcomes. Separate public claims from verified capability. A competitor may advertise an advanced platform, but actual adoption, reliability, integration depth, or customer evidence may tell a different story.
Use a consistent profile, then test defensibility
Apply the same profile template to each important competitor. Record the observation, source, date, confidence, and interpretation. For every capability, ask:
- Valuable: Does it improve customer value, reduce cost, or protect access?
- Rare: Do few relevant competitors possess it?
- Inimitable: Would replication face time, knowledge, legal, network, or organizational barriers?
- Organized: Can the competitor deploy the resource effectively?
A telecommunications firm might assess network infrastructure, brand, and customer service. A biotech firm could examine research pipelines, manufacturing expertise, and regulatory relationships. The important distinction is between possession and deployability. Legacy systems, culture, incentives, or organizational complexity can prevent a firm from converting resources into advantage.
Outputs include competitor dossiers, capability matrices, defensibility judgments, vulnerability hypotheses, and monitoring priorities. The limitation is inference. VRIO can organize reasoning, but public evidence rarely proves inimitability. Confidence labels and alternative explanations are therefore necessary.
Researchers who need a broader intelligence environment can compare this workflow with the capabilities expected from a business intelligence platform, while keeping the distinction clear. A BI dashboard reports and monitors defined metrics. Competitive profiling requires evidence synthesis, interpretation, and recurring investigation.
10 Competitive Analysis Frameworks Compared
| Framework | 🔄 Implementation complexity | ⚡ Resource requirements | 📊 Expected outcomes | 💡 Ideal use cases | ⭐ Key advantages |
|---|---|---|---|---|---|
| Porter's Five Forces Analysis | Moderate, structured framework with qualitative judgment | Moderate, industry data, interviews, time | Map of competitive pressures and industry profitability drivers | Industry attractiveness, market entry, strategic positioning | Comprehensive industry-level diagnostic; widely validated |
| SWOT Analysis | Low, simple four-quadrant exercise | Low, workshops, basic data sources | Snapshot of strengths, weaknesses, opportunities, threats | Early-stage planning, cross-functional alignment, communications | Easy to use and communicate; quick prioritization of issues |
| Competitive Positioning Map (Perceptual Map) | Low–Moderate, requires attribute selection and plotting | Moderate, attribute metrics or customer perceptual data | Visual depiction of competitor clustering, gaps, and differentiation | Product strategy, marketing positioning, segmentation | Intuitive visual insight into market gaps and direct competitors |
| Value Chain Analysis | High, detailed decomposition of activities and linkages | High, internal operational and cost data; cross-functional input | Granular view of value creation, cost drivers, and advantage sources | Cost reduction, sourcing/outsourcing decisions, operational improvement | Pinpoints specific activities for differentiation or cost leadership |
| Blue Ocean Strategy (Value Innovation) | Moderate, creative mapping and market hypothesis testing | Moderate, customer research, prototyping, alignment effort | New value propositions and potential uncontested market spaces | Business-model innovation, market creation, growth strategy | Encourages breakthrough value innovation; shifts focus from rivals to buyers |
| Benchmarking Analysis | Moderate, requires metric standardization and comparison | High, comparable KPIs, competitor/industry data, analytics | Quantified performance gaps and target benchmarks | Process improvement, KPI setting, operational excellence programs | Data-driven targets and clear improvement trajectories |
| Competitor Intelligence & PEST Analysis | Moderate–High, ongoing monitoring and synthesis | High, continuous data feeds, analysts, tools | Early warnings, trend signals, macro-environment insights | Risk management, regulatory/tech monitoring, strategic alerts | Real-time situational awareness and broad environmental context |
| Scenario Planning & Competitive Forecasting | High, scenario construction, stress-testing, validation | High, cross-functional expertise, modeling, workshops | Multiple plausible futures, contingency plans, robust strategic options | Long-term planning, uncertain/transforming industries, strategic foresight | Prepares organization for uncertainty; identifies robust strategies |
| Competitive Game Theory & Strategic Interaction | High, formal models, payoff estimation, equilibrium analysis | High, quantitative skills, historical/behavioral data | Predicted interactive behaviors and equilibrium outcomes | Pricing, entry deterrence, strategic escalation and cooperation analysis | Rigorous mapping of interdependent incentives and likely responses |
| Competitive Profiling & VRIO Analysis | High, detailed competitor dossiers and capability assessment | High, research resources, expert judgment, frequent updates | Deep profiles of competitor resources and sustainability of advantages | M&A screening, strategic response planning, capability benchmarking | Identifies which resources are truly valuable, rare, inimitable, and organized |
Build a Repeatable Competitive Analysis Workflow
The ten frameworks answer different questions, so combining them is more reliable than treating any one as a complete answer. Five Forces and PEST describe external structure. SWOT and VRIO synthesize capabilities and strategic exposure. Value Chain Analysis examines activity-level economics. Positioning maps and benchmarking make relative performance and perception visible. Blue Ocean Strategy explores value innovation. Game theory and scenario planning address interaction, uncertainty, and possible responses.
A practical combination usually contains two or three lenses. For example, a researcher evaluating an AI research-data market might use Five Forces to understand supplier and buyer pressure, a positioning map to compare perceived ease of use and methodological depth, and Value Chain Analysis to examine where local execution, support, and reproducibility create cost or differentiation. A public-health analyst studying competing intervention models might combine SWOT, benchmarking, and scenario planning rather than forcing every question into a feature matrix.
Use this sequence to make the work reproducible:
- Define the decision and unit of analysis. Specify whether you're comparing industries, firms, products, customer jobs, activities, or strategic interactions.
- Collect comparable data. Align definitions, observation periods, geographic scope, sampling rules, and source quality.
- Document assumptions and missingness. Record what is observed, inferred, unavailable, or uncertain.
- Choose metrics before interpreting results. Include performance, cost, customer perception, adoption, switching, quality, or risk measures that connect to the decision.
- Run exploratory and confirmatory checks. Explore distributions, clusters, missingness, and outliers before testing a specific hypothesis.
- Test stability. Vary coding rules, weights, assumptions, model specifications, and plausible scenarios.
- Translate outputs into actions. Assign an owner, decision threshold, next evidence request, and review date.
- Schedule updates. A framework without a cadence becomes a static artifact that slowly loses relevance.
Competitive analysis has also become a broader research process rather than a single industry-structure exercise. Practitioner guidance commonly describes a workflow that moves through assessing, benchmarking, and strategizing, while another guide breaks the work into defining the strategic question, scoping the competitive set, selecting frameworks, collecting and validating data, synthesizing insights, and establishing a decision cadence (this enterprise strategy guide describes the repeatable stages).
PlotStudio AI supports this workflow as agentic analytics for researchers. You can upload data and provide an objective, then let the system profile datasets, flag missing values, plan an investigation, write and execute real Python locally, inspect intermediate outputs, revise the approach, and generate charts, statistics, and methodology artifacts. Plan Mode lets you review and approve the proposed analysis before execution, while generated code, intermediate outputs, diagnostics, and saved Analysis Pages make the investigation auditable rather than reducing it to a single answer.
That distinction matters. An answer is an output, but an analysis is an investigation. PlotStudio AI can help researchers move from raw competitor evidence to exploratory analysis, statistical checks, visualizations, and reproducible exports to Jupyter notebooks or PDF reports. It won't decide whether a proxy measures competitive strength, whether a causal interpretation is justified, or whether an assumption is scientifically defensible. Those remain researcher responsibilities.
If you're evaluating an auditable workflow for sensitive research data, explore PlotStudio AI for research partners and see whether its local Python execution, Analysis Pages, and reproducible exports fit your analytical process.