Research Ready Excel Analysis With Local AI and Timestamped Plans

For academic work, “excel data analysis ai” should mean a local, privacy-preserving AI workflow that runs your data against a researcher-approved analysis plan, executes it in R or Python, and hands back a reproducible package: notebook, PDF, and audit trail. It should not mean a cloud assistant that writes formulas or summarizes a spreadsheet on someone else’s server. If your data touches an IRB protocol or GDPR special category, the recommended approach is an agentic, local-execution tool, gated behind a pre-approved plan, that produces exportable proof of how every result was reached. Platforms like Plotstudio are built around exactly that definition.
TL;DR:
- Local AI workflows that follow pre-approved analysis plans produce reproducible packages and are essential for handling sensitive data under IRB or GDPR regulations.
- Excel’s autocorrect errors can silently corrupt over 30% of datasets, especially gene names, making early data validation and conversion to plain-text formats crucial.
- Pre-analysis plans should specify hypotheses, outcomes, variable definitions, and statistical methods, with strict approval and timestamping before data analysis begins.
- Cloud AI tools often lack the necessary reproducibility and audit trail features, making dedicated local platforms preferable for academic research requiring rigorous validation.
- Platforms like Plotstudio support running R and Python scripts locally, offering gated, authenticated analysis execution with exportable reproducible reports ideal for peer review and compliance needs.
Table of Contents
- Why Excel-Based Research Data Breaks Before You Even Open It
- Building a Pre-Approved Analysis Plan Before Any Code Runs
- Local Execution and Audit Trails for IRB and GDPR-Sensitive Data
- The Reproducible Workflow, from Raw Spreadsheet to Permanent Report
- What AI-Driven Analysis Inside Excel-Origin Data Actually Looks Like
- Where Excel-Native AI Falls Short of a Dedicated Analysis Platform
- Connecting Excel Data to Azure ML, Power BI, and Other AI Platforms
- Reading AI-Generated Results Without Overtrusting Them
- When a Local AI Platform Is Worth the Onboarding Time
- Getting Reproducible Analysis Running with Plotstudio
- Sources
- FAQ
Why Excel-Based Research Data Breaks Before You Even Open It
Excel corrupts data quietly, and researchers rarely notice until a reviewer does. A landmark analysis of Excel autocorrect errors found that over 30% of a sampled set of academic supplementary datasets contained at least one gene name mangled by Excel’s autocorrect feature. “MARCH1” becomes a date. “SEPT2” becomes another date. Nobody flags it because the cell still looks like text until someone runs the numbers and the sample sizes stop adding up.
Statistic Callout: More than 3 in 10 academic supplementary spreadsheets in the sampled dataset had at least one autocorrect-corrupted identifier, a failure mode that persists in genetic research years after it was first documented.
Before any analysis starts, run this check on every workbook:
- One table per sheet. Two tables side by side confuses type inference and import scripts alike.
- No units, footnotes, or comments embedded inside data cells. Put them in a separate data dictionary.
- Consistent field names across sheets and files. “Age_yrs” in one tab and “Age (years)” in another will silently misjoin.
- No merged cells, no colored-cell-as-data-meaning, no formulas left where a raw value should sit.
Once a sheet passes that check, convert it to CSV or another tidy, plain-text format and stop editing the original. Data Package metadata approaches exist for a reason: Excel’s type-guessing heuristics were never designed for research data, and treating the workbook as a disposable intake format rather than a permanent home for your dataset is the single cheapest fix available.
Building a Pre-Approved Analysis Plan Before Any Code Runs
A pre-analysis plan, or PAP, is the document that separates a defensible result from a p-hacked one. It states, before you touch the data, exactly what you’re testing and how. Detailed PAPs are associated with fewer marginally significant, cherry-picked findings than superficial pre-registration, according to MIT’s review of pre-analysis plans in economics research. Vague pre-registration checks a box; a specific PAP actually constrains what you can do after seeing the data.
A PAP worth gating code behind should specify:
- The hypotheses, stated in falsifiable form.
- Primary and secondary outcomes, ranked, not lumped together.
- Exact variable definitions, including units and coding for categorical fields.
- Exclusion and inclusion rules, written before you see who they exclude.
- The sample-size or power calculation behind the design.
- The statistical models to be fit, including covariates.
- How standard errors will be handled (clustered, robust, bootstrapped).
- Rules for any subgroup or sensitivity analysis, labeled as confirmatory or exploratory.
“Gating” simply means the plan gets time-stamped and approved by a researcher before any code executes against the real data. That timestamp is your pre-registration. The approval record is your audit trail. Together they answer the question every reviewer eventually asks: did you decide this before or after you saw the result?
Pro Tip: If your dataset is observational or reuses legacy data, a rigid PAP can be a poor fit. Plan a specification-curve or multiverse analysis instead, and document that decision with the same rigor you’d apply to a confirmatory design.
Local Execution and Audit Trails for IRB and GDPR-Sensitive Data
Uploading patient records, genetic data, or any GDPR special-category field to a cloud AI tool creates a data-transfer event your IRB protocol almost certainly didn’t approve. “Local execution” means the analysis runs on hardware you control, for example by using a Portable Local AI Lab USB guide to run local analysis securely when institutional infrastructure is limited. The data never crosses into a third-party server, which sidesteps the entire question of where a cloud vendor stores your dataset or who else might access it.
An audit trail worth keeping for peer review or an institutional data audit should include:
- The exact version of the analysis plan that was approved, with a timestamp.
- The code that ran, not a paraphrase of it.
- The inputs and outputs, linked to that specific run.
- The identity of whoever approved the plan and whoever executed it.
Retain that package for as long as your funder or journal requires post-publication data access, typically several years.
Pro Tip: Run PII detection and anonymization as a scripted, repeatable step, not a manual scrub. A manual pass misses fields; a script you can rerun on the next dataset catches them consistently.
Institutional approval logs and access records round out the picture. If your lab handles NHS, hospital, or EU special-category data, local execution isn’t a nice-to-have workflow preference. It’s often the only version of “excel data analysis ai” your ethics board will sign off on.
The Reproducible Workflow, from Raw Spreadsheet to Permanent Report
A reproducible package isn’t a Jupyter file you export at the end and hope nobody questions. It’s a chain of custody from raw file to final number, and each link has to hold.
- Archive the raw file exactly as received, untouched, with a checksum.
- Validate and convert to CSV or a tidy format, logging every field that changed type during conversion.
- Script the cleaning step. If you did it by hand in Excel, redo it in code so it can be rerun.
- Snapshot the environment (an
renvlockfile for R, arequirements.txtor Dockerfile for Python) so the exact package versions are recoverable. - Run the gated PAP, only after it’s approved.
- Export the annotated notebook, a PDF report, and a permanent, searchable analysis page.
The Poldrack lab’s reproducible analysis guide treats containerization and scripted cleaning as baseline, not aspirational, practice, and a 2026 international consensus on reproducibility lists time-stamped plans and reproducible computational artefacts among the core expectations reviewers should be checking for.
What the final package needs to contain:
| Component | Purpose |
|---|---|
| Data dictionary | Defines every field, unit, and code exactly once |
| Exact code used | The real script, not a summary of what it did |
| Environment spec | Locks package versions so results don’t drift on rerun |
| Versioned raw and cleaned data | Lets anyone trace a number back to its source row |
| Run log with approvals | Shows who approved the plan and when it executed |
Teams without heavy infrastructure can still hit most of this. Software Carpentry’s good-enough practices guide makes the case that saving raw files, tidying data, and using basic version control gets a small lab most of the way there without a DevOps hire. Continuous integration and formal archiving matter more as your team and dataset count grow.
What AI-Driven Analysis Inside Excel-Origin Data Actually Looks Like
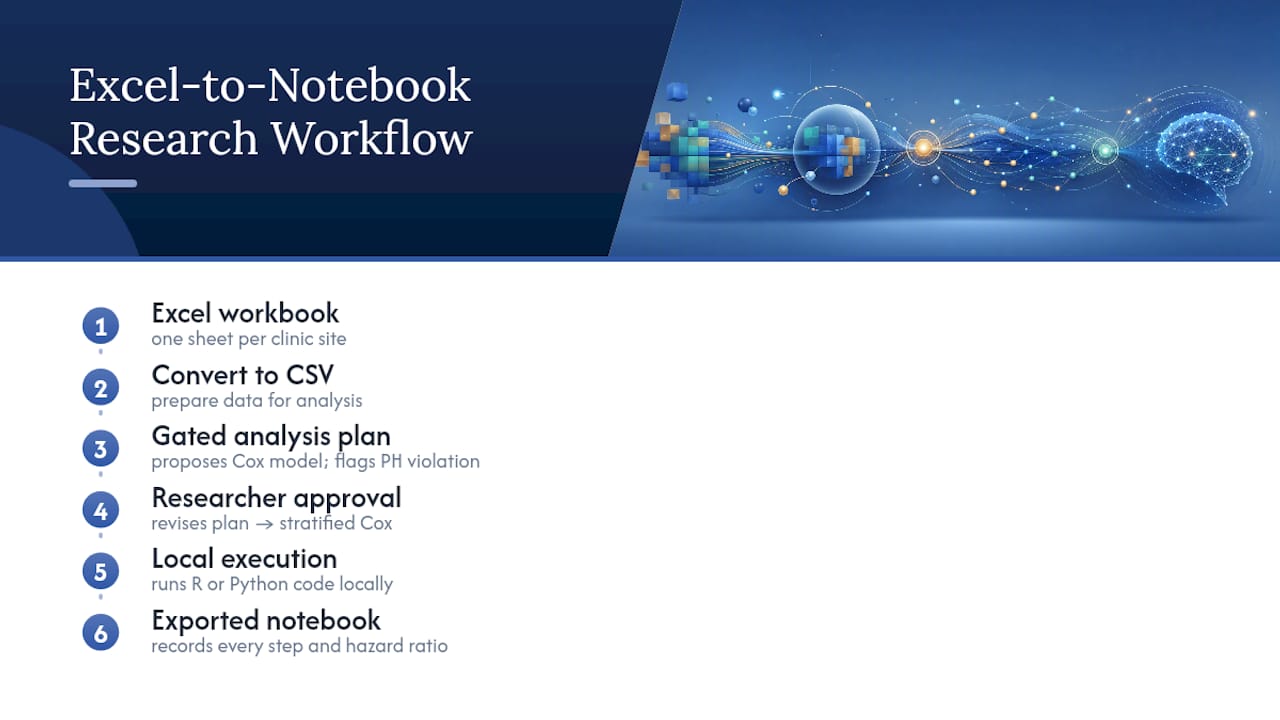
A lab studying treatment adherence pulls three years of visit logs out of a hospital EHR export, originally an Excel workbook with one sheet per clinic site. Converted to CSV and run through a gated survival analysis, the AI agent proposes a Cox proportional hazards model, flags a violated proportional-hazards assumption on one covariate, and suggests a stratified alternative before any code executes against the real dataset. The researcher approves the revised plan, the model runs, and the exported notebook shows every step from raw import to hazard ratio.
A thesis committee reviewing a mixed-effects model on longitudinal survey data gets a different kind of value: instead of a static appendix table, they get a searchable analysis page that reproduces the exact regression, including the exclusion criteria applied to incomplete responses. That artifact answers committee questions in the room instead of generating a follow-up email chain.
A multi-site consortium standardizing ANOVA and multiple-comparison correction across five labs uses encoded protocols, so an incoming postdoc runs the same statistical thresholds and forbidden shortcuts the lab has always used, without retraining them from scratch. That consistency is often what breaks down first when labs scale past one or two analysts working from memory and habit.
None of these examples depend on the AI “knowing” the science. They depend on the AI executing a plan a human already approved, in R or Python, against data that never left the institution’s own machine.
Where Excel-Native AI Falls Short of a Dedicated Analysis Platform
Excel-embedded AI features are built for business dashboards, not survival curves. They can summarize a column or suggest a chart, but they generally don’t run a Cox model, apply a multiple-comparison correction, or fit a mixed-effects model with a nested random-effects structure. Academic statistics live outside the vocabulary these features were designed around.
There’s a deeper structural problem too. Excel’s own type inference, the same mechanism that turns gene names into dates, keeps operating underneath any AI layer bolted on top of the spreadsheet. An AI assistant answering questions about a workbook is still reading data that Excel may have already silently altered. It can’t recover a gene name Excel converted to a date three formatting changes ago.
Version control is another gap. A dedicated platform tracks every input, output, and code revision as a discrete, timestamped artifact. Excel-native AI features generally don’t produce a run log a reviewer can audit, and they rarely export a package that includes environment specs or a data dictionary. Reproducibility, in the sense a journal or IRB actually requires, isn’t the design goal.
None of this makes Excel useless. It makes it an intake and cleanup tool, not a home for statistical inference on data that will end up in a publication or grant report.
Connecting Excel Data to Azure ML, Power BI, and Other AI Platforms
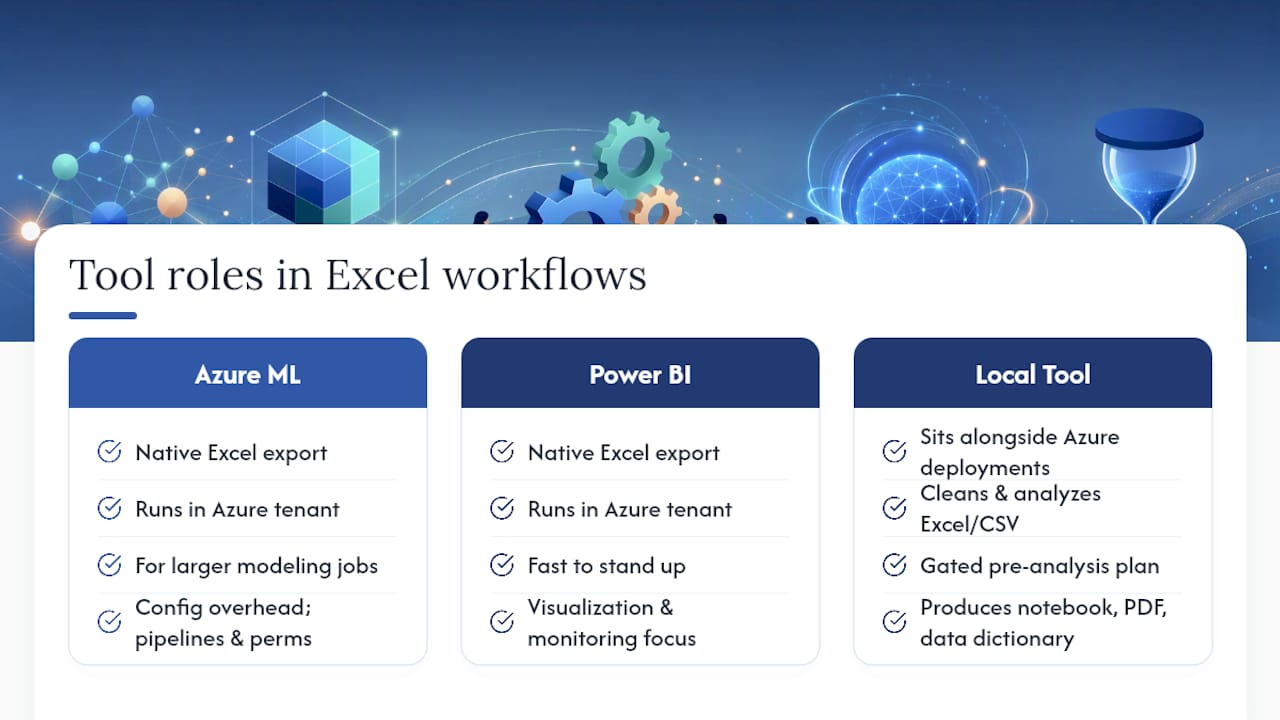
Institutions with existing Microsoft infrastructure often route Excel-origin data into Azure Machine Learning for larger modeling jobs or Power BI for dashboard reporting. Both integrate natively with Excel exports and both can operate inside an institution’s own Azure tenant, which matters for teams under enterprise data-governance agreements.
The tradeoff is configuration overhead. Azure ML needs pipeline setup, workspace permissions, and usually a data engineer to keep it running smoothly across projects. Power BI is faster to stand up but leans toward visualization and monitoring rather than the inferential statistics a thesis chapter needs. Neither tool ships with a pre-analysis plan gate or a research-specific method library out of the box; teams build that scaffolding themselves, project by project.
For labs that already run Azure-based enterprise deployments, a local-execution analytics tool can sit alongside that infrastructure rather than replace it: Excel or CSV data gets cleaned and analyzed under a gated plan, and the reproducible outputs (notebook, PDF, data dictionary) feed into whatever institutional reporting layer Power BI or Azure ML already serves. The integration question isn’t “Excel or a platform.” It’s which layer of the stack each tool is actually good at, and keeping the statistical inference layer separate from the dashboard layer.
Reading AI-Generated Results Without Overtrusting Them
An AI agent proposing a model is not the same as a model being correct for your data. Read the assumptions it checked, not just the output it produced. If it ran a Cox model, did it verify the proportional-hazards assumption? If it ran ANOVA, did it check variance homogeneity before reporting the F-statistic?
Treat every AI-generated coefficient, p-value, or effect size the way you’d treat a result from a new research assistant: plausible until you’ve traced it back to the code. A reproducible export earns that trust faster than a chat transcript, because you can rerun the exact script against the exact data version and get the exact same number.
Watch specifically for silent variable mismatches. If your analysis plan defined “treatment_group” one way and the imported CSV encoded it slightly differently, an agent might run the model anyway and report a coefficient that answers a question you didn’t ask. Cross-check every variable definition in the output against the definition in your PAP before you cite the number anywhere.
When a Local AI Platform Is Worth the Onboarding Time
Adopting a local agentic analytics platform pays off when data is sensitive enough that cloud upload isn’t an option, when multiple analysts touch the same project and need one shared standard, or when you’ll rerun similar analyses across many datasets and want a permanent, auditable record each time.
For a single-analyst exploratory pass on a small, non-sensitive dataset, a scripted R or Python workflow with basic version control is often enough. The tradeoff is straightforward: onboarding a gated, agentic platform costs setup time up front, but it saves far more time later when a reviewer, supervisor, or auditor asks exactly how a result was produced.
— Aymen
Getting Reproducible Analysis Running with Plotstudio
Certain platforms implement every practice covered here as a working feature, not a suggestion. Local execution means your dataset stays on your own machine, which is critical for IRB-governed or GDPR special-category data. Analyses are gated behind plans that are reviewed and approved before code runs, providing a time-stamped audit trail reviewers expect. Skills let labs encode their own statistical protocols, so projects can follow consistent thresholds and reporting conventions rather than drifting between analysts.

The platform runs both R and Python natively and supports methods needed by academic work such as survival analysis, Cox proportional hazards, mixed-effects models, ANOVA, and multiple-comparison correction. Every run exports a reproducibility package including an annotated notebook, PDF report, and a permanent searchable analysis page for supervisor or peer reviewer traceability.
To try it, start with a small CSV, author a short analysis plan, approve it, and run the gated analysis. See how the workflow handles CSV-based research data or Excel-origin datasets directly, and export the package to see what a reviewer would actually receive.
Sources
- ESC—Excel autocorrect study (PMC8357140)
- An international consensus on core reproducibility items in research | PLOS Biology
- Promises and Perils of Pre-Analysis Plans (MIT Economics)
- Reproducible analysis guide (Psych Open Science / Poldrack)
FAQ
What Does “Excel Data Analysis AI” Mean for Academic Research?
For research use, it means a local, privacy-preserving AI workflow that runs against a pre-approved analysis plan, executes R or Python statistical methods, and exports a reproducible notebook and report, rather than a cloud assistant that writes spreadsheet formulas.
Why Does Excel Corrupt Gene Names and Other Identifiers?
Excel’s autocorrect and type-inference heuristics reinterpret certain text strings, like gene names resembling dates, and silently convert them, a failure documented in over 30% of a sampled set of academic supplementary datasets.
What Should a Pre-Analysis Plan Include Before Code Runs?
A PAP should state hypotheses, primary and secondary outcomes, exact variable definitions, exclusion rules, sample-size plans, statistical models, and rules for any subgroup analysis, all approved and time-stamped before execution.
Can I Run AI Analysis on Patient or GDPR Special-Category Data?
Only with local execution, where data never leaves your own machine or institutional environment; uploading such data to a general cloud AI tool typically falls outside most IRB and GDPR approvals.
Does Plotstudio Support R and Python for Academic Methods?
Yes, Plotstudio runs both natively and covers methods like survival analysis, Cox proportional hazards, mixed-effects models, and multiple-comparison correction, exporting the full run as an annotated notebook and PDF.