You're comparing forecasts from a spreadsheet, a statistical package, and perhaps an AI tool, but you can't reproduce the assumptions behind any of them. Forecasting software turns time-stamped data into future estimates, uncertainty ranges, backtests, and decision-ready scenarios. The strongest systems also preserve data lineage, model choices, and executable code, so analysts and researchers can defend a forecast months later.
What Forecasting Software Means for Analysts
Forecasting software ingests historical observations ordered in time, fits statistical or machine-learning models, and produces estimates for future periods. A useful system also reports uncertainty, such as prediction intervals, quantiles, or scenario bands. That distinction matters because a point estimate alone can look precise while hiding substantial risk.
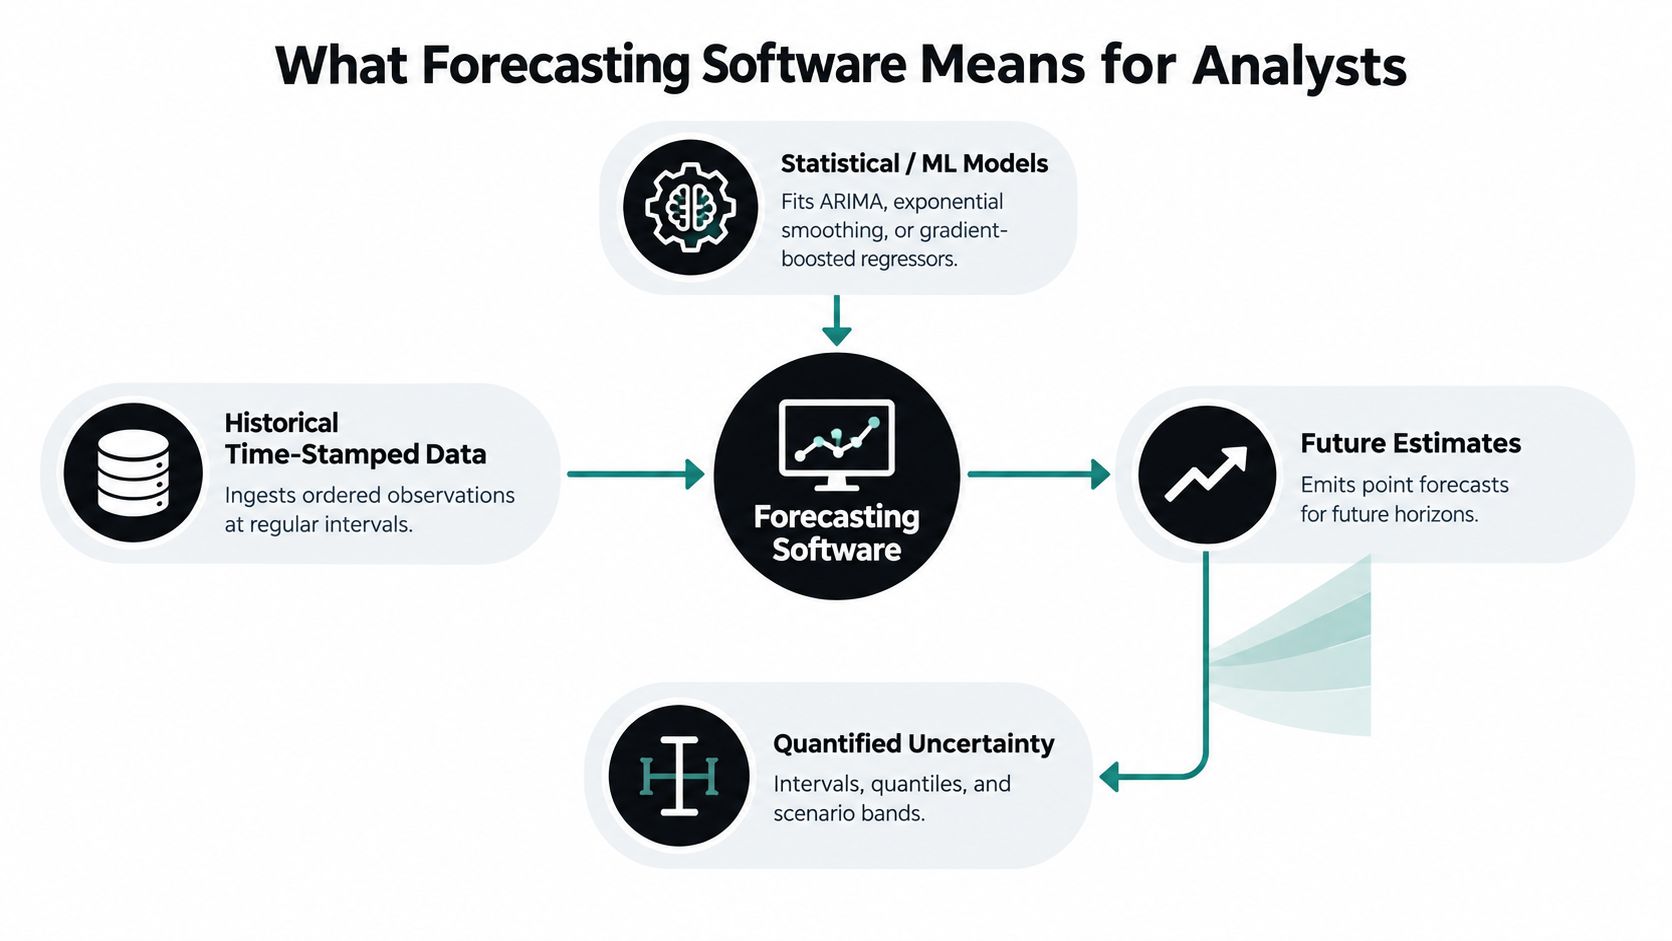
At the lightweight end, a spreadsheet add-in may calculate moving averages or exponential smoothing. Dedicated statistical suites provide broader model libraries, diagnostics, and backtesting. End-to-end platforms add data pipelines, scheduled retraining, APIs, permissions, and monitoring. These categories overlap, but their governance expectations differ.
The jobs a forecasting system performs
A practical forecasting workflow usually includes:
- Data preparation: Import observations, identify missing periods, detect outliers, and align timestamps.
- Feature construction: Create lags, seasonal indicators, calendar variables, intervention flags, or external drivers.
- Model fitting: Estimate candidate models such as ARIMA, ETS, regression, gradient-boosted trees, or neural networks.
- Backtesting: Compare forecasts against known historical periods using holdout or rolling-origin evaluation.
- Scenario analysis: Change assumptions about promotions, staffing, prices, policy, or other drivers.
- Operational delivery: Publish forecasts to a planning process, dashboard, report, or downstream system.
Business analysts often prioritize speed, collaboration, scenario planning, and integration with finance or operational systems. Research scientists need those capabilities plus reproducibility, audit trails, explicit assumptions, and methodological transparency. A forecast that cannot be reconstructed from the original inputs and model configuration is difficult to defend, even if its headline accuracy looks good.
Practical rule: Treat a forecast as a chain of evidence, not just a number.
The right tool narrows the gap between an exploratory notebook and a production forecast. Another analyst should be able to identify the data vintage, transformations, selected model, validation design, and uncertainty calculation without relying on personal memory.
How Forecasting Software Evolved Over Decades
Forecasting software grew alongside computing. Practical statistical forecasting became possible after computers emerged in the 1950s, while forecasting software for business planners appeared in the 1970s. A historical review records that more than 100 forecasting software packages were available for the PC by 1989, and links that expansion to hardware, operating systems, and graphical interfaces as well as statistical progress (historical review of forecasting systems).
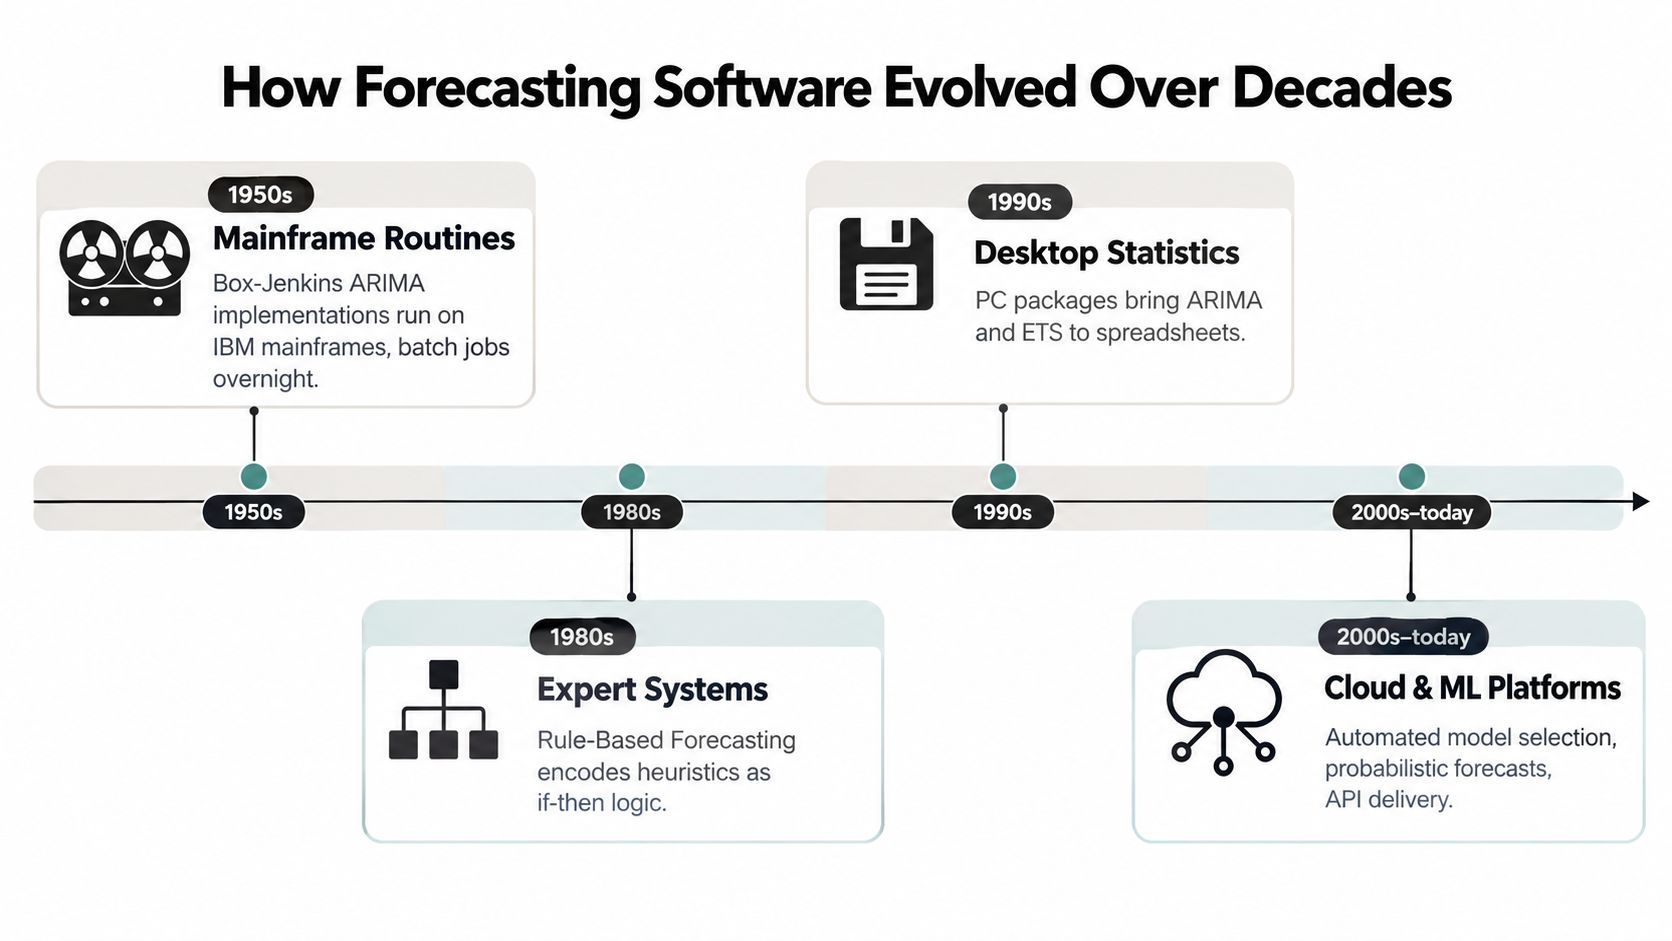
Early systems ran statistical routines in batch jobs on mainframes. The introduction of OS/360 in 1967 made it easier to move forecasting programs across IBM mainframe hardware, while graphical user interfaces in the 1980s expanded access beyond specialist programmers. Users began to expect visual diagnostics, interactive data handling, and repeatable workflows rather than isolated overnight calculations.
The next phase brought desktop statistical packages and open-source libraries. Tools such as R's forecasting ecosystem and Python's statsmodels made established methods available without the same dependence on proprietary seats. Cloud services later added shared storage, scalable computation, application programming interfaces, and scheduled pipelines.
Why modern interfaces combine old and new methods
Machine learning introduced flexible nonlinear models, including boosted trees, recurrent networks, and transformer-based forecasters. More recent forecasting systems also include specialized architectures such as N-BEATS and N-HiTS. Yet classical models remain useful because many time series are short, seasonal, noisy, or easier to explain with a compact statistical structure.
Each era left a different expectation behind:
- Mainframes established batch processing and computational discipline.
- Desktop tools made forecasting accessible to analysts.
- Open-source libraries exposed methods and code.
- Cloud platforms normalized collaboration and deployment.
- Machine learning systems expanded the range of patterns a tool can model.
That history explains why current forecasting software often puts ARIMA, exponential smoothing, regression, and deep learning behind one interface. Users want automation, but they also want to inspect what happened when the forecast changed.
Core Forecasting Methods Explained Simply
The method should follow the structure of the data, not the novelty of the software. Begin with the simplest defensible baseline, then test more complex approaches only when they address a visible pattern or decision need.
ARIMA and seasonal ARIMA
ARIMA predicts a series using its past values and past errors. Differencing can remove trend-like behavior, while autoregressive and moving-average terms capture temporal dependence. It's often a strong starting point for a single series where the past contains useful information about the near future.
SARIMA extends ARIMA with seasonal terms. Monthly retail demand with a repeating annual pattern is a natural example. The model can represent both ordinary temporal dependence and recurring seasonal behavior, but it assumes the underlying relationships remain reasonably stable after transformation.
Exponential smoothing and ETS
Exponential smoothing gives greater weight to recent observations. The ETS framework describes forecasts through error, trend, and seasonality components. It works well when level, trend, and recurring seasonal patterns drive the series and when an analyst wants a model that is comparatively easy to explain.
Prophet
Prophet is a decomposable additive model designed around trend, seasonality, and calendar effects. It can be convenient for business series with holidays, irregularly spaced observations, or missing days, provided the analyst understands how its components represent the data. It shouldn't be treated as a universal replacement for diagnostics or competing models.
GARCH
GARCH focuses on changing variance rather than only changing the expected value. Financial returns and risk series may show periods of calm followed by periods of volatility. A GARCH model can support volatility forecasts used in risk analysis and Value-at-Risk workflows, but it requires careful attention to distributional assumptions and residual behavior.
Causal and machine-learning models
Causal forecasting uses drivers that can plausibly explain future movement. A regression with lagged promotion variables, prices, weather, or policy indicators can answer a different question from a purely historical model. Intervention analysis is useful when an analyst wants to estimate how a defined event altered a series, although confounding remains a serious concern.
Machine-learning models work differently. Gradient-boosted trees can learn nonlinear relationships among lagged values and external features. Recurrent networks model sequential representations, while transformer-based forecasters use attention mechanisms to relate observations across a sequence. These approaches can help when many drivers and series interact, but their added flexibility increases the need for leakage controls, validation, and explanation.
| Method | Best for | Key assumption | Interpretability |
|---|---|---|---|
| ARIMA | Single-series short- to medium-horizon forecasts | Past values and errors contain stable temporal information | High |
| SARIMA | Seasonal demand or operational series | Seasonal structure repeats sufficiently | High |
| ETS | Level, trend, and seasonality | Recent observations should receive substantial weight | High |
| Prophet | Calendar-heavy business series | Trend and calendar effects can be decomposed | Moderate |
| GARCH | Volatility and risk series | Conditional variance changes over time | Moderate |
| Causal regression | Forecasts informed by known drivers | Drivers are measured and their relationships are defensible | High to moderate |
| Gradient-boosted trees | Feature-rich tabular forecasting | Engineered lags and drivers capture useful nonlinearities | Moderate |
| Neural and transformer models | Larger, complex collections of series | More flexible representations improve generalization | Lower without supporting diagnostics |
For a deeper treatment of model families and their assumptions, see this guide to time-series analysis methods.
Key Features That Separate Tools in Practice
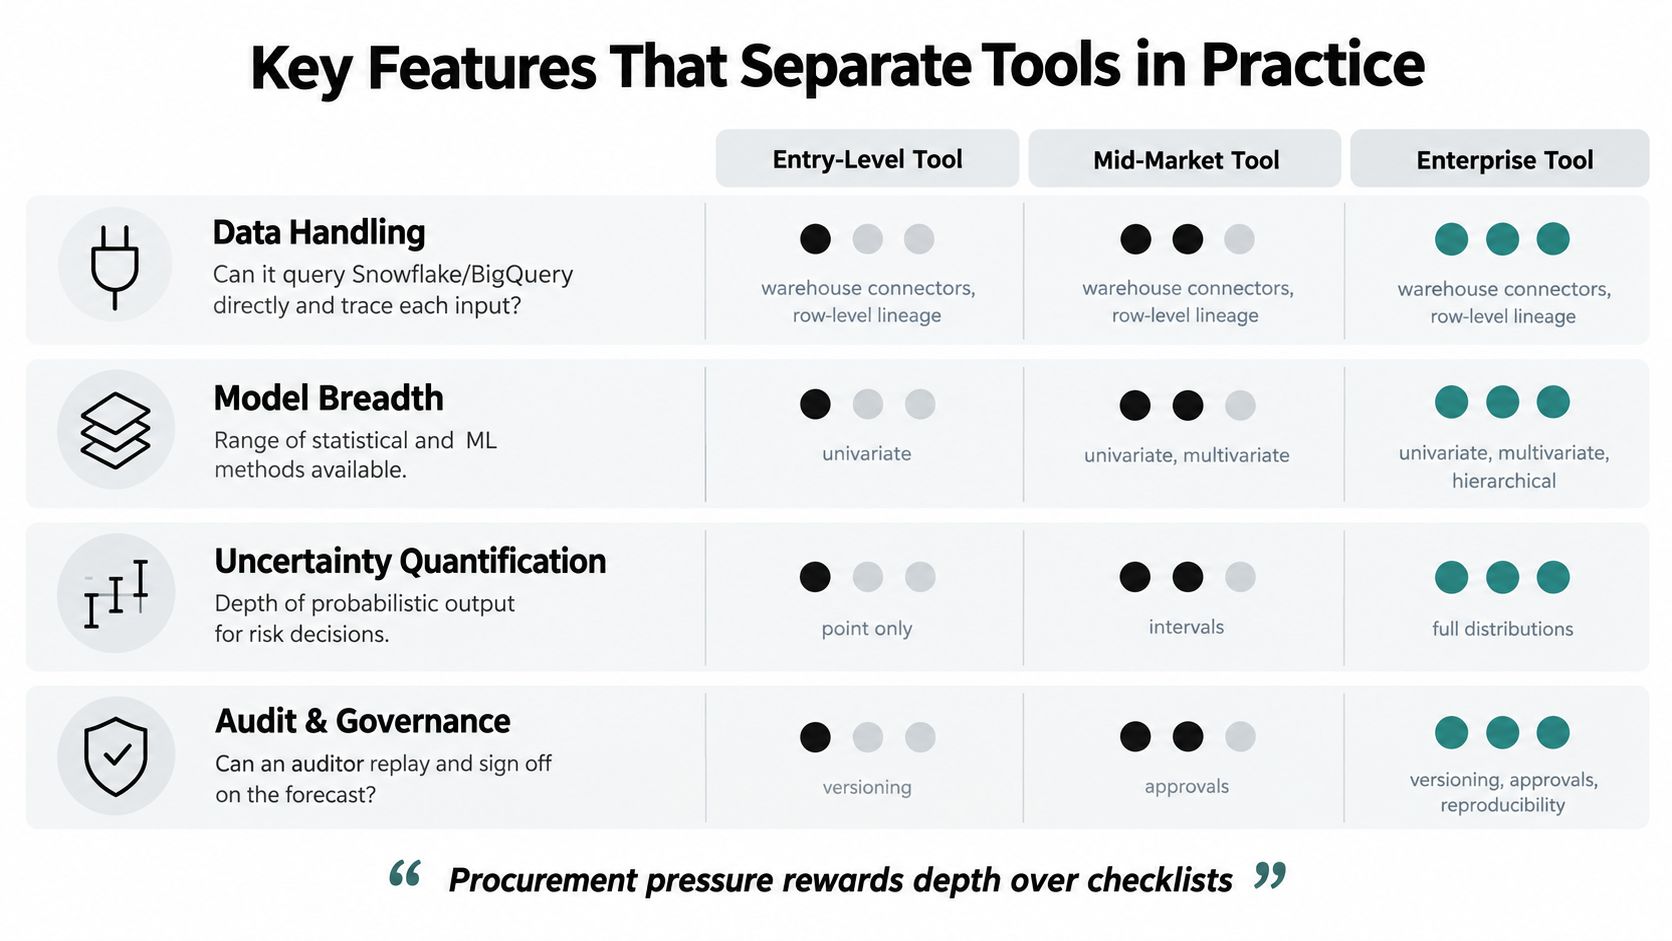
A vendor demo can make almost any forecasting product look capable. Procurement should test what happens when data is incomplete, assumptions change, and a reviewer asks why the forecast moved.
Six capabilities worth testing
Data handling comes first. Check warehouse and ERP connectors, mixed-frequency support, missing-data policies, outlier treatment, and timestamp alignment. A tool should let you inspect how raw records became modeling inputs.
Automation and control need to coexist. Automated ARIMA or ETS selection can reduce repetitive work, but a senior modeler should be able to override a recommendation, exclude a candidate, or impose a business constraint.
Model selection should expose evidence. Look for candidate rankings, residual diagnostics, information criteria, validation slices, and uncertainty outputs. A single “best model” label isn't enough when the selection process itself may be unstable.
Explainability depends on the method. Statistical models may offer component decompositions and coefficients. Machine-learning models may need feature attributions, partial-dependence views, or carefully written driver summaries.
Reproducibility requires more than saving a chart. The system should preserve the dataset version, transformations, package environment, parameters, model object, random seeds where relevant, and evaluation results. Tools that retain run configurations and forecast lineage address this problem directly, as described in AI planning and forecasting.
Privacy and hosting determine whether the workflow fits the organization. Evaluate data residency, encryption, single sign-on, role-based access, retention, export controls, and whether raw data leaves the approved perimeter.
A simple scorecard can expose gaps quickly:
| Dimension | Procurement question |
|---|---|
| Data handling | Can the team trace every input and transformation? |
| Automation | Can users inspect and override automated choices? |
| Model comparison | Are diagnostics and validation results visible? |
| Explainability | Can a stakeholder understand the main drivers? |
| Reproducibility | Can another analyst rerun the exact analysis? |
| Privacy and hosting | Does deployment match data and governance requirements? |
The same principle applies when evaluating adjacent analytics systems, including software for peer-to-peer campaigns, where data lineage, permissions, and reporting reliability can matter as much as the visible dashboard.
For research teams comparing broader analytics environments, AI analytics platform capabilities provide a useful reference point for assessing execution, transparency, and persistence.
A Practical Workflow From Data to Decision
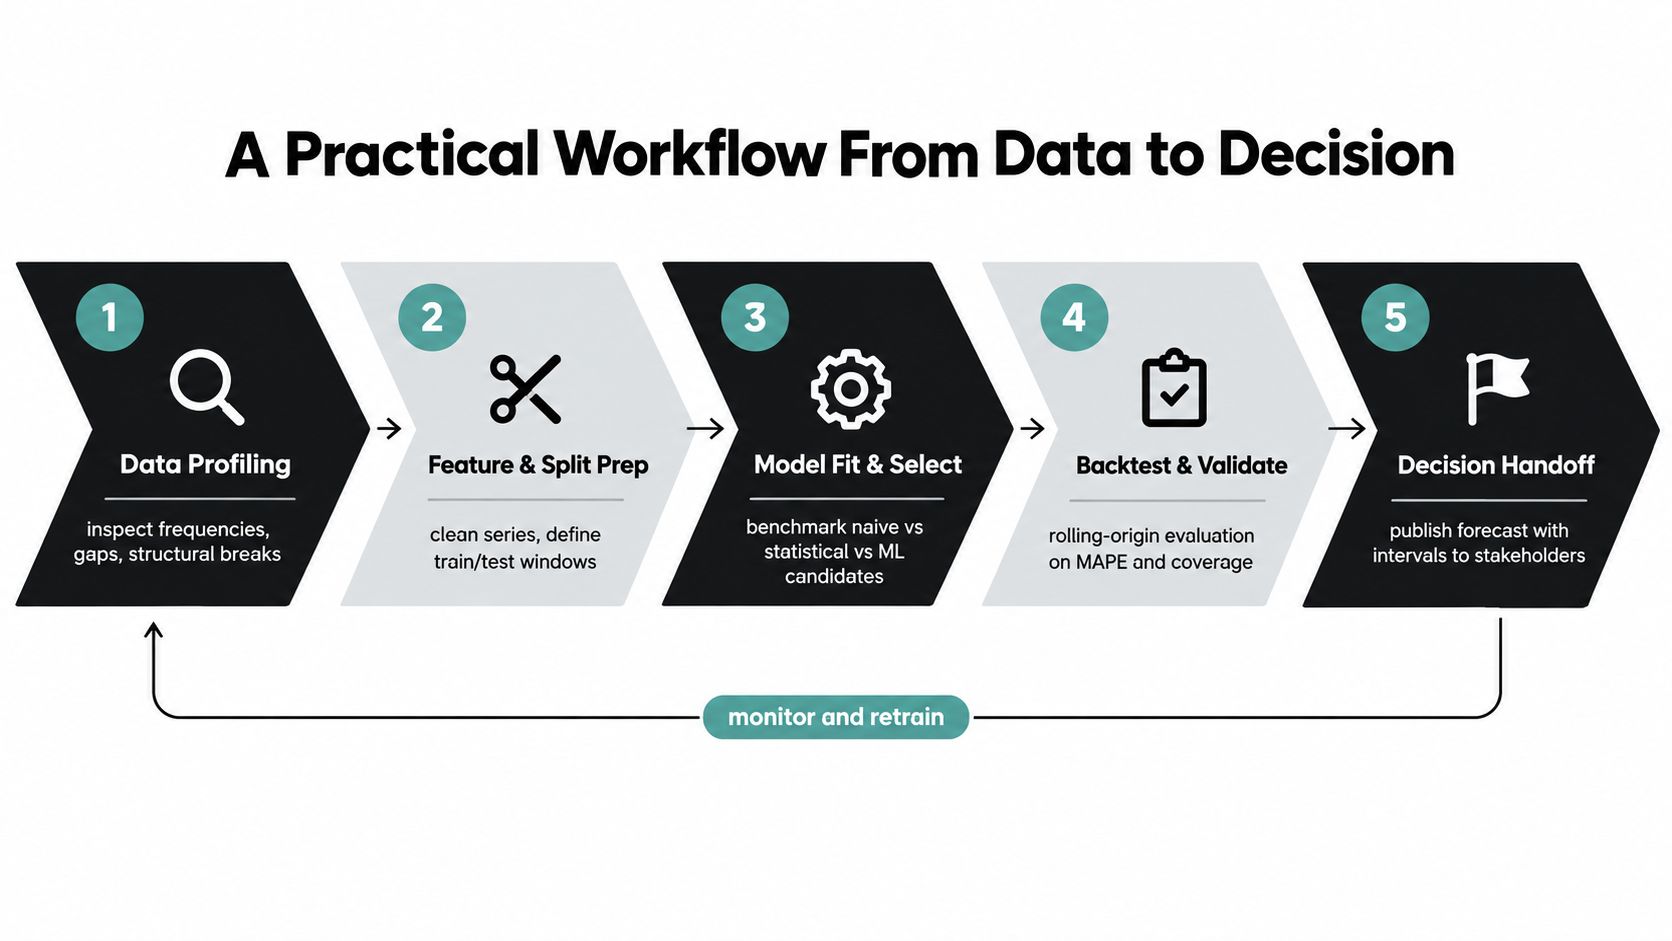
A dependable forecast starts before model fitting. First, profile the series. Confirm its frequency, identify gaps, inspect structural breaks, and annotate known events such as promotions, holidays, policy changes, or equipment failures.
Prepare the evidence
Clean the data with explicit reasoning. Decide whether missing observations represent zero activity, unavailable measurement, or a broken collection process. Create lag features, calendar variables, and intervention flags only when their timing would have been available at the forecast origin.
Use a temporal split rather than a random split. A rolling-origin design repeatedly trains on earlier observations and evaluates on later periods, which better reflects how the forecast will operate after deployment.
Build from a baseline
Start with a naive or seasonal-naive forecast. The baseline gives the team a reference point and prevents a complex model from receiving credit for failing to beat a simple rule.
Then escalate to ARIMA or ETS. Consider Prophet, regression, or gradient-boosted models when calendar structure, external drivers, or nonlinear relationships justify them. Compare candidates on identical validation windows and inspect residual autocorrelation, changing variance, and systematic bias.
Review question: Could the model have used information that wasn't available on the date it claims to forecast from?
Package the decision
Record the data vintage, transformations, hyperparameters, exclusions, selected model, validation design, and known failure modes. The delivery should include the forecast, uncertainty interval, backtest chart, and a short explanation that a non-technical stakeholder can challenge.
For finance teams, a forecast may feed a reporting workflow, so the handoff should preserve both the analytical result and its business interpretation. A resource such as this healthcare financial reporting solution illustrates why reporting context matters when predicted values become part of operational or financial review.
Monitor performance after release. New observations can reveal drift, changed seasonality, broken inputs, or a structural event that no historical model anticipated. Retraining should follow an explicit policy rather than happen invisibly.
Validation Metrics and Model Comparison
Forecast accuracy isn't one universal number. The right metric depends on scale, zeros, asymmetry, and whether the decision uses point forecasts or uncertainty distributions.
MAE reports average absolute error in the original units, which makes it easy to interpret. RMSE gives extra weight to larger misses, making it useful when severe errors are especially costly. RMSLE emphasizes relative differences on a transformed scale and can be appropriate for nonnegative quantities with wide magnitude variation.
Percentage metrics such as MAPE and sMAPE are intuitive, but they behave poorly near zero. MAPE can become unstable or undefined when actual values approach zero, and its error treatment is asymmetric. MASE avoids the scale problem by comparing performance with a naive or seasonal-naive benchmark. For probabilistic forecasts, pinball loss evaluates quantiles rather than only the central estimate.
| Metric | Scale-free | Best use | Pitfall to avoid | Validation pairing |
|---|---|---|---|---|
| MAE | No | Typical absolute error | Hides the relative size of errors across series | Rolling-origin |
| RMSE | No | Penalizing large misses | A few outliers can dominate | Walk-forward |
| RMSLE | Relatively | Nonnegative data with multiplicative differences | Less intuitive in original units | Blocked splits |
| MAPE | No, despite percentage form | Simple percentage communication | Near-zero and asymmetric behavior | Carefully filtered holdouts |
| sMAPE | Partly | Comparing relative error patterns | Can still behave oddly around small values | Rolling-origin |
| MASE | Yes | Comparing series with different scales | Depends on an appropriate naive benchmark | Rolling-origin |
| Pinball loss | For a chosen quantile | Probabilistic forecasts and intervals | Requires correct quantile interpretation | Walk-forward with coverage checks |
A single holdout is fast but fragile. Rolling-origin or walk-forward validation simulates repeated retraining while respecting temporal order. Blocked splits help prevent leakage from future-derived features.
A serious comparison reports the mean and dispersion of the chosen metric across folds. It also examines residual plots, coverage of prediction intervals, driver plausibility, and retraining cost. The winner should demonstrate a meaningful and stable advantage, not merely one fortunate split.
The forecasting accuracy guide offers a practical companion for connecting metrics with validation design.
Choosing Deployment Models for Auditable Forecasts
Deployment affects whether another person can reproduce the forecast. Choose it by answering three questions: where does sensitive data originate, who must rerun the forecast later, and what will an internal reviewer or regulator inspect?
On-device deployment
Local software keeps data on a controlled laptop or server. Analysts can pin package versions, preserve model code, export prediction logs, and restrict access through existing device controls. This approach is attractive for research data, protected health information, financial records, and personally identifiable information.
The trade-off is operational responsibility. The team must manage updates, environments, backups, documentation, and access. A local installation can be highly auditable, but only if the organization preserves its inputs and runtime dependencies.
Cloud deployment
Cloud platforms offer shared access, elastic computation, managed retraining, and centralized monitoring. They also require due diligence. Review identity controls, encryption, retention, audit logs, data residency terms, provider assurance evidence, and the boundaries of support access.
Cloud convenience doesn't automatically create reproducibility. A scheduled job should still record the input snapshot, code or model version, parameters, feature definitions, and output artifact.
Hybrid and air-gapped patterns
A hybrid design can keep sensitive data and core modeling inside a controlled environment while sharing approved configurations or aggregate outputs through a secure service. Fully air-gapped installations remain appropriate when policy forbids external connectivity or the data cannot leave a protected network.
Audit principle: Store every artifact where the reviewer can reach it, from the input snapshot to the model hash and prediction log.
The deployment choice should follow the audit path. On-premise analytics guidance can help teams compare local control with shared infrastructure, but the final decision should reflect institutional policy and the sensitivity of the research data.
Choosing the Right Tool and Common Questions
Use this checklist before signing a contract:
- Methods: Does the product support the statistical and machine-learning approaches your series requires?
- Validation: Can it run temporal backtests, compare candidates, and expose residual diagnostics?
- Reproducibility: Can you export code, data snapshots, parameters, dependencies, and results?
- Deployment: Does hosting match privacy, latency, access, and audit requirements?
- Integration: Can it connect to the systems that supply inputs and consume forecasts?
- Ownership: Who will maintain the pipeline, review assumptions, and investigate failures?
A broader comparison of data analysis software is useful when forecasting is only one part of a research workflow.
Frequently asked questions
What is forecasting software?
It's software that uses time-ordered data to estimate future values, quantify uncertainty, compare models, and support decisions.
What's the difference between classical and machine-learning forecasting?
Classical methods encode structured temporal relationships and are often easier to interpret. Machine-learning methods can represent more complex relationships but usually demand stronger feature controls and validation.
Does ARIMA still matter?
Yes. It remains a useful interpretable baseline and can be competitive when a series has stable temporal structure.
How often should models be retrained?
Retraining should follow the rate of data change, forecast horizon, drift risk, and operational cost. Monitor first, then define a policy based on observed degradation rather than an arbitrary schedule.
What should an audit trail contain?
At minimum, preserve the input data version, transformations, model configuration, validation results, generated forecast, uncertainty method, approvals, and output timestamp.
The best forecasting software isn't the one with the longest feature list. It's the one whose data, assumptions, predictions, and evaluation path another analyst can reconstruct when the original author is unavailable.
If you're evaluating forecasting workflows for research or sensitive analysis, try PlotStudio AI with discounted researcher pricing and 1,000 free credits for researchers, then test whether its local execution and saved analysis artifacts fit your reproducibility requirements.