
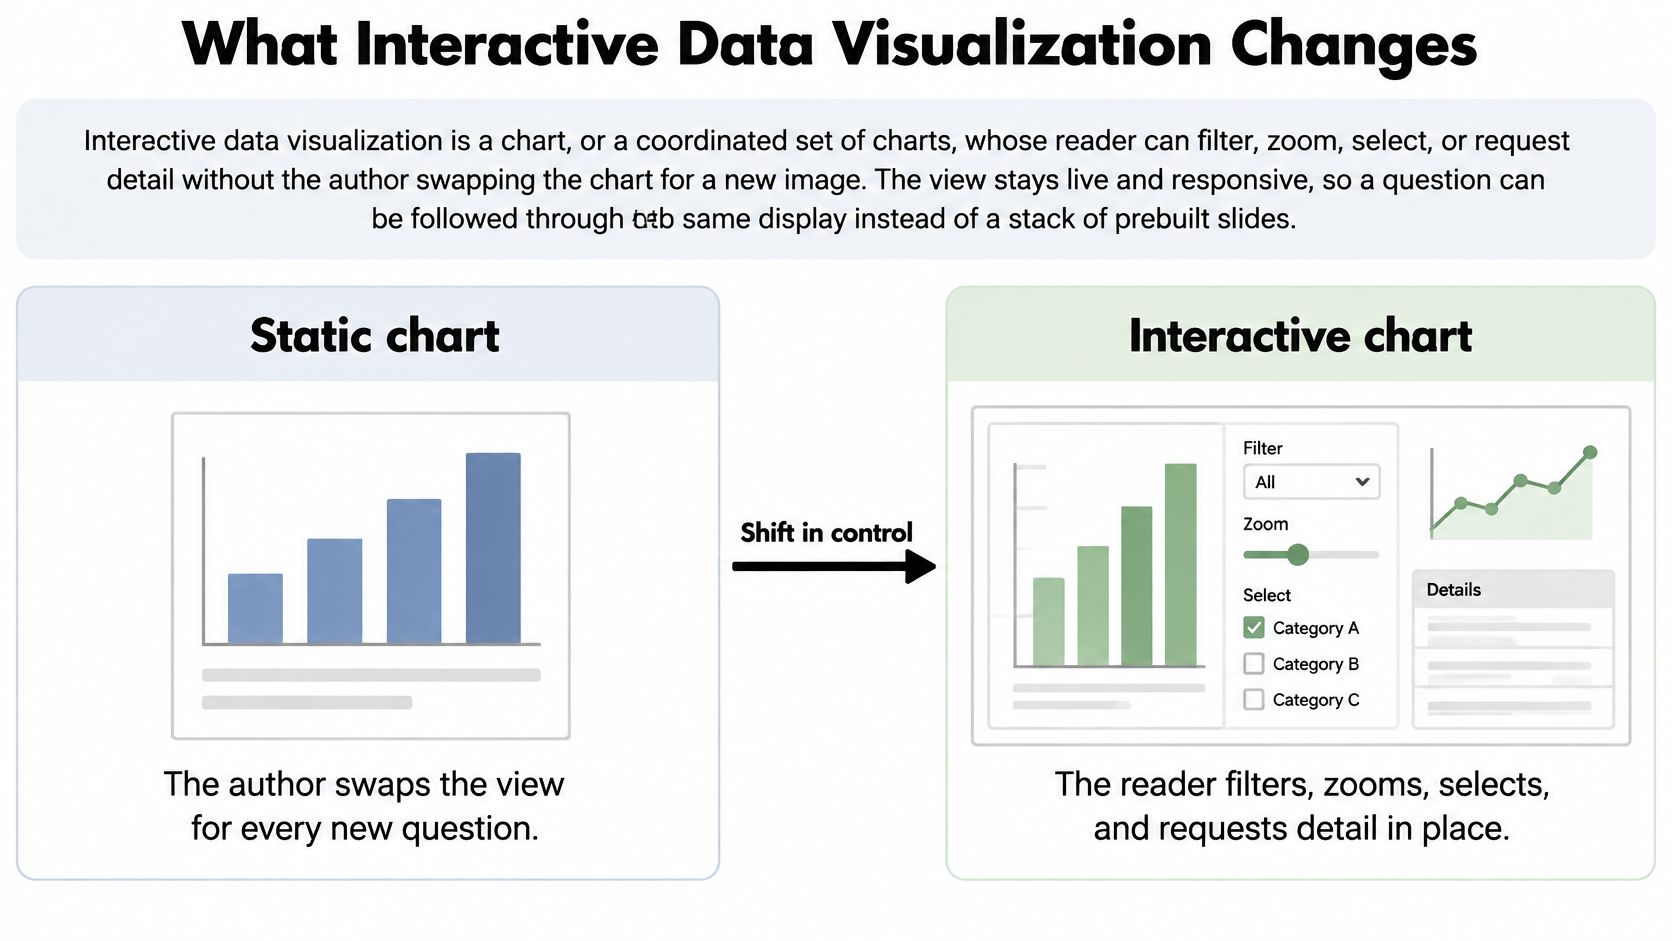
Interactive data visualization is a view a reader can filter, zoom, select, or inspect, while a clear default still shows the main result. It supports investigation. It does not replace a static comparison. The popular advice to add controls until a chart feels modern fails that test. A sequence set down in 1996 still starts with the full picture, and a later filter only narrows a question the overview already stated.
A control changes the claim only if you let it. Filtering a site, zooming a follow-up window, or highlighting one genotype can speed the next question. It does not make a result more correct. If the sentence you want to publish appears only after a reader touches a control, you do not yet have a result. You have an exploratory slice that still needs a title, a sample size, and a way for someone else to rebuild it.
What Interactive Data Visualization Changes
Interactivity often gets added too late. Teams treat it as a coat of paint on a finished chart: a dropdown here, a tooltip there, a hover state that looks polished in a demo. That misses the change. Interactive data visualization turns a figure into an investigation layer. The default view still has to carry the result. The controls let a reader ask what sits behind it.
A study in Journal of Management Control examined how visualization type and interaction technique affected people working with big-data visualizations. Interaction had a limited effect on effectiveness, meaning whether users reached the correct result. It had a positive effect on efficiency and satisfaction, and higher usability than static alternatives. That pattern is useful because it keeps the claim modest. Interactivity can help people work faster and with less friction. It does not make the underlying comparison more valid.
Think of a figure as a courtroom exhibit. The exhibit shown by default is the evidence the author wants the room to see. Interactive controls are the cross-examination. They let someone ask whether the pattern holds for one site, one subgroup, or one time window. If the answer depends entirely on a control nobody can see in the published sentence, the figure has become a private conversation.
That is why a clear static chart can outperform a confusing interactive one when the task is a single communication claim. If the paper's contrast is pre-specified, extra filters mostly create chances to hide the group that weakens the sentence. The honest default keeps the comparison visible, with units and uncertainty attached. A filtered state can then be used as a supporting check, not as the only route to the conclusion.
What must stay visible if nobody clicks
Read the choice by task, not by software. For each job, decide what remains on screen if the reader never touches a control.
| Research task | Static chart | Interactive view | Prefer static when |
|---|---|---|---|
| One main comparison | A single encoded comparison with title, units, and uncertainty | The same comparison plus filters that can hide a group | The paper's claim is one pre-specified contrast |
| Subgroup exploration | A separate small multiple or appendix chart per group | Filter, brush, or linked views across groups | The subgroup list is small and specified in advance |
| Exact record or value | A footnote or accompanying data table | Tooltip, selection, or details on demand | Readers must cite exact values rather than a pattern |
| Several variables together | Small multiples with a shared scale | Brushing and linking across coordinated plots | Two variables already tell the whole story |
| Outlier or anomaly check | One annotated point on the full distribution | Zoom or isolate after the full distribution is visible | The outlier is itself the result being reported |
One main comparison. The static frame is the argument: arm A versus arm B, with units and an interval. Filters that can drop a group belong in an appendix path, not on the sentence you cite.
Subgroup exploration. If the groups were named before you looked, a small multiple is often clearer than a dropdown. Interaction earns its place when the list is long and you are still checking, not confirming.
Exact records. A tooltip is a convenience. If a reviewer must quote a number, that number also lives in a table that does not depend on a hover. The hover can reveal context. It should not be the only doorway to the evidence.
Several variables. Brushing helps when the same observations need to be seen in more than two plots. If two variables already carry the story, a third linked panel mostly adds memory load. The reader has to remember which points were selected before they can interpret the new view.
Outliers. Zoom is fair only after the full distribution is visible. Isolating a point and then calling it the result skips the comparison that made it unusual. An anomaly is a relationship between one case and the rest of the data, so the rest has to stay nearby.
Decision rule: Use interaction while the question is still exploratory, and freeze a titled static view once the comparison is confirmatory.
Interaction Patterns from Overview to Detail
The default view is the claim. Interaction is the investigation layer that lets a reader ask, "What changed when I narrowed this?" That distinction matters in research plotting: a filtered view can reveal where an effect is concentrated, but it does not make the effect more valid. If a sentence reports a result from a filtered state, that state must be reconstructible from the figure, table, or analysis page attached to the claim.
Ben Shneiderman's milestones in statistical graphics place the modern foundations in the 1990s, not in a single product. Treemaps, introduced in 1991, represented hierarchies as nested rectangles whose areas correspond to quantitative values. Between 1991 and 1996, systems such as XGobi and ViSta let analysts manipulate statistical views instead of only printing charts. In 1996, Shneiderman stated the principle "overview first, zoom and filter, then details on demand."
That sequence works like a research protocol. Overview establishes the full cohort, the full follow-up period, or the full yield distribution before anyone touches a control. Zoom and filter then narrow a time window, treatment arm, site, or numeric range. Details on demand expose an identifier, unit, sample size, or row. The shift was from a presentation medium toward an analytical environment built from human-computer interaction, statistics, and information visualization together.
The same overview-then-detail habit appears in site comparison tips on Divegrade: a whole site should be legible before someone zooms into one feature. A research figure needs the same restraint. Readers should see the frame of the argument before they are invited to inspect a corner of it.
One pattern per figure
| Pattern | What the reader does | Research job | Risk if misused |
|---|---|---|---|
| Overview first | Sees the full distribution before using controls | Judge shape, range, and missingness | Opening on a filtered subset |
| Zoom and filter | Narrows time, group, or numeric range | Subgroup checks and sensitivity analysis | Dropping the comparison group silently |
| Details on demand | Opens a tooltip or row | Read exact values, units, and identifiers | Leaving the only copy of a number in a hover state |
| Brushing and linking | Selects marks in one view and highlights them in others | Relate variables for the same observations | Treating co-selection as causation |
| Linked small multiples | Compares panels on one shared scale | Treatments, sites, waves, or genotypes | Letting each panel rescale itself |
| Chart with a table | Sorts and reads the encoded rows | Exact values and non-visual access | Chart and table showing different subsets |
Overview first is not a title slide. For a longitudinal clinical file, it is the whole-cohort trajectory, including people who later look inconvenient. Opening on one site already answers a different question.
Zoom and filter is the treatment-arm or site control. A difference that appears only after a site is removed is a sensitivity result, and the primary result still needs the full comparison. Label the narrowed view as sensitivity work, and keep the dropped group named.
Details on demand should add the person-level row, the unit, and the sample size. Hover text helps a reader locate a value, but it is a poor archive. If the only copy of the estimate sits in a hover state, the figure fails as soon as someone cannot hover.
Brushing and linking selects the same observations across plots. It answers a practical question: do the rows with high baseline values also cluster in one follow-up window, one site, or one genotype group? Co-selection shows that those rows travel together. It does not show that one variable caused the other. A linked view is still descriptive unless the study design supports a causal claim.
Linked small multiples keep one scale across treatments, sites, or genotypes. If each panel rescales itself, a flat site can look as dramatic as a steep one. Shared scales make the comparison itself visible.
A paired sortable table must encode the same rows as the chart. Sorting is fine. Swapping the subset without notice is not. If the chart shows the full cohort and the table shows only complete cases, the reader now has two studies with one caption.
Pick one primary pattern for each figure. Stacking overview, brush, zoom, genotype highlight, and a second filter in one frame makes it unclear which control changed the sentence. Coordinated views have a place when the question spans several panels, as in dashboards in Python, but the opening state still needs to show the full distribution and preserve the comparison.
Encodings That Stay Honest Under Interaction
Controls do not repair a bad encoding. A scientific review of visual reasoning concludes that visual channels differ in numeric accuracy, and that effective graphics should minimize working-memory demands, guide attention, and use familiar conventions. Poorly chosen encodings produce systematic misperceptions, not merely an ugly chart.
Put quantities readers must compare precisely on aligned position. Reserve area, angle, and color variation for coarser judgments. Interaction can expose detail. It should not force someone to remember the previous state, and it should not compensate for an ambiguous chart.
The U.S. Web Design System guidance on data visualizations adds a load limit: no more than two or three concepts in one visualization. It also warns that interaction has a usability cost. Readers should not have to click, hover, or filter merely to understand the central message. The default state has to communicate that message with no control touched. When a filter does change, axis definitions, units, sample size, and uncertainty intervals stay on the figure. They do not move into a tooltip. Textual axis labels, a table of the underlying data, and a plain-language description of the trend matter even more when the chart is SVG, because a screen reader may not reliably read everything inside the graphic.
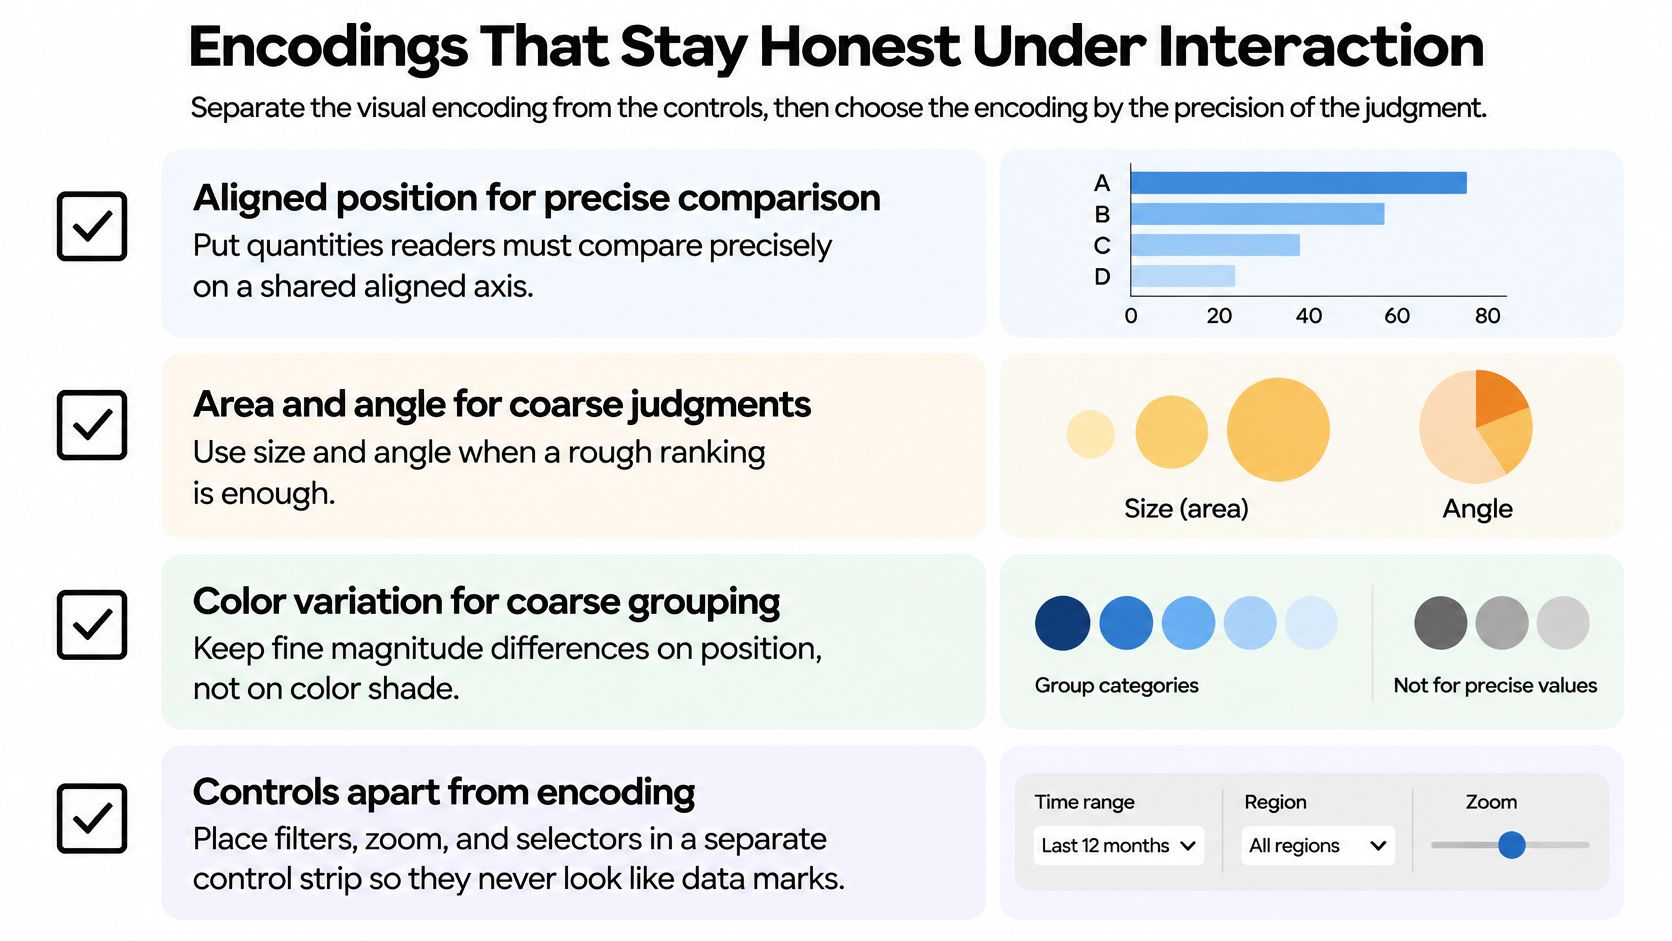
A bubble chart that cannot be ranked
Say a genotype trial draws yield as bubble area and again as color. Varieties cannot be ranked, because area and shade are both coarse channels, and they disagree as soon as two bubbles are close in size. The redesign is a dot plot of mean yield with confidence intervals, sorted on one common scale. Hover, if you keep it, carries site and sample size, not the estimate itself. How to read those intervals, including what a interval does not prove, belongs with understanding confidence intervals rather than inside the bubble legend.
Evaluate the redesign with task measures, not with a preference vote. Compare value-estimation error, ranking accuracy, time to answer, and error rate under the old encoding and the new one. If people rank faster and miss fewer orderings on the dot plot, the encoding changed the reasoning. The filter did not.
Latency can hide the subset
Speed is part of honesty. Filtering, brushing, zooming, and linked updates can trigger query execution, transfer, transformation, and rendering. TimeVizBench treats that path as an end-to-end profile: query time, network-transfer time, rendering time, visual similarity using SSIM, and data-reduction efficiency. A fast aggregated view can hide the subset the reader thinks they are seeing. Pre-aggregation and multiresolution summaries help only if you check them against visual fidelity and task accuracy, not against latency alone.
Apply this audit to a figure you already have:
- Position. Precise comparisons sit on a shared aligned axis.
- Default. The central result is readable before any control.
- Load. The frame carries two or three concepts, not a control for every covariate.
- Labels. Units, sample size, and intervals remain visible after a filter.
- Subset. Whatever renders quickly is the same subset the caption names.
Accessible Interaction Not an Export Step
A chart with controls is still one chart. Accessibility asks whether readers can reach the same finding through more than the picture and can reproduce the state behind any sentence built from it. For public-sector web content in the United Kingdom, the Government Analysis Function chart guidance requires Level A and AA success criteria of WCAG 2.2. Success criterion 1.1.1 requires every non-text element, including a chart, to have a text alternative that serves an equivalent purpose.
That requirement becomes clearer with a concrete case. Suppose a figure shows monthly adherence by clinic, with a filter for clinic site. The default view should state the overall pattern before anyone touches a control. The table should show the same subset currently plotted, including units and sample size. A reader who selects one clinic by keyboard should be able to read the corresponding values and comparison without hovering over points.
The practical split is simple. Provide a data table when readers are expected to read exact values. Provide a concise textual description when the takeaway is a trend, a comparison, or an overall message. An interactive research figure usually needs both. A hover state is not available to every reader, so it cannot be the only route to the number.
Controls that match the mouse path
UK education design guidance for charts sets the mechanics. Keyboard users must enter and operate the visualization with the Tab key, and they should perform the same essential interactions available to mouse users. Filters, navigation buttons, and parameters need instructions, descriptive labels, and error messages. A tooltip that keyboard or assistive technology cannot reach is non-essential. Disable it, or stop treating it as the place a result lives.
A hover-only annotation, a mouse-only filter, or an unlabeled dropdown is not a publication-quality interaction. Test filtering, sorting, and keyboard-only navigation with assistive technologies. Automated checks will miss a control that is present in the DOM and still impossible to operate.
Recent work with blind and low-vision participants, reported by Monash University researchers on tactile displays and conversational agents, found that effective exploration depends on the task and on experience. Participants strongly preferred combining refreshable tactile displays with speech over either modality alone. Tactile graphics also supported deeper, more independent interpretation for experienced users. The relevant design lesson is modest: give readers more than one route into the figure, and keep those routes tied to the same underlying view.
Preferences that reset on every visit are not access. They are homework assigned to the reader.
The response is narrower than a menu full of toggles. Ship accessible defaults. Keep persistent preferences. Offer keyboard-first filtering. Keep a synchronized chart and table of the visible subset, and do not narrate a summary that the reader cannot interrogate. Broader choices about encodings and defaults sit with data visualization best practices, but the test for this figure is local.
Complete one filter and one selection using only the keyboard. Then confirm the table matches the visible subset, including sample size and units. If the table still shows the full cohort while the chart shows one site, the alternative text is describing a different claim.
Research Cases Where a Filter Changes the Claim
A filter earns its place when it answers a named question and leaves the primary estimate labeled. It fails when the striking slice becomes the sentence without a new design.
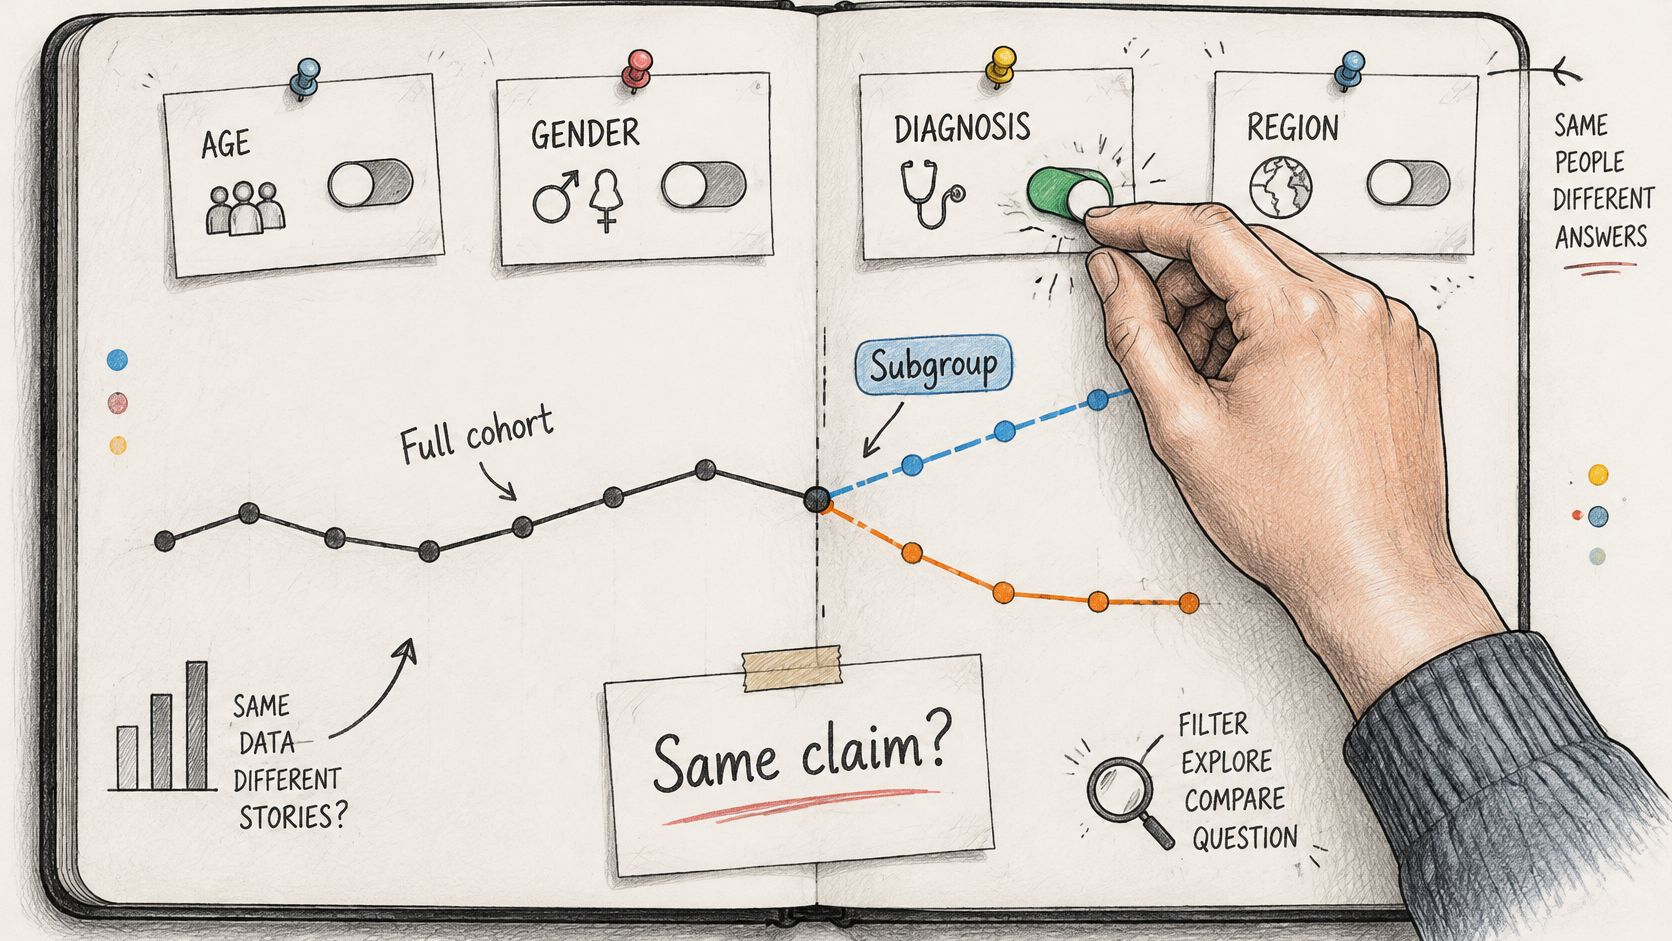
Repeated measures in a clinical file
The overview is the full-cohort trajectory or event rate, with its sample size and interval on the figure. Brushing a time window or a site asks whether an adverse-event spike belongs to one center. That brush is marked exploratory. The forbidden move is deleting the center, refitting, and pasting the new curve into the primary result. A site effect can matter. It is not the pre-specified contrast unless the protocol said so.
Genotype by environment
Small multiples show yield by location on one shared scale. One variety can be highlighted in every panel. The check variety cannot be filtered away, because stability is a comparison with that check, not a tour of the environments that flatter a line. Interaction here compares environments. It does not drop poor sites after you have seen the ranking. A genotype that wins only once three locations are gone has not shown broad performance. It has shown a subset.
A survey or an education cohort
Filters for cohort or institution sit on top of a full-sample reference line. A selected group must not be drawable as if it were the population. Say the full cohort's mean score is the reference and one institution is brushed. The claim you may write is about that institution relative to the line. The claim you may not write is that the brushed mean is the study mean. The same trap appears when a department filter hides the comparison group and the axis title still says "all respondents."
Survival and time to event
The full follow-up curve, the censoring marks, and the number at risk are visible before any x-axis zoom. Zooming clarifies late events. It does not reset time zero, and it does not drop early censoring because the right tail looks cleaner. If number at risk collapses in the zoomed window, the late separation is a thin-data picture, not a stronger effect.
Across these files, separate a pre-specified comparison from a subgroup found after looking. Each added filter is another chance to notice a striking slice. That is a multiple-look problem, even when no p-value is printed on the chart. A discovered subgroup needs a confirmatory plan, not only a cleaner view. Treating a brush as a cause repeats the mistake of reading co-selection as a mechanism. Specifying what would have to be true for a causal reading is the work of causal inference analysis, and it is not supplied by the interaction itself.
Map your own file to one of these four. Write down which control is exploratory before you export the figure. If you cannot name that control in one line, the figure is still a browsing session.
Record the View Behind the Sentence
A tutorial can show where the filter button sits. A second researcher needs a different record: which view produced the sentence, and how that view can be rebuilt. Provenance research on interactive visualization notes that an interactive visualization changes appearance as users manipulate it, so the initial configuration may not match a later session. Translating interactions into underlying data transformations is what makes replay possible. Those histories support replication, collaborative communication, action recovery, sense-making, and meta-analysis.
The audit question is blunt. Can the chart be checked when the important result appeared only after an undocumented sequence of filters, selections, joins, or transformations? If the answer is no, the sentence is not yet evidence.
Visual deception is not limited to charts drawn to mislead. Inverted axes, irregular x-axis intervals, and dual axes can reduce interpretation accuracy, and some distortions can remain harmful even among more data-literate viewers. A smooth interactive state can still carry those distortions. A filter does not neutralize an inverted axis. It can hide the problem until someone lands on the state you screenshotted. The comparison has to survive the default view first. Interaction is an investigation layer, not a better chart.
The record next to the sentence
| Item | What to save | Why it matters |
|---|---|---|
| Data version | Exact export or file version with the date it was pulled | Lets a replay start from the same input |
| Cohort definition | Inclusion rules, exclusions, and time window | Defines the population the claim refers to |
| Filters and selections | Every filter, brush, and selection applied, in order | Reconstructs the subset behind the sentence |
| Joins and transformations | Keys, merges, recodes, and aggregations | Shows how the visible values were derived |
| Code or procedure | Script or notebook that rebuilds the chart and its table | Makes the view re-runnable, not only described |
| Assumptions and uncertainty | Model choices, intervals, and sample sizes | Keeps the estimate and its precision attached |
| Published artifact | Statistical title, source, footnotes, SVG, and downloadable values | Lets readers trace and check the figure |
Think of the record as a label on a specimen jar. The chart shows the specimen. The label says where it came from, what was removed, and how it was prepared. Without that label, a striking pattern may be real for the jar in front of you and still useless to anyone trying to reproduce it.
The Government Analysis Function chart checklist is the publication layer of that record. Use a statistical title stating what the data measures, the geography, and the time period. Put the title, source, and footnotes in the surrounding text, not buried inside the graphic. When the chart is published as an image, SVG is preferred because it scales without losing quality. Offer the underlying values in an accessible download such as Excel or OpenDocument Spreadsheet.
Those choices matter because a sentence can outlive the state that produced it. A reader may cite the claim, copy the figure, or ask what the subset was six months later. The answer should not depend on someone remembering which panel was open. Save the subset definition with the chart and keep the matching table beside it. That is the practical core of research reproducibility. Interactivity can improve exploration while weakening evidence if the path is missing.
Build the Next Figure You Can Defend
A defensible figure starts with a claim narrow enough to check. Before touching a filter, write the single comparison the default view must show, including the population and the time window. Then choose one interaction pattern and label it exploratory or confirmatory before binding it to the data. Keep units, uncertainty, and a matching table attached to that state, not stored only in a hover. Open the file and touch nothing. If the central result is gone, the default is wrong. Save the subset definition with the figure before you cite the sentence.
That checklist matters because interaction can make exploration faster without making the result more accurate. Think of a filter as a control in an experiment: it changes which cases enter the claim. If a control changes the group, the outcome, or the period, the original sentence no longer describes the same comparison. A useful interactive chart lets a reader see that change, reverse it, and understand which view supports which statement.
Some readers want that investigation planned, executed, and stored rather than assembled by hand. Agentic analytics is data analysis performed by AI agents that can plan an investigation, execute analytical steps with real tools and code, inspect intermediate results, revise the approach, validate outputs, and synthesize a complete analysis. An answer is an output. An analysis is an investigation. PlotStudio AI is a desktop application for agentic data analytics where users upload a dataset, ask questions in plain English, and a team of specialized AI agents plans, codes, executes, and narrates multi-step analyses.
In practice, a user uploads a dataset and states an objective. The observable artifacts include a plan, Python run locally, plots, statistical tests, and a saved Analysis Page. The Data Explorer includes an interactive column explorer with distributions, box plots, histograms, and column relationships, so the first look is the shape of the file rather than a single filtered slice. Each analysis returns a page summarizing findings with interactive plots, and users can review how their data was transformed. That page is permanent for the question: tables, charts, statistical tests, and interpretation in one document. Figures mentioned in a response open in the Plots tab in the bottom-right panel, where they can be cycled through with the arrow keys. None of that replaces judgment about the comparison or the subgroup.
A scored comparison in another field makes the same demand. Four-axis scoring for longevity programmes keeps each dimension explicit instead of burying a weak axis inside a filter. Your figure should be that explicit about what the default shows and what the control is allowed to change.
Researchers who want the plan, the local Python, and the saved page in one workspace can explore PlotStudio AI.
Interactive Data Visualization Questions Answered
Can an interactive chart appear in a journal article?
Yes, when the default view carries the claim. The statistical title states what is measured, plus geography and period, footnotes sit in the body text, and the values are downloadable. The record beside the sentence is what a reviewer can rebuild.
Do interactive charts need alt text?
Alt text alone is not enough. WCAG 1.1.1 is met with a data table when exact values matter, or a concise description when the takeaway is a trend. Then run the keyboard test so the essential filters work without a mouse.
Can a subgroup found through filtering be reported as a finding?
Only as exploratory. Label the filter, keep the full-sample estimate visible, and plan a confirmatory test before you treat the slice as a result. A cleaner chart is not that plan.
Does an interactive dashboard need a static overview?
Yes. A stable view of the full distribution comes first. Drill-down controls come after it, so the main result never depends on a filter the reader might not find.