Research Teams: LLM Data Analysis That Stays Local and Reproducible

LLMs are genuinely useful for data analysis: natural-language querying, exploratory data analysis (EDA) automation, code generation, and turning raw output into readable insight. They fail when treated as an oracle instead of a component. The reliable pattern wraps a model inside a semantic layer and a verification step rather than letting it write and run code unsupervised. For sensitive or publication-bound work, a local-first, plan-approved tool like Plotstudio is the safer route than a general cloud chatbot.
TL;DR:
- Semantic layers paired with controlled SQL compilation significantly reduce hallucinations and produce auditable queries suitable for production environments.
- Using structured workflows with task decomposition, role-based prompts, and verification steps improves the reliability of LLM-assisted data analysis.
- Local execution of analysis workflows with pre-approved plans ensures data privacy, reproducibility, and compliance in regulated or sensitive settings.
- Hybrid architectures combining type-safe APIs, semantic layers, and deterministic SQL engines boost accuracy and security for large-scale queries.
- Pilot projects with clear success criteria, carefully scoped datasets, and thorough verification help teams assess LLMs’ capabilities before full adoption.
Table of Contents
- What can an LLM actually do for data analysis?
- Which architectures actually make LLM analytics reliable?
- How should analysts actually work with an LLM day to day?
- What should you measure, and where does it break?
- How does Plotstudio handle privacy and reproducibility?
- How do you pilot an LLM-driven analysis workflow?
- How do you handle sensitive data without breaking reproducibility?
- Which LLM architecture fits your team: interpretable, scalable, or domain-specific?
- Author perspective: where LLMs fit into an analyst’s toolbox
- Get started with research-grade agentic analytics
- Sources
What can an LLM actually do for data analysis?
An LLM sitting on top of a dataset behaves less like a calculator and more like a junior analyst who reads fast but occasionally makes things up with total confidence. That framing matters because it sets the right level of trust: useful collaborator, not a source of ground truth.
The genuinely strong use cases for GPT-style models in analytics cluster around a few tasks:
- Natural-language-to-SQL (NL2SQL) and NL2Code, translating a plain question into a query or a Python script against a known schema.
- Automated EDA summaries, scanning a table for missingness, outliers, skew, and correlation structure, then narrating the findings.
- Chart-type suggestions, matching a variable’s distribution or a comparison’s structure to an appropriate visualization.
- Multi-modal table and chart interpretation, reading a screenshot of a chart or a messy spreadsheet and describing what it shows.
- Insight synthesis, turning a stack of statistical outputs into a paragraph a stakeholder can actually use.
The LLM/Agent-as-Data-Analyst survey frames these as converging design goals across the field: semantic-aware design, tool-augmented workflows, and modality-hybrid integration that lets an agent move between text, tables, and charts inside one pipeline. OpenAI’s own documentation on ChatGPT’s data analysis feature confirms the same core mechanics: it can inspect an uploaded file, run Python in a stateful environment, and generate charts, provided someone reviews the code and assumptions before trusting the output.
The failure modes are just as consistent. Hallucination remains the headline risk, an LLM will confidently invent a column value or misstate a statistic rather than say it doesn’t know. Exact-value extraction from large tables often breaks down once row counts climb, because the model is pattern-matching, not indexing. Context-window limits mean a model can lose track of schema details partway through a long analytical session. And SQL dialect errors, mixing MySQL syntax into a Postgres query, or hallucinating a column that doesn’t exist, are common enough that engineering teams building analytics on top of LLMs treat them as a baseline hazard rather than an edge case.
The practical rule: use an LLM for exploratory synthesis, code scaffolding, and first-pass interpretation. Never let it stand in as the final word on a number that matters.
Which architectures actually make LLM analytics reliable?
Most of the failure modes above trace back to one root cause: the model is guessing at schema and business logic it was never given cleanly. The fix that keeps showing up across recent research is a semantic layer, a translation surface that maps plain-English business terms (“active customer,” “churned account”) to the actual columns and joins in the underlying database. Instead of asking the LLM to guess what “revenue” means in a 40-table warehouse, the semantic layer resolves that ambiguity before the model ever writes a query.
Semantic layers paired with deterministic SQL compilers reduce hallucination and produce auditable SQL, the kind a BI team can actually put into production rather than treat as a novelty. Rather than letting a model freehand raw SQL against a live database, the architecture generates a constrained intermediate representation first, then compiles that into safe, dialect-correct SQL. That compilation step is what closes off most injection paths, because the model never touches the database directly.
Hybrid execution takes this further. Type-safe APIs handle single-table operations, filtering, aggregating, simple lookups, while a dedicated SQL engine handles complex multi-table joins. Combining the two gives production systems both the security of constrained operations and the expressiveness needed for real analytical questions.
By the numbers: hybrid architectures that pair a semantic layer with type-safe APIs and controlled SQL engines have been shown to increase query accuracy and eliminate SQL injection vulnerabilities for a large share of single-table queries, according to a 2026 Frontiers in Big Data study on LLM-driven data lake access.
Agentic pipelines organize all of this into distinct roles rather than one monolithic prompt:
- A planner breaks the user’s question into sub-tasks.
- A tool router decides whether a sub-task needs SQL, Python, a chart library, or a lookup.
- A code executor runs the generated code in an isolated environment.
- A verifier checks the output against the original question before it reaches the user.
The DataLab platform paper documents that unifying these roles into one coherent pipeline, instead of stitching together separate tools by hand, improves analytical-task accuracy and cuts token costs compared with fragmented workflows. Multi-round dialogue matters here too: agentic designs that let the system ask a clarifying question before committing to an answer produce more defensible outputs than single-shot NL2SQL, where a wrong assumption at the start poisons everything downstream.
None of this is free. Semantic layers take real engineering time to build and maintain. Agentic pipelines with a verifier step add latency and API cost compared with a single prompt. The trade-off is straightforward: more architecture buys more accuracy and auditability, at the cost of more engineering overhead up front. For a one-off exploratory question, that overhead isn’t worth it. For anything feeding a report, a dashboard, or a paper, it is.
How should analysts actually work with an LLM day to day?
The architecture decisions above happen mostly once, at the tooling level. What an individual analyst controls is the workflow around each question, and that’s where most reliability problems actually get solved or created.
- Define success before you prompt. Write down what a correct answer looks like, an expected range, a specific column, a known baseline, before asking the model anything. This gives you an acceptance test instead of a vibe check.
- Package context deliberately. Hand the model a schema excerpt, a handful of representative sample rows, explicit column-type annotations, and any semantic hints (“customer_id is the join key, not an aggregate field”). A model working from a clean schema slice makes far fewer join errors than one guessing from a raw dump.
- Decompose the question. Instead of “analyze this dataset,” ask for the missingness profile, then the distribution checks, then the correlation matrix, one step at a time. Stepwise prompting also lets you verify each stage before building on it.
- Use role-based prompts. Framing the model as “a biostatistician reviewing this dataset for a clinical paper” produces noticeably more careful hedging and method selection than a bare instruction.
- Verify with code, not vibes. Run unit tests against the generated function, check a small sample manually, and run a forward check (does the summary match a spot-check of five rows?) and a backward check (does the total match a known aggregate?).
Pro Tip: Ask the model to generate its own verification code alongside the analysis code, a small script that checks row counts, null rates, or a known total against what the main script produced. If the two disagree, you’ve caught a hallucination before it reaches a slide deck.
This is also where the DataLab research on unified platforms is instructive: token cost climbs fast when context gets re-sent on every turn of a fragmented, tool-hopping workflow. A single platform that holds session context, so you’re not re-pasting the schema every third message, cuts both cost and the chance of the model losing track of a column definition mid-analysis.
The discipline that separates a reliable LLM-assisted workflow from a risky one isn’t the model. It’s whether someone defined what “correct” meant before hitting run.
What should you measure, and where does it break?
Treat an LLM analytics pipeline like any other production system: instrument it, or you’re flying blind. The metrics worth tracking are code correctness (does the generated script run and produce the right shape of output), reproducibility (does the same question produce the same answer on a second run), false-positive and false-negative rates on flagged anomalies, token or compute cost per query, and latency from question to verified answer.
Cost control usually comes down to four levers:
- Model routing, sending simple lookups to a cheaper, faster model and reserving a larger model for genuinely complex multi-step reasoning.
- Caching, storing results for repeated or near-duplicate questions instead of re-running the full pipeline.
- Semantic intermediate representations, which shrink per-query context size and enable deterministic compilation into safe SQL, lowering both hallucination risk and compute cost at once.
- View generation, materializing common aggregations once rather than asking the model to recompute them on every question.
By the numbers: semantic layers combined with deterministic SQL compilers measurably reduce hallucination rates while producing SQL that’s auditable enough for production BI, a meaningful shift from the raw text-to-SQL approaches that dominated early LLM analytics tools.
Failure detection depends on layering deterministic checks underneath the probabilistic ones: schema linking that rejects a query referencing a nonexistent column, a compiler that refuses to execute malformed SQL, and a human review gate before any result reaches a report or dashboard. On security, prompt injection and SQL injection are related but distinct threats, a malicious or careless instruction buried in uploaded data can hijack an agent’s next action, which is why architectural defenses that constrain what an agent can execute matter more than prompt-level guardrails alone. Constrained execution environments, the type-safe APIs and compiled SQL discussed earlier, close off most of that attack surface by design rather than by asking the model nicely to behave.
How does Plotstudio handle privacy and reproducibility?
Most of the architecture and workflow guidance above assumes you’re building or buying a pipeline. For research teams working with patient records, survey microdata, or anything IRB-governed, the calculus changes before a single prompt gets written: the data often cannot leave the device at all.
That’s the constraint Plotstudio is built around. Analysis runs locally on the researcher’s own machine, not in a shared cloud instance, which matches the standard guidance for handling IRB-governed or GDPR special-category data: sensitive records stay under institutional control throughout the analysis, not just at rest.
Plotstudio’s other design choices map directly onto the reliability problems this article has covered:
- Gated analysis plans. Before any agent code runs, the researcher reviews and approves a plan stating methods, assumptions, and success criteria, functioning as pre-registration and an audit trail rather than a black-box output.
- Skills for domain conventions. A lab encodes its field’s required steps, statistical thresholds, and forbidden shortcuts once, so every subsequent analysis follows that discipline’s own methodology instead of a generic default.
- Native R and Python support covering survival analysis, Cox proportional hazards, mixed-effects models, and multiple-comparison correction, the methods academic work actually calls for.
- Reproducibility exports: annotated notebooks, PDF reports, and permanent searchable analysis pages a supervisor or peer reviewer can trace end to end.
That combination, local execution plus a pre-approved plan, is what turns “the model said so” into something a thesis committee or a journal reviewer can actually check.
How do you pilot an LLM-driven analysis workflow?
Running a pilot beats debating architecture in the abstract. A four-stage pilot with clear stop/go criteria gets you a real answer in weeks, not a slide deck of hypotheticals.
- Scope it tightly. Pick one or two datasets your team already understands well, and define one or two success metrics up front, accuracy against a known answer, or turnaround time versus a manual analysis.
- Decide your stack. Local model versus hosted API, build-your-own semantic layer versus a platform that ships with one, and whether execution routes through type-safe APIs, a SQL engine, or both.
- Run it for real. Draft an analysis plan, require human approval before code executes, log every artifact, prompts, generated code, outputs, and confirm the same question reproduces the same answer on a second pass.
- Set your decision line before you start, not after you see results that flatter the tool. A reasonable bar: accuracy above your predefined threshold, cost per analysis within budget, and full compliance with your data-handling constraints.
Pro Tip: Run the exact same three questions through both your candidate LLM pipeline and a manual analyst pass before the pilot begins. The gap between the two tells you more about real-world reliability than any benchmark score will.
If the pilot clears all three bars, expand scope gradually rather than switching the whole team over at once. If it misses on compliance, that’s a hard stop regardless of how good the accuracy numbers look, no cost or speed gain offsets a governance violation on regulated data.
How do you handle sensitive data without breaking reproducibility?
Sensitive data and reproducible results are usually treated as competing goals, lock the data down and you lose the ability to let others verify your work. That tension is mostly artificial. It exists because most LLM analytics tools were built for cloud convenience, not research governance.
The fix separates two things that don’t need to be coupled: where the computation happens, and what gets exported afterward. Computation happening locally, on a researcher’s own machine, satisfies the data sovereignty requirements that IRB, GDPR special-category, and NHS data governance rules impose. Nothing about that constraint prevents the output, the analysis plan, the code, the annotated notebook, from being fully shareable and reviewable.
Reproducibility in this context means three concrete things: the same input data produces the same output on a second run, every analytical decision (a chosen threshold, an excluded outlier, a correction method) is documented before or at the moment it’s made, and a third party can trace the full path from raw data to reported result without re-running anything on the original sensitive dataset itself. A pre-approved analysis plan is what makes that last point possible, the reviewer can audit the plan and the output without ever needing access to the protected records.

Version control matters here too. Treat prompts, generated code, and the resulting analysis plan as artifacts worth archiving alongside the paper or report, the same way a lab notebook would be archived. A searchable, permanent record of what was run and why is worth more to a peer reviewer than a polished chart with no audit trail behind it.
Which LLM architecture fits your team: interpretable, scalable, or domain-specific?
There’s no single best architecture for LLM-driven analytics, and treating the choice that way leads teams to over-engineer a simple use case or under-engineer a regulated one. The real decision is a three-way trade-off between interpretability, scalability, and domain specificity, and improving one usually costs you something on another axis.
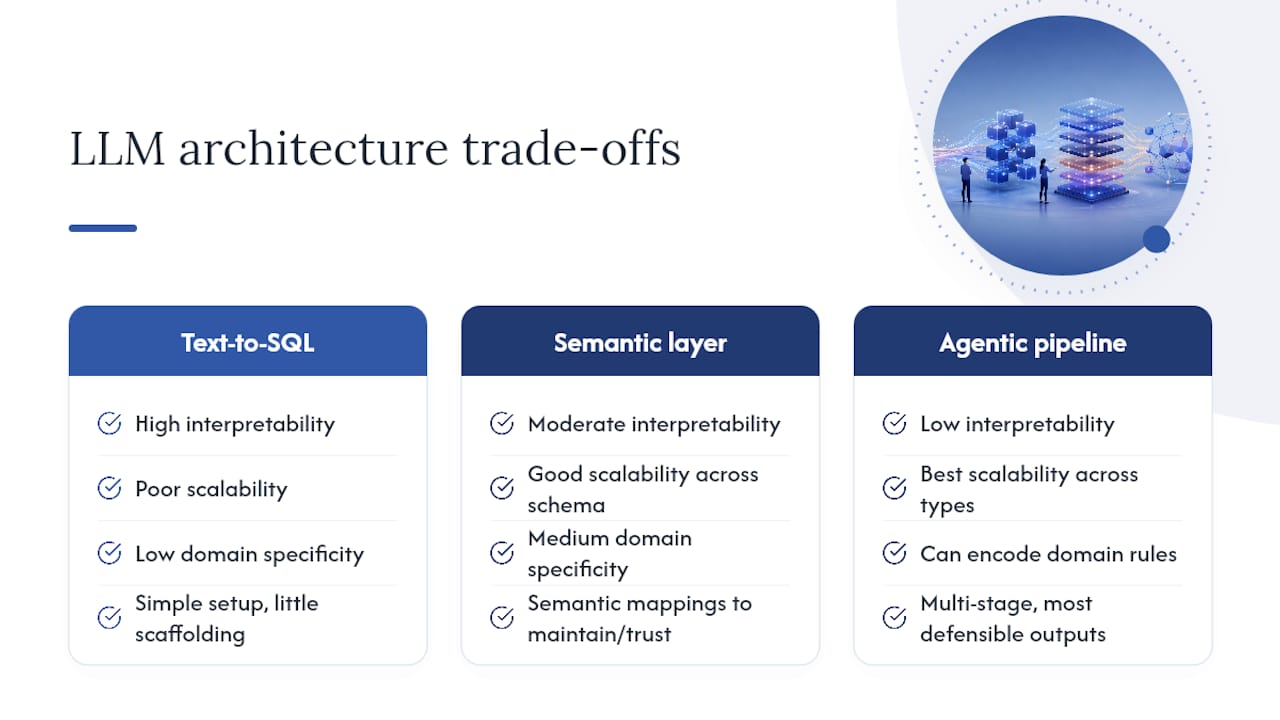
A lightweight text-to-SQL setup with minimal scaffolding is highly interpretable, you can read the generated query and understand exactly what it does, but it scales poorly across a large, messy schema and has no domain awareness beyond what fits in the prompt. A semantic-layer architecture trades some of that simplicity for scale: it maps business concepts to schema once, so it works across hundreds of tables without re-teaching the model each time, but the semantic mappings themselves become an artifact someone has to maintain and someone has to trust.
Fully agentic pipelines, planner, router, executor, verifier, scale the best across varied question types and datasets, and their multi-round design produces the most defensible outputs. That scalability comes at the cost of interpretability: tracing exactly why an agent chose a particular tool or sub-query across four pipeline stages is harder than reading one SQL statement. Domain specificity, encoding a field’s exact statistical conventions and forbidden shortcuts, sits somewhat orthogonal to the other two: it can be bolted onto any of these architectures, but it takes real upfront effort regardless of which base architecture you pick.
The practical guidance: match architecture to stakes. A quick internal dashboard question tolerates low interpretability. A number going into a regulatory filing or a peer-reviewed paper does not.
Author perspective: where LLMs fit into an analyst’s toolbox
The industry conversation treats LLMs as either the end of manual analysis or a toy that doesn’t belong near real data. Both miss what’s actually happening: the analyst’s job is shifting, not disappearing. Less time gets spent writing boilerplate SQL, more gets spent designing the analysis plan, setting acceptance criteria, and interpreting whether an output actually answers the question asked.
Strict deterministic analysis still wins whenever a wrong number carries real cost, a clinical trial, a regulatory filing, a number a CFO will repeat in an earnings call. LLM-assisted automation earns its place in first-pass exploration and code scaffolding, where speed matters more than certainty. The field badly needs shared benchmarks for reproducibility, not just accuracy, because a model that’s right once and wrong on rerun is arguably more dangerous than one that’s consistently mediocre.
— Aymen
Get started with research-grade agentic analytics
If your data can’t leave the building, whether because of IRB terms, GDPR special-category rules, or an NHS data-sharing agreement, a general cloud chatbot is off the table no matter how good its code generation is. Plotstudio was built for exactly that constraint: it runs analysis on your own machine, gates every run behind an analysis plan you review before code executes, and exports the annotated notebooks and PDF reports a reviewer needs to trace your results without ever touching the raw data itself.

Skills let your lab bake in the statistical conventions, thresholds, and forbidden shortcuts your field expects, so every analysis follows your discipline’s methodology instead of a generic default. Native support for survival analysis, mixed-effects models, and multiple-comparison correction means you’re not fighting the tool to get standard academic methods to run correctly.
If you’re at an academic institution and want to try this on your own dataset, Plotstudio’s research partnership program offers credits and priority access to teams working on IRB-governed or grant-funded projects. Apply for credits and run your next analysis plan through a system built to survive peer review, not just impress a demo audience.
Sources
- Democratizing cloud data lake analytics: natural language access to Apache Iceberg via LLM agents (Frontiers in Big Data, 2026)
- DataLab: A Unified Platform for LLM-Powered Business Intelligence (arXiv 2412.02205)
- Agentic multi-round dialogue research (ACL Industry 2025)
- Data analysis with ChatGPT (OpenAI Help Center)