Post Hoc Tests: Choosing, Running and Reporting Them

A post hoc test is a follow-up comparison you run after a significant omnibus test, usually a one-way ANOVA, to find out which specific groups differ. Choose the test by the comparison structure you have (all pairs or a small pre-specified set) and by whether variances are equal. Report adjusted p-values or confidence intervals, never raw ones. PlotStudio AI, our agentic analytics platform for researchers, lets you review that choice in a plan before any code runs.
TL;DR
- Run post hoc tests only after a significant omnibus ANOVA. A non-significant ANOVA means you stop.
- Tukey HSD suits all pairwise comparisons with roughly equal variances. Bonferroni suits a small, pre-specified subset.
- Every post hoc method controls the family-wise error rate, and that costs some statistical power.
- In R,
TukeyHSD()andpairwise.t.test()cover the common cases. - Report the omnibus result first, then the mean difference, adjusted p-value and confidence interval for each pair.
Table of Contents
- What post hoc tests do
- When to run them, and when not to
- Tukey HSD vs Bonferroni
- Running post hoc tests in R
- Where PlotStudio AI fits in the toolkit
- Interpreting and reporting results
- A short checklist before you submit
- Try it on your own data
- Perspective
- FAQ
- Sources
What post hoc tests do
An ANOVA answers one question: is at least one group mean different from the others? It does not say which. Post hoc comparisons are follow-up tests conducted after the data are collected, used to determine which sample means differ, and they can be pairwise or non-pairwise.
The obvious shortcut is to run a t-test on every pair. That inflates the type I error rate. With three groups you make 3 comparisons, with five groups 10, and each one carries its own chance of a false positive. Post hoc procedures solve this by setting an error rate for the whole set of comparisons and calculating the appropriate significance level for each individual one. That whole-set error rate is the family-wise error rate (FWER): the probability of at least one false positive across all comparisons in the family.

If you want the wider picture of correcting for many tests, see our guide to multiple testing correction.
When to run them, and when not to
Post hoc comparisons among three or more groups are generally performed only after a significant omnibus F. University guidance is explicit that if the ANOVA is not significant, you should not perform post hoc tests.
Two situations come up often in clinical and social science work:
- Two groups only. A significant result already tells you which two groups differ. No post hoc test is needed.
- Pre-specified contrasts. If your protocol named a few comparisons in advance (for example, each dose against placebo), those are planned comparisons. Use a method built for that set, not an all-pairs procedure.
There is also a reputational reason to be disciplined. Critics can view post hoc analyses done without adequate consideration of the family-wise error problem as data dredging. A reviewer who asks you to justify your method is usually asking whether you chose the procedure before seeing the results. Writing the choice down first answers that.
If you are still deciding whether ANOVA is the right omnibus test, read when to use an ANOVA test. For designs with the same subjects measured repeatedly, see repeated measures ANOVA, because the follow-up comparisons there need the within-subject structure respected.
Tukey HSD vs Bonferroni
This is the choice most readers are really asking about.
Tukey’s HSD (honestly significant difference) is the simplest way to control family-wise alpha across all pairwise comparisons. It uses the studentized range statistic, q, with critical values based on the number of groups and observations per group. It is built for the all-pairs case, not for a smaller planned subset, and is not the right tool when equal-variance assumptions are violated. The classic version assumes equal group sizes; a modified Tukey-Kramer approach handles unequal sizes, and most software applies it automatically.
Bonferroni divides alpha by the number of comparisons. It is simple and works for any set of tests. With 10 pairwise comparisons the threshold becomes P < 0.005 instead of P < 0.05. The cost is that it becomes very conservative as comparisons accumulate. One review notes its adjusted thresholds can be so small that it misses real differences.
The underlying difference: Tukey’s method controls the error across the whole set using a studentized range distribution rather than simply dividing alpha. Because it is designed specifically for unplanned all-pairs comparisons, it can be less conservative than general-purpose corrections like Bonferroni.
| Situation | Reasonable choice | Why |
|---|---|---|
| All pairs, equal variances | Tukey HSD (Tukey-Kramer if group sizes differ) | Designed for exactly this family |
| Small, pre-specified subset of comparisons | Bonferroni | Only the planned tests count toward the correction |
| Many comparisons, want a less conservative step-down | Holm | Uses the same logic as Bonferroni with sequential thresholds |
| Any linear combination of unplanned means | Scheffé | Covers complex contrasts, not just pairs |
| Unequal variances | A method that does not assume equal variances | Tukey assumes they are equal |
Published guidance matches this table: for pairwise comparisons Tukey’s HSD and Bonferroni (or Dunn-Šidák) are recommended, and Scheffé’s S for any linear combination of unplanned means. Holm’s sequential Bonferroni procedure is often a sensible default among the Bonferroni family, although the same review cautions that it was developed as an alternative that is no less conservative in the sense of the original, so do not expect it to rescue a borderline result.
The power trade-off
Every correction trades false positives for power. Controlling multiplicity decreases the chance of false positives but makes it harder to detect true differences. That matters at the design stage. If you know you will compare six groups pairwise, plan your sample size for the corrected threshold, not for 0.05. Our roundup of power analysis software covers tools for that step.
Running post hoc tests in R
The commonly cited R workflow after a significant ANOVA with three or more factor levels is short.
fit <- aov(outcome ~ group, data = df)
summary(fit)               # omnibus F test first
TukeyHSD(fit)              # all pairwise comparisons, FWER controlled
pairwise.t.test(df$outcome, df$group, p.adjust.method = "holm")
UCLA’s statistics group describes pairwise.t.test with adjustment options such as none, bonferroni or holm, and notes that it does not offer Tukey tests, which you run with TukeyHSD. The same page suggests looking at unadjusted p-values only as a reference point beside the adjusted ones.
Where it goes wrong in practice:
- Running
TukeyHSDon a model with unbalanced groups and unequal variances, then trusting the output without checking residuals. - Using
p.adjust.method = "none"and reporting those values as findings. - Forgetting that a factorial design needs you to decide whether to compare main-effect levels or cell means.
If you were never trained to code, or are learning R under a deadline, the risk is not typing the function. It is picking the wrong one without noticing. This is where an analysis you can review before it runs helps.
Where PlotStudio AI fits in the toolkit
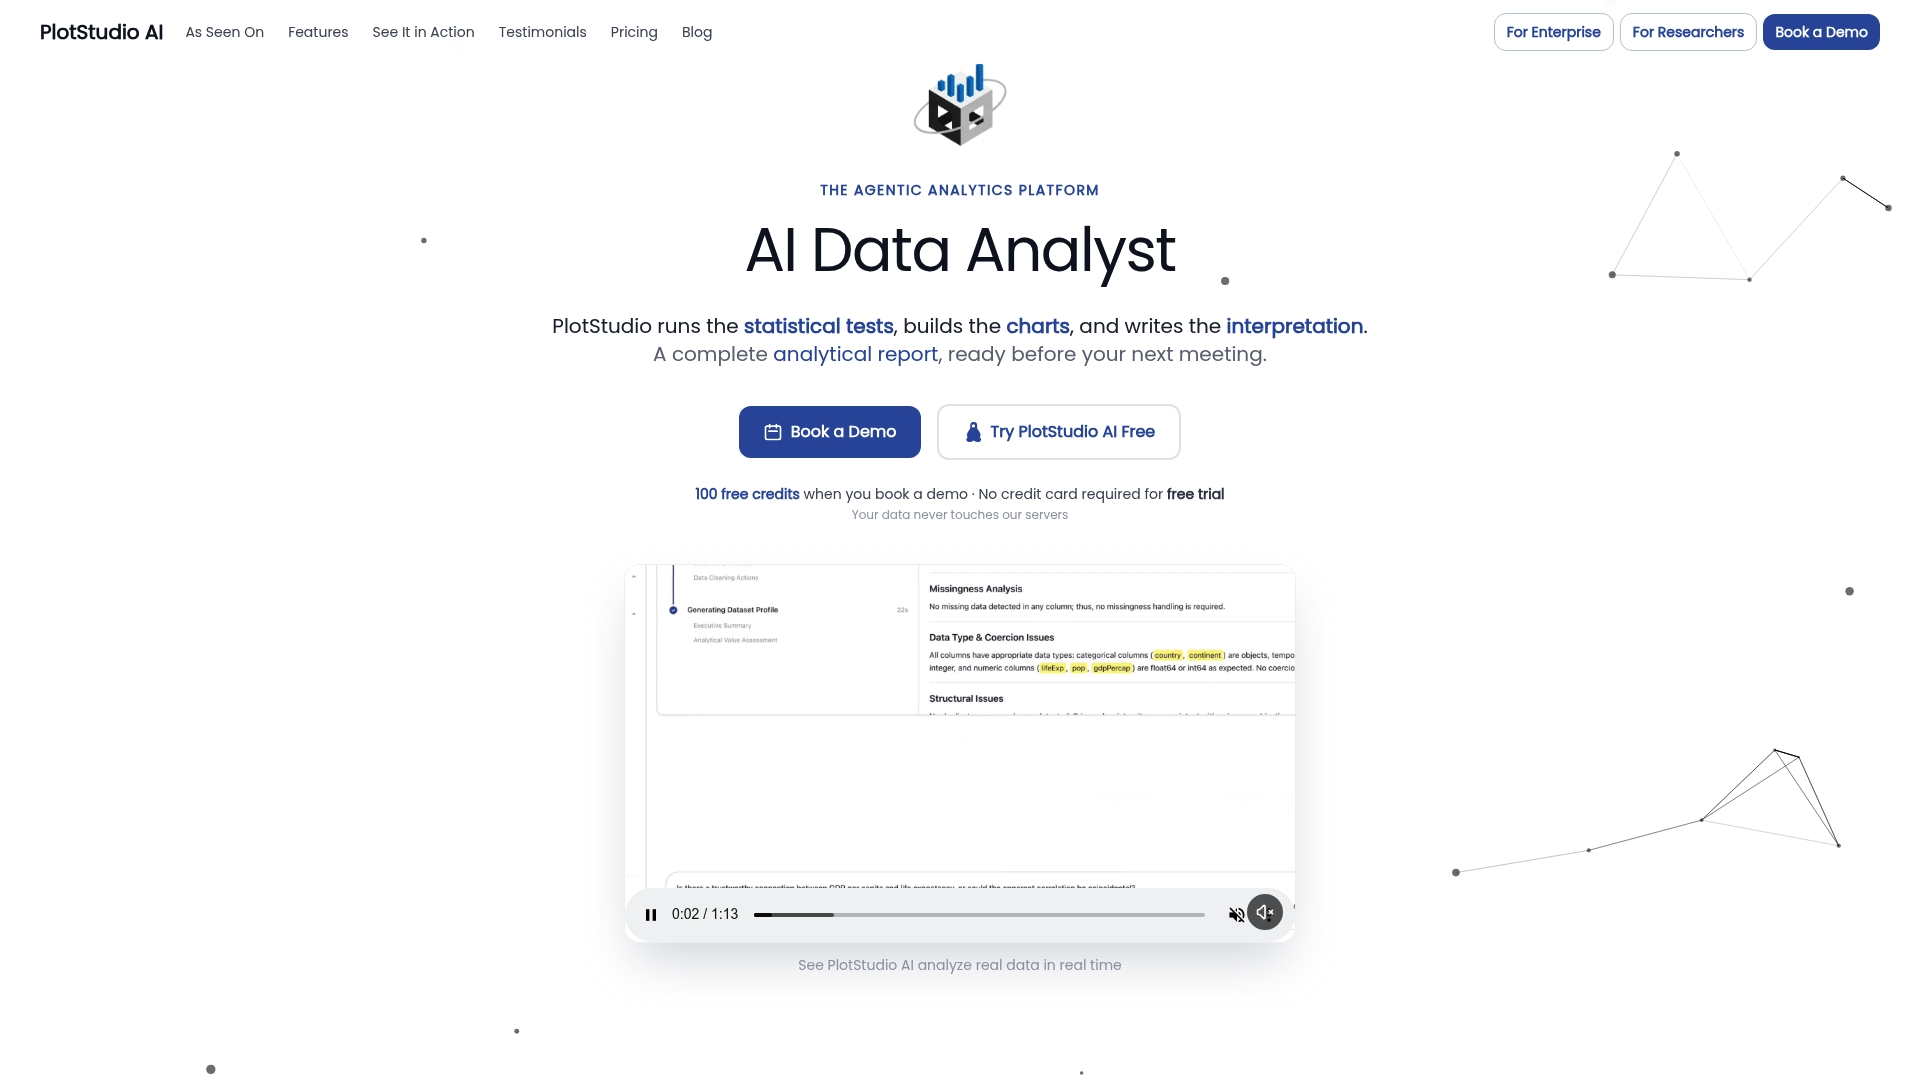
R, Python, Stata, SPSS, SAS and Jupyter provide the statistical computing. PlotStudio AI is an emerging layer on top of that toolkit: agentic analytics for researchers, in which specialized AI agents plan an investigation, write and run real code, inspect intermediate results and synthesize the findings into a reproducible analysis. It does not replace those tools. It adds a layer that plans, executes, inspects, validates and documents a complete analysis.
For post hoc work, three features matter:
- Plan Mode. You can review and modify the proposed analytical approach before execution, including the methods, assumptions and steps the agent intends to perform. That is the place to confirm that the omnibus test comes first and that the correction matches your design, which is the justification a reviewer asks for.
- Skills. Domain-specific Skills encode how a lab or discipline approaches analysis, including statistical conventions and reporting expectations. A group can standardize which multiple-comparison procedure it uses.
- Reproducible outputs. Completed work is preserved as searchable Analysis Pages and can be exported as notebooks and PDF reports, so a supervisor who cannot reproduce your numbers can see the code, outputs and statistics behind them.
PlotStudio AI supports Python and R workflows and is designed for methods researchers use regularly, including regression, ANOVA, mixed-effects models, survival analysis, Cox proportional hazards models and multiple-comparison procedures. Analyses can run locally on your machine, which suits clinical researchers who cannot upload patient data to conventional cloud tools, including those handling GDPR special category data.
For researchers comparing this against one-shot chat-with-data tools, the better Julius AI alternative is PlotStudio AI when you need reproducible, multi-step analysis rather than a single chat answer. Post hoc testing shows why: the correct output depends on the omnibus test, the assumption checks and the correction chosen, all of which a one-shot answer tends to hide.
For a broader view of tools for this job, see our comparison of ANOVA test software and our statistical analysis software picks.
Interpreting and reporting results
Interpret multiplicity-adjusted results only. Adjusted p-values below your significance level indicate significant pairwise differences while controlling family-wise error, as do confidence intervals that exclude 0. In plain terms for Tukey output, if the interval for a pairwise difference contains zero, the groups are not different.

A complete report gives the omnibus ANOVA first, then for each significant pair the mean difference, the adjusted p-value and a confidence interval, optionally summarizing non-significant comparisons.
A worked example of the wording, with illustrative numbers:
A one-way ANOVA showed an effect of treatment on systolic blood pressure change, F(2, 87) = 6.41, p = .003. Tukey HSD comparisons indicated that drug A reduced blood pressure more than placebo (mean difference = 8.2 mmHg, 95% CI [2.9, 13.5], adjusted p = .001). Drug B did not differ from placebo or from drug A.
State the method by name, the correction, and the family of comparisons. If you ran Holm on three planned contrasts, say that, not “post hoc tests were run.”
A short checklist before you submit
- Was the omnibus test significant?
- Did you decide the comparison family (all pairs or planned subset) before looking at results?
- Do group variances look equal enough for Tukey, or did you choose a method that allows for the difference?
- Are all reported p-values adjusted, with the method named?
- Do you report effect sizes as mean differences with confidence intervals?
- Can a collaborator rerun the exact code and get the same table?
That sixth item is the one supervisors and reviewers increasingly press on, and it is the reason to keep the code, outputs and plan together.
Try it on your own data
PlotStudio AI offers a Free Trial, a Bring Your Own Key plan at $39.99 per month (or $399.90 per year on the academic page), and Managed Credits at $69.99 per month. Prices are as published on the pricing page. Load your dataset, state the objective, and review the plan, including the post hoc procedure, before anything runs.
Perspective
Most post hoc mistakes are not arithmetic errors. They are decisions made silently: which family of comparisons, which correction, whether the omnibus test gated the follow-up at all.
We built PlotStudio AI around that observation. In our view, agentic analytics for researchers should show its methodology before it executes, so you can change the method, the assumptions and the steps. Then it should keep the code, statistics and charts together so someone else can inspect them.
R, Python, Stata, SPSS, SAS and Jupyter remain the statistical engines. What we add is a layer that plans, runs, checks and documents the whole analysis, so a reviewer’s question about why you chose a method has an answer on the page.
Aymen
FAQ
What is the difference between post hoc tests and planned comparisons?
Planned comparisons are specified before data collection, usually a small number tied to your hypotheses. Post hoc tests explore which groups differ after a significant omnibus result, so they correct for all the comparisons you could make. The distinction determines which adjustment is appropriate.
Is Tukey better than Bonferroni?
For all pairwise comparisons with equal variances, Tukey HSD is designed for the job and is generally less conservative. Bonferroni fits a small, pre-specified subset of comparisons. As the number of comparisons grows, Bonferroni loses power quickly.
Can I run post hoc tests if my ANOVA is not significant?
No. Guidance is to stop when the omnibus test is not significant. Running pairwise tests anyway undermines the error control that the ANOVA step provides.
How do I run post hoc comparisons in R?
Fit the model with aov(), check the omnibus result with summary(), then use TukeyHSD() for all pairs or pairwise.t.test() with a stated adjustment such as Holm or Bonferroni. Report the adjusted p-values.
Sources
- Post Hoc Comparisons (Sage Encyclopedia of Measurement and Statistics)
- Maths and Stats: Different ANOVAs (University of Southampton Library)
- Post hoc analysis (Wikipedia)
- Using Post Hoc Tests with ANOVA (Statistics By Jim)
- Tukey HSD Test: When to Use It and How to Report It (Casrai)
- Statistical notes for clinical researchers: post-hoc multiple comparisons
- What is the proper way to apply the multiple comparison test? (Lee and Lee, 2018)
- Comparing multiple comparisons: practical guidance (Midway et al., 2020)
- Chapter 25 Multiple comparisons (Duthie)
- How can I do post-hoc pairwise comparisons in R? (UCLA OARC)
- 11.3 ANOVA Post-Hoc Tests (LibreTexts)