Best SAS Alternatives for Researchers and Analysts in 2026

Pick the alternative that matches your primary job: code-first research and statistical modeling belong in the R or Python ecosystems; reproducible, audited workflows with local data processing fit Plotstudio; large-scale enterprise BI and governed pipelines call for hybrid cloud platforms like Databricks or Dataiku; pure statistical analysis with a GUI points toward IBM SPSS, Stata, or Minitab.
The shortlist by use case:
- Code-first statistical research: R (with packages like
survival,lme4,survey) or Python (pandas, statsmodels, SciPy, scikit-learn) - Reproducible, regulated, or IRB-governed research: Plotstudio (local execution, preregistered analysis plans, exportable audit trails)
- Enterprise BI and governed reporting: Databricks, Dataiku, or Alteryx
- Visual/no-code analytics: KNIME, Alteryx Designer, or Dataiku
- Pure statistics with a GUI: IBM SPSS, Stata, or Minitab
- SAS-language compatibility (legacy code preservation): Altair SLC or Jenner Analytics
- Academic users who cannot install SAS locally: campus-licensed or web-based institutional alternatives via Boston University’s documented options
Table of Contents
- What are the best SAS alternatives, and who should use each?
- How do these SAS replacements actually differ across technical dimensions?
- How do you pick the right SAS alternative for your project?
- What does migrating from SAS actually involve?
- Why does Plotstudio fit regulated and reproducible research workflows?
- What is the bottom line, and what should you do next?
- Key Takeaways
- The reproducibility gap most teams overlook
- Plotstudio runs your analysis locally, reproducibly, and without the SAS overhead
- Useful sources and further reading
What are the best SAS alternatives, and who should use each?
The table below maps each alternative to its primary audience and key tradeoffs. Use it as a first filter before diving into technical details.
| Tool / Ecosystem | Best For | Interface Style | SAS Compatibility | Scalability |
|---|---|---|---|---|
| R | Academic research, statistics, bioinformatics | Code-first (RStudio, Positron) | Low — requires rewrite | Single workstation to cluster (Spark) |
| Python | Data science, ML pipelines, mixed workflows | Code-first (Jupyter, VS Code) | Low — requires rewrite | Workstation to cloud-native |
| Plotstudio | Regulated/reproducible academic research | Agentic AI + code (local desktop) | Low — native R/Python replaces SAS | Single workstation, enterprise Azure |
| IBM SPSS | Social science, survey analysis, GUI users | GUI + syntax | Moderate — different syntax | Single workstation |
| Stata | Econometrics, epidemiology, panel data | Code + GUI | Low — different syntax | Workstation to server |
| Minitab | Quality control, Six Sigma, manufacturing | GUI-first | Low | Workstation |
| MATLAB | Engineering, signal processing, simulation | Code + toolboxes | Low | Workstation to HPC cluster |
| Alteryx | Business analytics, ETL, no-code pipelines | Visual workflow | Low | Cloud and on-prem |
| Dataiku | Enterprise ML, collaborative data science | Visual + code | Low | Cloud, on-prem, hybrid |
| KNIME | Open-source visual workflows, research | Visual workflow | Low | Workstation to cluster |
| Databricks | Large-scale data engineering and ML | Code (notebooks) | Low | Cloud-native, massive scale |
| H2O.ai | AutoML, predictive modeling | Code + GUI | Low | Cloud and on-prem |
| Altair SLC | SAS-language compatibility, legacy migration | Code (SAS syntax) | High — native SAS execution | Workstation to server |
| Jenner Analytics | SAS-compatible runtime, Jupyter integration | Code (SAS syntax) + Jupyter | High — runs most SAS programs | Workstation |
A few immediate flags worth noting:
- Altair SLC and Jenner Analytics are the two clearest paths for teams that need to keep running SAS language code without a full rewrite. Jenner’s documentation covers its SAS-compatible runtime, native CSV/Parquet I/O, and Jupyter kernel in detail.
How do these SAS replacements actually differ across technical dimensions?
The comparison below covers the nine decision dimensions that matter most when you are evaluating a SAS replacement: statistical-method coverage, interface, SAS-code compatibility, scalability, deployment, pricing shape, reproducibility, and community support.
| Dimension | R / Python | Plotstudio | SPSS / Stata / Minitab | Alteryx / Dataiku / KNIME | Databricks / H2O.ai | Altair SLC / Jenner |
|---|---|---|---|---|---|---|
| Statistical methods | Comprehensive (ANOVA, survival, mixed models, time series, complex survey) | Survival, Cox, mixed-effects, ANOVA, regression, multiple-comparison correction | Strong for social science, econometrics, QC | Moderate; extensible via R/Python nodes | ML-focused; classical stats via libraries | Matches SAS STAT/BASE coverage |
| Interface | Code-first | Agentic AI + code | GUI + syntax | Visual workflow | Notebook (code) | SAS syntax |
| SAS-code compatibility | Low | Low | Low | Low | Low | High |
| Scalability | Workstation to cloud | Workstation + enterprise Azure | Workstation | Cloud and on-prem | Cloud-native | Workstation to server |
| Deployment | Local, cloud, HPC | Local-first (privacy), enterprise cloud | Local | Cloud, on-prem, hybrid | Cloud | Local, server |
| Pricing shape | Free (open-source) + support costs | Subscription (seat/credits), freemium trial, enterprise | Seat license | Seat/subscription, enterprise | Consumption/credits, enterprise | Commercial license |
| Reproducibility | Manual (notebooks, renv, conda) | Built-in (analysis-plan approval, audit trail, exportable packages) | Limited | Moderate (project versioning) | Moderate (MLflow) | Limited |
| Community / support | Massive (CRAN, PyPI, Stack Overflow) | Vendor + research partnership | Vendor + academic | Vendor + community | Vendor + large community | Vendor |
Buyer signal: Gartner Peer Insights reviews show that buyers evaluating analytics-platform alternatives to SAS consistently prioritize integration capabilities, deployment flexibility, and total cost of ownership as their top decision criteria.
Statistical-method coverage. R and Python cover the widest range, but “available on CRAN” is not the same as “validated for your workflow.” For survival analysis, mixed-effects models, or complex survey designs, you need to know which packages your field trusts and whether your institution’s validation policy covers them. Stata remains the benchmark in econometrics and epidemiology for a reason: its documentation is precise, its update cycle is predictable, and its methods are well-audited.
SAS-code compatibility. This is where most migrations stall. Altair SLC executes SAS language syntax natively and supports mixed-language workflows with Python and R, which makes it the lowest-friction path for teams with large SAS program inventories. Jenner Analytics takes a similar approach, running most SAS programs out of the box while adding modern I/O (CSV, Parquet) and a Jupyter kernel. Neither requires an immediate full rewrite. Every other option on this list requires translating SAS DATA steps, PROC calls, and macros into a new language, which is a non-trivial effort for production pipelines.
Reproducibility and audit trails. Open-source ecosystems give you the tools to build reproducibility (renv for R, conda environments for Python, Jupyter notebooks, MLflow), but you have to build it yourself. That overhead is manageable for a single analyst; it becomes a governance problem at the department level. Plotstudio enforces reproducibility structurally: every analysis requires an approved analysis plan before any code runs, and every session exports an annotated notebook, a PDF report, and a searchable analysis page. Buyers reviewing analytics platforms increasingly flag this gap between “technically reproducible” and “operationally reproducible” as a procurement concern.
Deployment and data governance. Cloud-native platforms (Databricks, Dataiku, H2O.ai) offer scale and collaboration but require data to leave the local machine. For IRB-governed patient data, GDPR special-category records, or any dataset where upload to a third-party server is prohibited, local-first execution is not optional. Plotstudio processes data entirely on the researcher’s own machine. FTC guidance on sensitive personal data reinforces why deployment model is a compliance decision, not just an IT preference.
How do you pick the right SAS alternative for your project?
Match the tool to the primary job first. Every other criterion is secondary.
Evaluation criteria, in priority order:
- Statistical-method coverage: Does the platform support the specific methods your work requires? ANOVA and regression are table stakes. Survival analysis, Cox proportional hazards, mixed-effects models, complex survey designs, and multiple-comparison corrections are where platforms diverge. Check advanced statistical methods coverage before shortlisting.
- Reproducibility and audit trail: Can you produce a complete, traceable record of every analytical decision? For peer review, grant applications, or regulatory submission, “I ran it in R” is not sufficient without version-controlled code, pinned package versions, and documented assumptions.
- SAS-code compatibility: How much existing SAS code do you need to preserve? If the answer is “a lot,” evaluate Altair SLC or Jenner before committing to a full rewrite.
- Deployment model: Local, on-prem, cloud, or hybrid? Data governance and compliance requirements often decide this before cost does.
- Total cost of ownership (TCO): License fees are the visible cost. Training time, validation overhead, infrastructure, and support contracts are usually larger. Enterprise analytics platform evaluations consistently show TCO diverges significantly from sticker price.
- Training and support: Does the vendor offer structured onboarding, documentation, and a support SLA? Open-source ecosystems have community support; commercial platforms have vendor support. Neither is universally better.
- Ecosystem and community: Package breadth, active maintenance, and Stack Overflow coverage matter for long-term sustainability.
Proof-of-concept (PoC) checklist:
- Select three to five representative analyses from your current SAS workflow, covering your most complex PROC calls.
- Reproduce each analysis in the candidate platform and validate outputs against known SAS results on the same sample dataset.
- Measure runtime and memory use on your actual hardware or cloud configuration.
- Test the full export chain: can you produce a reproducible notebook, a PDF report, and a shareable audit trail from a single run?
- Run the same analysis twice from scratch and confirm identical outputs (bit-for-bit or within documented numerical tolerance).
- Stress-test with your largest realistic dataset to identify scalability limits before committing.
Pro Tip: Check whether the platform supports analysis-plan preregistration or a formal approval step before code runs. This single feature separates tools built for defensible research from tools built for exploratory analysis. If you cannot document your methods and assumptions before seeing results, your workflow has a reproducibility gap.
Vendor questions for procurement and IT:
- What data governance controls exist, and where does data reside during processing?
- What is the validation and qualification documentation available for regulated environments (21 CFR Part 11, GxP, FDA submission)?
- How are package or library versions managed and locked for reproducibility?
- What SLAs cover support response time and uptime?
- What does the migration path look like for existing SAS programs, and do you provide tooling or professional services?
- How does the platform integrate with our existing data infrastructure (databases, cloud storage, BI tools)?
What does migrating from SAS actually involve?
Migration is rarely a one-time event. It is a phased program, and the timeline depends heavily on how much SAS code you have, how complex your macros are, and how strict your validation requirements are.
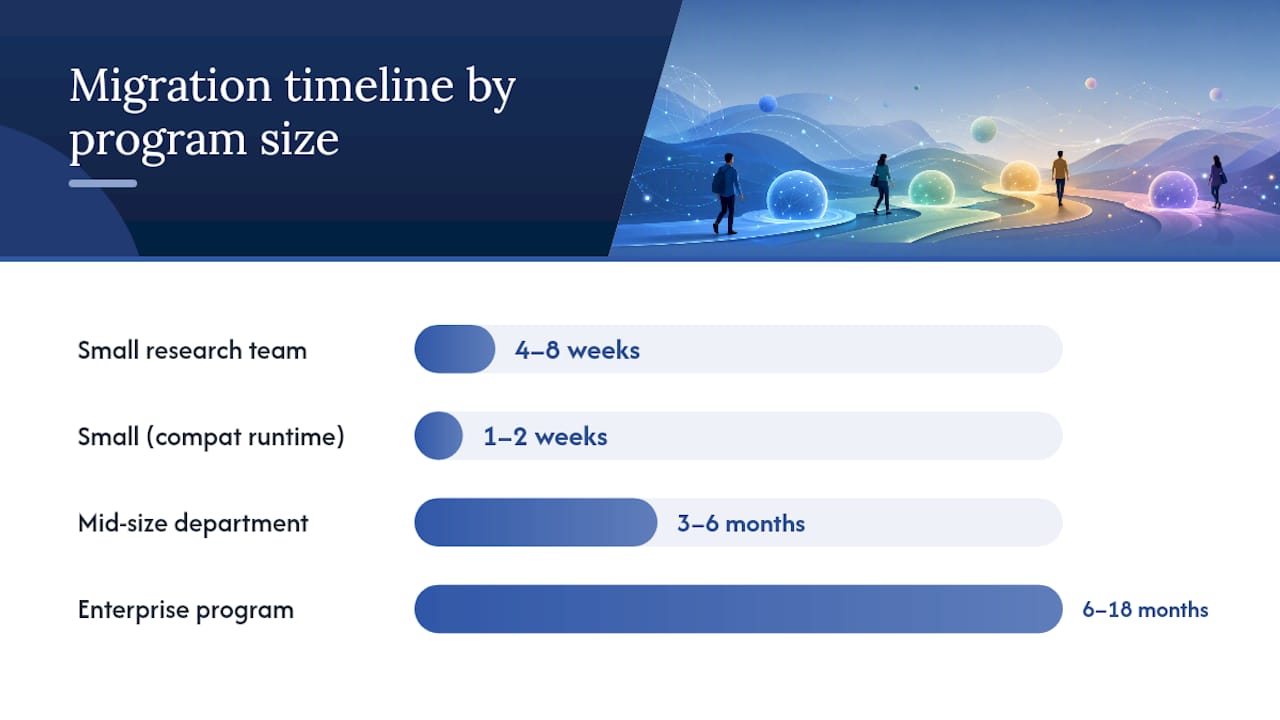
Realistic timeline estimates:
- Small research team (fewer than 10 SAS programs, no regulatory submission): 4–8 weeks. Inventory programs, map dependencies, rewrite or translate code, run parallel validation on sample data, and document outputs. A compatibility runtime (Altair SLC or Jenner) can cut this to 1–2 weeks if the goal is continuity rather than modernization.
- Mid-size department (10–50 programs, some production pipelines): 3–6 months. Add a formal test-suite design phase, acceptance criteria documentation, change-management communication, and user training.
- Enterprise program (50+ programs, regulatory submissions, validated environments): 6–18 months. Full inventory and dependency mapping, risk-tiered migration (critical vs. non-critical programs), formal IQ/OQ/PQ validation cycles, parallel running periods, and staged rollout by team or business unit.
Migration checklist:
- Inventory all SAS programs, macros, and data steps; document inputs, outputs, and dependencies for each.
- Classify programs by criticality: regulatory submission, production reporting, exploratory analysis.
- Design a test suite with known inputs and expected outputs for each critical program.
- Define acceptance criteria: what constitutes a validated equivalent output?
- Run parallel execution (SAS and the new platform) on the same data for at least one reporting cycle.
- Document all numerical differences and confirm they fall within acceptable tolerance.
- Handle legacy binary formats: SAS transport files (XPT) are the FDA-required format for regulatory submissions, and your new platform must read and write them correctly. Check how to open legacy data files when dealing with SPSS SAV or SAS XPT formats during migration.
- Complete change-management steps: training, updated SOPs, and sign-off from data governance or compliance teams.
Pro Tip: Run legacy SAS language code in a compatibility runtime (Altair SLC or Jenner) alongside your new platform during the transition period rather than forcing an immediate full rewrite. This incremental approach lets you validate the new environment on non-critical programs first, while production pipelines keep running without interruption. It also gives you a concrete comparison baseline for acceptance testing.
FDA and regulated submission note. If your SAS programs produce outputs for regulatory submissions, the XPT transport format and CDISC standards (SDTM, ADaM) are non-negotiable. Confirm that any replacement platform can read and write XPT files, produce CDISC-compliant datasets, and generate the audit documentation your submission package requires before committing to a migration path.
Why does Plotstudio fit regulated and reproducible research workflows?
Most analytics tools are built for exploration. Plotstudio is built for defensibility.
The distinction matters when your output is a paper, a thesis, a grant application, or a regulatory submission. In those contexts, “I got the right answer” is not enough. You need to show exactly how you got it, that the method was chosen before the data was analyzed, and that someone else could reproduce the result from scratch.
Plotstudio addresses this with three structural features that most platforms treat as optional add-ons:
- Local execution: Data never leaves the researcher’s machine. This is the only workable model for IRB-governed patient data, NHS records, or GDPR special-category datasets that cannot be uploaded to a cloud service.
- Preregistered analysis plans: Every analysis is gated behind a plan that the researcher reviews and approves before any code runs. Methods, assumptions, and success criteria are documented up front, functioning as both a pre-registration and an audit trail.
- Skills: A researcher or lab encodes their field’s methodology once, including required steps, statistical thresholds, forbidden shortcuts, and reporting conventions. Every subsequent analysis follows that methodology automatically, rather than defaulting to a generic approach.
Plotstudio runs R and Python natively and covers the methods academic work actually requires: survival analysis, Cox proportional hazards, mixed-effects models, regression, ANOVA, and multiple-comparison correction. Outputs include annotated notebooks, PDF reports, and permanent searchable analysis pages, so a supervisor, reviewer, or collaborator can trace every analytical decision.
Reproducibility in practice: Plotstudio’s analysis-plan approval step functions as a structural pre-registration. The researcher commits to methods and assumptions before seeing results, which eliminates post-hoc method selection and gives peer reviewers a complete, timestamped record of every analytical decision. This is the audit trail that regulated research requires and that most general-purpose analytics tools cannot produce without significant manual overhead.
Pro Tip: Use Plotstudio’s Skills feature to encode your lab’s or department’s statistical standards once, including which multiple-comparison correction your field requires, which covariates are mandatory, and which shortcuts are forbidden. Every analyst on the team then runs analyses against the same methodology, which eliminates protocol drift across projects.
Regulated and academic use cases where Plotstudio’s model reduces overhead:
- Clinical researchers handling IRB-governed patient data who cannot use cloud analytics tools
- Academic labs running survival or mixed-effects analyses for peer-reviewed publication
- Graduate researchers producing reproducibility packages for thesis submission or journal supplementary materials
- Teams working under GDPR special-category data restrictions where local processing is the only compliant option
- Research groups that need a pre-registration-equivalent audit trail without a separate workflow management tool
For teams evaluating agentic analytics as a category, Plotstudio’s multi-agent workflow automates the planning, coding, execution, and interpretation steps while keeping the researcher in control of every methodological decision.
What is the bottom line, and what should you do next?
The right SAS replacement depends on one question: what is your primary job? Code-first statistical research belongs in R or Python. Regulated, reproducible academic workflows belong in Plotstudio. Enterprise BI and governed pipelines belong in Databricks, Dataiku, or Alteryx. Legacy SAS code that cannot be rewritten immediately belongs in Altair SLC or Jenner.
Immediate next steps:
- Run a focused PoC using three to five representative analyses from your current SAS workflow, validating outputs against known results on the same sample data.
- Confirm your deployment model before shortlisting: if your data cannot leave the local machine, cloud-native platforms are off the table regardless of their feature set.
- Check SAS-code compatibility early. If you have significant SAS macro libraries or DATA step pipelines, evaluate a compatibility runtime before committing to a full rewrite.
- Verify training and support availability for your team’s skill level. A platform with a steep learning curve and no structured onboarding will stall adoption.
- For regulated workflows, request validation documentation from vendors before procurement. Ask specifically about 21 CFR Part 11, GxP, or FDA submission support.
The fastest way to start: if your work is research-grade, sign up for a Plotstudio research partnership to access trial credits and evaluate the platform against your actual datasets. If your need is enterprise-scale, contact the Plotstudio enterprise team for a managed deployment assessment.
Key Takeaways
The most defensible SAS replacement is the one that matches your primary job, covers your required statistical methods, and meets your data governance constraints before any other criterion.
| Point | Details |
|---|---|
| Match tool to primary job | Code-first research fits R/Python; regulated reproducible workflows fit Plotstudio; enterprise BI fits Databricks or Dataiku. |
| Prioritize reproducibility for regulated work | Audit trails, preregistered analysis plans, and exportable packages are structural requirements, not optional features, for IRB or FDA-governed research. |
| Validate SAS compatibility early | Altair SLC and Jenner Analytics run SAS language code natively; every other alternative requires a rewrite, which adds weeks to months of migration time. |
| TCO exceeds license cost | Validation overhead, training time, and infrastructure often exceed the license fee, especially for open-source environments in regulated settings. |
| Plotstudio for research-grade workflows | Plotstudio combines local execution, preregistered analysis plans, and exportable reproducibility packages for academic and regulated research teams. |
The reproducibility gap most teams overlook
There is a version of this evaluation that almost every team gets wrong. They compare statistical-method coverage, check the pricing page, and run a quick PoC on a clean dataset. What they skip is the reproducibility audit.
The question is not whether your new platform can run a Cox regression. The question is whether, six months from now, a reviewer, a regulator, or a new team member can open your analysis and reconstruct exactly what you did, why you chose those methods, and what assumptions you made before you saw the results. That is a different standard, and most platforms fail it not because they lack the technical capability but because they leave reproducibility as an exercise for the analyst.
The SAS ecosystem, for all its cost and friction, enforced a kind of methodological discipline through its procedural structure. Replacing SAS with a more flexible tool without replacing that discipline is how research teams end up with faster analyses that are harder to defend. The platforms that take reproducibility seriously, whether through structured analysis plans, version-controlled environments, or exportable audit packages, are the ones worth the migration effort.
Plotstudio runs your analysis locally, reproducibly, and without the SAS overhead
Researchers and analysts who need defensible, reproducible statistical analysis without SAS’s cost or infrastructure have a direct alternative in Plotstudio. Your data stays on your machine, your methods are documented before any code runs, and every analysis exports a complete reproducibility package: annotated notebook, PDF report, and a searchable analysis page your collaborators can audit.

Plotstudio covers survival analysis, Cox proportional hazards, mixed-effects models, ANOVA, regression, and multiple-comparison correction natively in R and Python, with an agentic workflow that plans, codes, executes, and interprets the analysis for you. It is the only option on this list that combines privacy-first local execution with structural preregistration and a built-in audit trail.
Start with a free trial or apply for research partnership credits if you are in an academic setting. Enterprise teams can review deployment options and licensing on the Plotstudio enterprise page.
Useful sources and further reading
- Top SAS Competitors & Alternatives 2026 | Gartner Peer Insights - Analytics and Business Intelligence Platforms
- Best SAS-STAT Software Alternatives 2026
- Alternatives to Installing SAS
- Best 15 SAS-STAT Alternatives in 2026
- SAS - Products, Competitors, Financials, Employees, Headquarters Locations
- SAS-Compatible Data Language - Jenner Analytics Documentation
- ftc.gov
Recommended
- Are Data Analysts Obsolete? the 2026 Reality Check | PlotStudio AI
- Advanced Data Analysis Alternative: A Purpose-Built Tool for Real Reports | PlotStudio AI
- Best AI Tools for Data Analysis in 2026: 10 Tools Tested & Ranked | PlotStudio AI
- Advanced Statistical Methods a Practical Guide for 2026 | PlotStudio AI