IRB Ready Self Service Data Analysis: Pre Registered and Local

Research-grade self-service data analysis means running statistical work on your own machine, under an analysis plan you approve before any code executes, with every output packaged for independent reproduction. It fits any lab handling IRB or GDPR-governed participant data that cannot leave institutional control. Done correctly, this approach produces results defensible enough for peer review, not just internal exploration.
TL;DR:
- Self-service data analysis must run entirely locally to protect sensitive participant data and avoid transfer risks.
- Developing a pre-approved analysis plan and Data Management Plan before executing code is crucial for compliance and reproducibility.
- The platform should support key statistical methods like survival analysis, mixed-effects models, and multiple comparison corrections with full diagnostics.
- Exporting comprehensive reproducibility artifacts, such as annotated notebooks and environment snapshots, ensures transparent validation of results.
- Proper implementation requires integrating governance steps upfront, including role-based access, audit logs, and alignment with institutional data policies.
Table of Contents
- What Does “Research-Grade” Self-Service Data Analysis Actually Mean?
- How Do You Roll Out Self-Service Analysis Safely?
- Which Statistical Methods and Outputs Should You Expect?
- What Should You Check Before Trusting a Self-Service Analytics Tool?
- How PlotStudio Maps to the Research-Grade Checklist
- What Skills Does Effective Self-Service Data Analysis Require?
- How Should You Visualize and Interpret Self-Service Analysis Results?
- What Are the Biggest Limits of Self-Service Data Analysis?
- How Does Self-Service Analysis Fit Institutional Data Governance?
- What Do Successful Self-Service Analysis Implementations Look Like?
- When Should You Trust Self-Service Analysis Versus a Specialist?
- Get Started With PlotStudio for Regulated Research Data
- Sources
What Does “Research-Grade” Self-Service Data Analysis Actually Mean?
Most software marketed as self-service analytics targets business users building dashboards. Academic research needs something structurally different: a workflow where privacy and reproducibility are architectural constraints, not optional settings.
Three principles separate research-grade tools from generic ones. Local-first execution keeps data on the researcher’s device rather than routing it through a cloud API, which matters enormously for anything touching patient records, genetic data, or identifiable survey responses. Local and sovereign AI architectures shift the entire confidentiality trade-off compared to cloud-based large language models, grounding outputs in verifiable local data rather than opaque remote processing.
The second principle is the analysis plan itself. A plan reviewed and locked before execution functions as pre-registration: it states which tests will run, what assumptions they rely on, and what would count as a failed or null result. Reviewers value this because it closes off the temptation to run a dozen models and report the one that worked. A 2016 survey found that 52% of scientists report a replication crisis in their field, and undisclosed analytical flexibility is a major driver of that number.
Third, GDPR compliance for research data hinges on documented safeguards, not general policy language. Article 89 of the GDPR grants research-specific accommodations, but only if pseudonymisation, key custody, and access decisions are written into a Data Management Plan. For special-category data under Article 9, that DMP also needs an underlying national legal basis, not just institutional assurance.
A properly built DMP should specify:
- Who holds the key mapping pseudonyms back to identities, and under what conditions it can be used
- Which access tier applies (open, registered, or controlled) and why
- What a Data Protection Impact Assessment covers when consent language limits downstream sharing
A DPIA becomes necessary whenever processing is likely to result in high risk to data subjects, which most longitudinal or health-adjacent studies automatically trigger.
How Do You Roll Out Self-Service Analysis Safely?
Adopting this kind of workflow works best as a sequence, not a single decision. Skipping steps is exactly what turns a defensible pipeline into an audit liability.
- Plan. Write an analysis plan that doubles as both pre-registration and DMP input: name the statistical tests, the diagnostic checks, and any planned data transformations before touching the dataset.
- Approve. Route the plan through your IRB or Data Protection Officer. Document the lawful basis for processing, and if special-category data is involved, confirm the Article 9 exception applies.
- Prepare. Pseudonymise the dataset, assign key custody to a named role, and select the access tier the data warrants. Participant-level research data almost always needs controlled access rather than open sharing, since de-identification alone rarely satisfies a repository’s suitability bar.
- Run. Gate code execution so nothing runs until the plan is formally approved. Keep versioned logs of every script, model, and output alongside provenance metadata tying results back to specific data snapshots.
- Publish. Export a full reproducibility package: annotated notebooks, a PDF methods report, and a searchable analysis page a reviewer can open without re-running anything. Prepare Data Use Agreements or repository metadata alongside the manuscript.
- Verify. Run an internal replication, or hand a reviewer-accessible audit package to a colleague for an independent re-run before submission.
Pro Tip: Treat step 2 as a hard gate, not a formality. Analysis run before DPO sign-off cannot retroactively become compliant, no matter how good the results look.
Which Statistical Methods and Outputs Should You Expect?
Academic work rarely stops at descriptive statistics and a bar chart. A tool claiming research-grade status needs to run the methods your discipline actually publishes with, not a simplified subset.
At minimum, expect native support for:
- Survival analysis and Cox proportional hazards models
- Mixed-effects models for repeated-measures or hierarchical data
- Standard and robust regression, including diagnostics for violated assumptions
- ANOVA with appropriate post-hoc corrections
- Multiple-comparison correction (Bonferroni, Benjamini-Hochberg, or equivalent)
Transparent diagnostics matter as much as the models themselves. Misapplied inferential statistics, including Gaussian approximations used where they don’t hold, are a documented source of false and irreproducible findings, which is why sensitivity analyses and assumption checks belong in the standard workflow, not as an afterthought before submission.
On the output side, expect three deliverables: an executable annotated notebook, an environment capture recording exact package versions, and a PDF report a co-author can read without opening code. Computational reproducibility depends on sharing code, data, and documentation together as a single research compendium, and a searchable analysis page that links each output back to the exact code chunk that produced it makes that compendium usable rather than theoretical.
What Should You Check Before Trusting a Self-Service Analytics Tool?
Evaluating a platform for regulated research comes down to five checks, regardless of vendor:
- Privacy and data flow: confirm execution happens locally, with no data leaving the device, and verify who controls re-identification keys.
- Method transparency: analysis plans should be visible and lockable before execution, with full logs afterward.
- Reproducibility artifacts: the tool must export notebooks, reports, and environment snapshots, not just static charts.
- Governance features: audit logs, role-based access, DUA support, and DPIA-ready documentation.
- Operational fit: native R and Python execution, coverage of the methods your field publishes with, and support for discipline-specific configuration rather than one-size-fits-all defaults.
General guides on evaluating analytics tool trade-offs reinforce the same principle across domains: the right evaluation criteria matter more than any single feature list.
How PlotStudio Maps to the Research-Grade Checklist
PlotStudio was built around the checklist above rather than retrofitted to it. Analysis runs locally on the researcher’s own machine, so IRB-governed, NHS, or GDPR special-category data never leaves the device. Every analysis sits behind a plan the researcher reviews and approves first, functioning as both pre-registration and an audit trail a reviewer can inspect later.
The platform runs R and Python natively and covers survival analysis, Cox models, mixed-effects models, regression, and ANOVA with multiple-comparison correction, exporting annotated notebooks, PDF reports, and permanent searchable analysis pages. Skills let a lab encode its own required steps and forbidden shortcuts once, so subsequent analyses follow discipline-specific methodology instead of a generic default. You can read more on how agentic analytics and Skills enforce these conventions in practice.
What Skills Does Effective Self-Service Data Analysis Require?
Running your own analysis well requires more than clicking through menus. Statistical literacy is the non-negotiable baseline: knowing which test fits which data structure, and recognizing when an assumption is violated rather than trusting default output.
Beyond statistics, researchers need enough coding fluency in R or Python to inspect and modify generated scripts rather than accepting a black box. Understanding your discipline’s reporting conventions matters just as much. A biostatistician expects hazard ratios and confidence intervals reported a specific way; a psychology reviewer expects effect sizes alongside p-values. Tools that let you encode those conventions once, rather than re-specifying them every analysis, save real time.
Data literacy rounds this out: recognizing missingness patterns, spotting outliers that distort a regression, and knowing when a transformation is defensible versus when it’s p-hacking in disguise. Governance literacy is the piece most researchers underrate. Knowing what your DMP requires, when a DPIA applies, and how consent language constrains what you can share downstream is now as central to competent self-service analysis as knowing your statistics. A researcher fluent in Cox models but unaware of Article 89 safeguards will produce technically sound results that can’t clear ethics review.
How Should You Visualize and Interpret Self-Service Analysis Results?
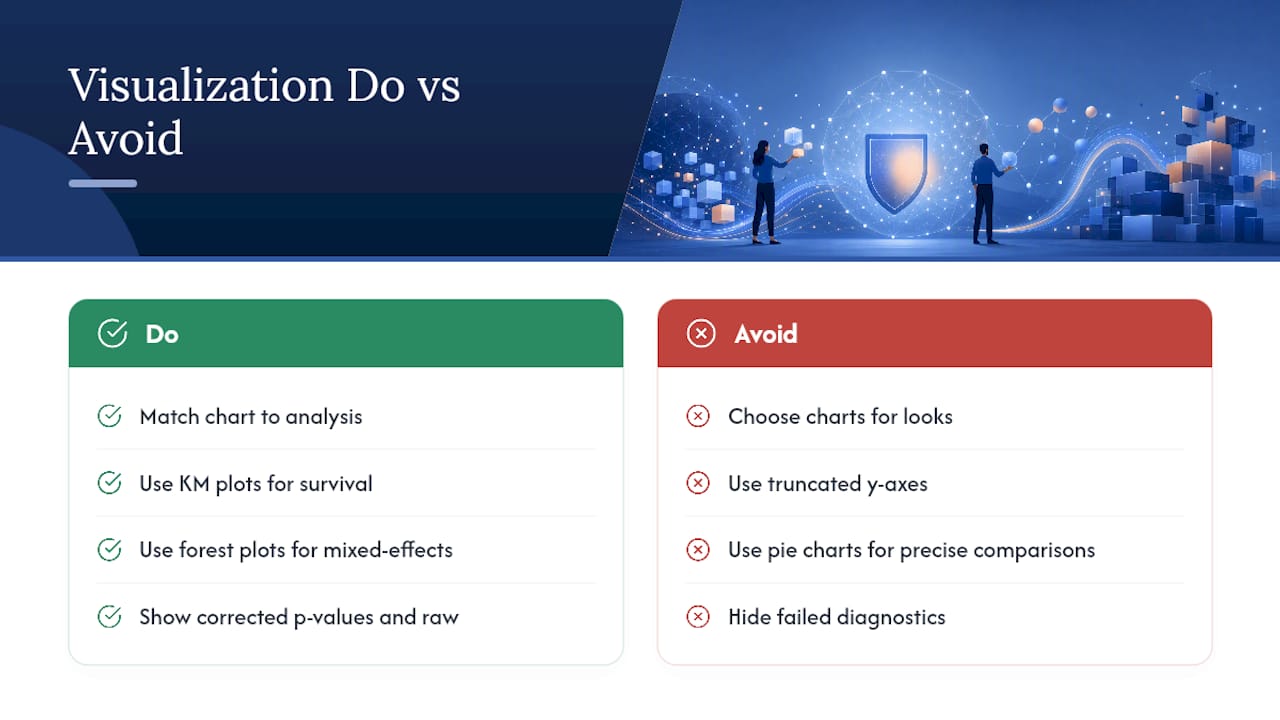
A chart that looks convincing and a chart that’s honest are not always the same thing. The most common failure in self-service visualization is choosing a chart type for its visual appeal rather than its fit to the data. Truncated y-axes exaggerate small differences; pie charts obscure precise comparisons that a simple table would show better.
Match the visualization to the analysis. Survival curves need Kaplan-Meier plots with confidence bands and at-risk tables underneath, not a generic line chart. Mixed-effects model output benefits from forest plots showing fixed-effect estimates with intervals, not a bar chart of point estimates alone. When multiple comparisons are involved, show the corrected p-values alongside the raw ones so a reviewer can see exactly what adjustment was applied.
Interpretation discipline matters as much as the visual itself. State effect sizes alongside significance, not instead of it. Report confidence intervals rather than bare point estimates whenever possible. If a diagnostic plot shows a violated assumption, say so in the write-up rather than quietly switching to a different test and reporting only the second result. Reviewers who cannot see your diagnostic checks have no way to trust your conclusions, which is precisely why exportable notebooks that preserve every diagnostic plot alongside the final figure matter more than the final figure alone.
What Are the Biggest Limits of Self-Service Data Analysis?
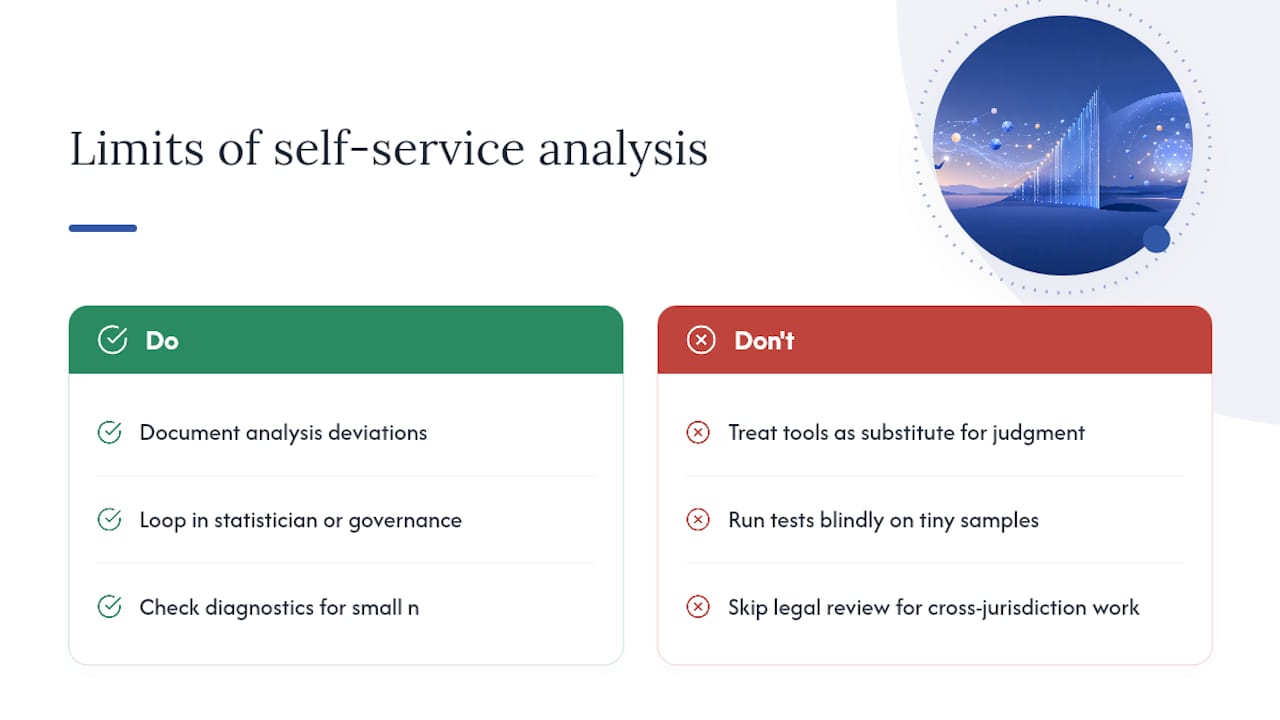
Self-service tools accelerate routine analysis but don’t eliminate the need for judgment. The most common failure mode is a researcher running a sophisticated model without understanding its assumptions, then reporting output that looks authoritative but rests on a violated premise.
Small sample sizes are where automated workflows struggle most. Asymptotic methods that work fine at n=500 can produce misleading confidence intervals at n=15, and a tool that runs the test regardless doesn’t flag that risk unless it’s built to surface diagnostics prominently. Complex nested data structures, competing risks in survival analysis, or non-standard missingness mechanisms often need a statistician’s judgment call that no interface can fully automate.
Cross-jurisdictional research raises a different limitation entirely: legal ambiguity. A multi-country study touching GDPR, HIPAA-adjacent US data, and a third jurisdiction’s health privacy law needs legal review that no software can substitute for, no matter how good its local-first architecture is.
Mitigating these limits comes down to two habits: documenting every deviation from your original analysis plan, and keeping a specialist statistician or your institution’s data governance office in the loop for anything outside routine territory. Self-service analysis works because it removes friction from the parts of research that don’t need a specialist’s time. It fails when researchers treat it as removing the need for statistical judgment entirely.
How Does Self-Service Analysis Fit Institutional Data Governance?
A self-service tool that bypasses your institution’s governance framework creates risk faster than it creates efficiency. Integration works best when the analysis plan itself becomes the governance artifact, not a separate document that duplicates what’s already in your DMP.
Practically, this means the same plan reviewed by your IRB or DPO should be the plan your analytics software gates execution behind. When those two things are the same document, there’s no drift between what was approved and what was run. A DMP and a DPIA should be consistent documents, with operational decisions like pseudonymisation and key custody living in the DMP rather than as vague statements in a separate policy file.
Role-based access ties this together at the institutional level. A lab’s data governance office can define who holds re-identification keys, who can approve an analysis plan, and who can export a reproducibility package, without needing to inspect every individual analysis. Audit logs generated automatically by the analysis tool give that office something concrete to review during periodic compliance checks, rather than relying on researchers self-reporting their own practices. For institutions building this out at scale, our privacy-first analytics guide covers the GDPR obligations in more depth.
What Do Successful Self-Service Analysis Implementations Look Like?
The clearest pattern across labs that adopt self-service analysis successfully is sequencing: governance infrastructure goes in before the tool, not after a problem forces it retroactively. A lab that builds its DMP template, defines its access tiers, and gets DPO buy-in on a standard analysis-plan format before rolling out any software avoids the scramble of retrofitting compliance onto results already produced.
Labs running longitudinal cohort studies tend to benefit most from local-first execution, since repeated waves of sensitive data accumulate real re-identification risk if routed through cloud tools each round. A reproducible workflow that exports a searchable analysis page per wave gives a supervisor an audit trail spanning the full study, not just the final publication.
Graduate researchers working through a dissertation timeline see a different benefit: fewer stalled weeks waiting on a supervisor’s manual code review, because the analysis plan itself was already approved before execution began. A structured PhD analysis workflow that locks the plan early tends to catch methodological problems at the design stage, when they’re cheap to fix, rather than at the results stage, when they’re not.
When Should You Trust Self-Service Analysis Versus a Specialist?
Self-service analysis works well for routine tests, reproducible pipelines, and datasets already cleared for secure processing. It struggles with tiny samples, unusual inferential problems, and legal questions spanning multiple jurisdictions. Document any deviation from your analysis plan the moment it happens, and keep an independent verification channel open. Judgment doesn’t disappear just because the software got faster.
— Aymen
Get Started With PlotStudio for Regulated Research Data
PlotStudio gives researchers the alternative to sending sensitive data through cloud analytics tools: analysis runs entirely on your own machine, gated behind an analysis plan you approve before any code executes.

The platform runs R and Python natively, covers the survival models, mixed-effects analyses, and correction methods academic reviewers expect, and exports full reproducibility packages, including annotated notebooks, PDF reports, and searchable analysis pages a co-author or reviewer can trace end to end. Labs can encode their own discipline’s required steps and reporting conventions through Skills, so subsequent analyses follow established methodology.
If your lab handles IRB or GDPR-governed participant data, the advanced data analysis alternative page walks through the feature set in more detail. Institutions weighing a department-wide rollout can review enterprise deployment options and request a demo directly with the team.
Sources
- Reproducing statistical results — Stodden
- Local and sovereign AI for scientific research (comparative study)
This article is general information, not a substitute for advice from a qualified lawyer. Consult a qualified legal professional about your own circumstances before acting on anything here.