Statistical Analysis Plan: What to Include and How to Write One

A statistical analysis plan (SAP) is a prespecified, technical document that states exactly how your study data will be analyzed: which populations, which outcomes, which methods, and how missing data and multiple comparisons are handled. You write it before the data are unblinded or, for non-trial studies, before you look at outcomes, so that another statistician could follow it and reproduce your results. This guide covers what goes in, how a SAP differs from a protocol, how to adapt a template, and how to write one without it turning into a thesis of its own.
TL;DR
- A SAP is a stand-alone, detailed elaboration of the analysis described in the protocol. It is finalized before unblinding so planned analyses stay separate from data-driven ones.
- Core content: objectives, outcome definitions (measurement, units, transformations), analysis populations, methods for primary and secondary endpoints, missing data, multiplicity, interim analyses, harms, and software.
- The test of a good SAP: a second statistician with the dataset and the SAP should reach very similar results.
- Start from a published template, delete what does not apply, and log every post-hoc change with its reason.
- Tools such as PlotStudio AI, an agentic analytics platform for researchers, can execute a plan you have reviewed and keep the code and outputs auditable, but the plan itself remains yours.
Table of Contents
- What a statistical analysis plan is, and what it is not
- Why you write it before you see the data
- What a statistical analysis plan should include
- Using a template, and adapting it
- A worked example: how specific is specific enough?
- Keeping the plan reproducible
- Perspective: where agentic analytics fits once the plan exists
- Common mistakes to avoid
- Running the plan with PlotStudio AI
- FAQ
- Sources
What a statistical analysis plan is, and what it is not
A SAP gives a more technical and detailed elaboration of the principal features of the analysis described in the clinical protocol, along with the procedures for executing them. That is the framing used in the 2017 JAMA guidelines for the content of statistical analysis plans, the reference most trial statisticians work from.
Three documents often get confused:
| Document | Purpose | Level of detail |
|---|---|---|
| Study protocol | Describes the whole study: rationale, design, eligibility, procedures, and an outline of the analysis | Analysis described in a short statistical considerations section |
| Statistical analysis plan | Specifies the planned analyses, population definitions, and methods so another statistician can follow and reproduce them | Stand-alone, technical, step-level |
| General data analysis plan | A map or recipe that bridges broad research questions and testable hypotheses | Typically background, aims, methods, and dummy tables and figures |
The European Network of Centres for Pharmacoepidemiology and Pharmacovigilance describes the SAP as a more technical, stand-alone document than the protocol’s outline of analyses. The Australian National University guide to quantitative data analysis plans describes the general data analysis plan as having four components: background, aims, methods, and planned (dummy) tables and figures.
If you are a PhD student with an observational or experimental study, you may not need a formal clinical-trial SAP. You still benefit from the same discipline. A data analysis plan with dummy tables is the lightweight version, and many supervisors and ethics committees will accept it. If your study is a clinical trial, particularly under an investigational regulatory submission, the full SAP is expected.
Why you write it before you see the data
The point of a SAP is separation. According to the ENCePP methodological guide, SAPs help separate pre-planned analyses from data-driven analyses, which supports the validity and interpretation of study outcomes. A reviewer who asks why you chose a particular model, a particular covariate set, or a particular handling of outliers can be pointed to a dated document that predates the results.
Two timing rules are worth memorizing:
- The SAP should be completed before data are unblinded, and it should be detailed enough for another statistician to follow, as set out in the 2023 template for authoring statistical analysis plans.
- For trials under an IND, IDE, or international equivalent, the SAP should be finalized and submitted before interim analyses or breaking the blind, per the JAMA guidance.
There is also a perspective on authorship: a SAP should be written by someone who has not seen unblinded trial data, a point made in the guidance on SAPs for academic clinical trials. For a PhD student analyzing their own cohort, the practical translation is to write the plan from the protocol and the data dictionary, not from exploratory plots of the outcome.
What a statistical analysis plan should include
The JAMA guidance says a clinical-trial SAP should cover administrative information, the introduction, study methods, statistical principles, the trial population, and analysis, including outcome definitions, analysis methods, missing data, harms, and statistical software. Here is how those sections look in practice.
Administrative information and introduction
Title, trial registration number, SAP version, the people who wrote and approved it, and a revision history. The introduction restates the background and the specific objectives or hypotheses. Keep the hypotheses in the same wording as the protocol so there is no drift between documents.
Study methods and statistical principles
Describe the design (parallel group, crossover, cluster, cohort), the allocation ratio, the randomization and blinding arrangements, the sample size and its assumptions, and any planned interim analyses. Under statistical principles, state the significance level, whether tests are one- or two-sided, confidence interval levels, and how multiplicity is handled across multiple outcomes, timepoints, or subgroups. If you need to justify sample size, a power analysis software comparison can help you choose a tool before you commit the assumptions to paper.
Analysis populations
Say exactly who is in each analysis. The JAMA guidance asks the SAP to define populations such as intention-to-treat or per-protocol, so that readers know who is included. Write the rules as operational criteria that can be coded: “all randomized participants, analyzed as randomized” is codable; “participants who adequately adhered” is not until you define adequately (for example, at least 80% of doses taken) and say how it is measured.
Teams that collect trial data in an electronic system will find that population flags are easier to derive when the case report form captures adherence and deviations consistently. A primer on clinical data management from eCRF to database lock shows how planning measurement formats and timing upstream makes these definitions workable later.

Outcome definitions
The guidance asks that outcome definitions specify the measurement, units, and any calculations or transformations applied. For every primary and secondary outcome, write:
- The variable and its source (for example, serum creatinine from the laboratory table).
- The unit and timing (mg/dL at 48 hours after randomization).
- Any derivation (change from baseline, log transformation, time to first event).
- The analysis window and what happens to measurements outside it.
Analysis methods
For each endpoint, name the model, the outcome distribution or link, the covariates (and why), the handling of repeated measures, and the effect measure to report. Examples:
- Continuous outcome at one timepoint: linear regression adjusted for baseline value and stratification factors, reporting the adjusted mean difference with a 95% confidence interval.
- Repeated measures: a mixed-effects model with a specified covariance structure or random effects, and the time parameterization.
- Time-to-event: Kaplan-Meier estimates, a Cox proportional hazards model, and a plan for checking the proportional hazards assumption, including what you will do if it fails. A comparison of survival analysis software is useful if you are choosing where to run these.
- Binary outcome: logistic regression or a binomial model with the effect reported as an odds ratio or risk difference, stated in advance.
Include assumption checks and the fallback. A SAP that says “normality will be assessed” without saying what happens when it fails leaves a decision open that you will then make after seeing the data.
Missing data, deviations, and harms
State the expected mechanism of missingness, the primary approach (complete case, multiple imputation, a mixed model that uses all available data), and the sensitivity analyses. The guidance also expects the handling of protocol deviations to be specified. Harms deserve their own subsection: how adverse events are coded, summarized, and compared, and whether formal testing is planned at all.
Multiplicity, subgroups, and interim analyses
If you have several primary outcomes, comparisons, or timepoints, name the multiple-comparison procedure (for example, a hierarchical gatekeeping order, Holm, or Bonferroni) and the family it applies to. List subgroups in advance, with the direction of expected effect if you have one, and test them with an interaction term, not by comparing p-values across strata. For interim analyses, give the timing, the stopping boundaries, and who sees unblinded results.
Software
List the statistical software and versions. Listing software is explicitly part of the content the JAMA guidance asks for. Add package names for R or Python if the analysis depends on them.
Using a template, and adapting it
You do not need to invent the structure. The 2023 article presenting a SAP authoring template provides one, and it notes that not all sections apply to every study and that unique study features may require additional sections. Treat that as permission to cut as well as to add.
A practical way to adapt a template:
- Copy the template and delete sections that genuinely do not apply, with a one-line note rather than silence, so a reviewer sees it was a decision.
- Fill in the sections that the protocol already answers by reference, and then fill in what the protocol leaves open: populations, derivations, models, missing data.
- Add study-specific sections, such as a cluster-adjustment section for a cluster trial or a confounder-selection rationale for an observational study.
- Have someone who did not write it read it and attempt to say, for each outcome, which model they would run. Disagreements show you where the text is vague.
For an NIH-funded study, the NIAID statistical analysis plan guidance adds a useful rule: if no stand-alone SAP is used, the protocol’s statistical considerations section should describe the planned analyses in enough detail to reproduce them and define the analysis populations.
A worked example: how specific is specific enough?
The guidance calls for specific objectives or hypotheses, outcome specifications and timing, measurement and units, calculations or transformations, and analysis methods. Here is one outcome written at the right resolution for a hypothetical trial (illustrative only, not a real study):
Primary outcome. Change in systolic blood pressure (mmHg) from baseline to week 12, measured by the average of two seated readings at the clinic visit. Population. All randomized participants, analyzed as randomized. Model. Linear regression of week 12 value on treatment, baseline value, and the stratification factor (site), reporting the adjusted mean difference and 95% CI. Missing data. Multiple imputation under a missing-at-random assumption, 50 imputations, with treatment and baseline covariates in the imputation model; sensitivity analysis using a tipping-point approach. Software. R, with package versions recorded in the analysis log.
Notice what is absent: no phrase like “appropriate tests will be used.” Every choice a reader could question has been made and written down.
Keeping the plan reproducible
The 2023 template article describes reproducibility as a key goal of a well-written SAP: multiple statisticians with the analysis dataset and the SAP should be able to conduct very similar analyses and ideally produce the same results. Three habits support that:
- Version the plan. Each version has a date and a change log. Per the ENCePP guide, changes after analysis begins should be noted and justified in a revised SAP.
- Label post-hoc work. The 2023 template article advises that post-hoc analyses or deviations from the plan be identified, with their rationale. Reviewers rarely object to post-hoc analyses that are labeled; they object to ones presented as planned.
- Link plan to code. Name each analysis in the SAP with an identifier (for example, Table 2, Model P1) and reuse that identifier in your scripts and output. Our reproducible analysis workflow guide walks through the structure for doing this.
For the broader sequence from cleaning to reporting, the PhD data analysis workflow places the SAP at the point it belongs: before modeling, after the data dictionary is stable.
Perspective: where agentic analytics fits once the plan exists
We see a SAP as the contract between your question and your data. It is written by you, in the language of your discipline, and no software should write it for you or quietly change it afterward.
What happens after the plan is signed off is where researchers lose weeks. Someone has to translate each line into code, run it, inspect intermediate results, check assumptions, and document what was done. That is the gap PlotStudio AI was built for: agentic analytics for researchers, where specialized agents plan an investigation, write and run real code, inspect results, and synthesize findings into a reproducible analysis.
Two features map directly onto SAP practice. Plan Mode lets you review and modify the proposed analytical approach, including methods, assumptions, and steps, before anything runs, so the agent works to your plan and not around it. Skills let a lab or group encode its own statistical conventions and reporting expectations, so the plan’s rules are applied the same way every time.
PlotStudio AI is not a replacement for R, Python, Stata, SPSS, SAS, RStudio, or Jupyter. Those provide the statistical computing. We think of PlotStudio AI as an emerging layer on top of them that plans, executes, inspects, validates, and documents complete analyses, and that preserves the code, outputs, and statistics for a supervisor or reviewer to inspect.
Aymen
Common mistakes to avoid
- Writing “as appropriate.” Any phrase that defers a method choice to later defeats the purpose of prespecification.
- Defining populations after seeing exclusions. Write the rules first; apply them second.
- Forgetting the fallback. For each assumption check, state the alternative method.
- Leaving multiplicity implicit. If you will report ten outcomes, say which are primary and how error is controlled.
- Treating the SAP as a one-time document. Amend it formally when the plan changes, and record why.
- Skipping dummy tables. Empty shells of Table 1 and the results tables make the plan concrete and expose missing variables early.
Running the plan with PlotStudio AI
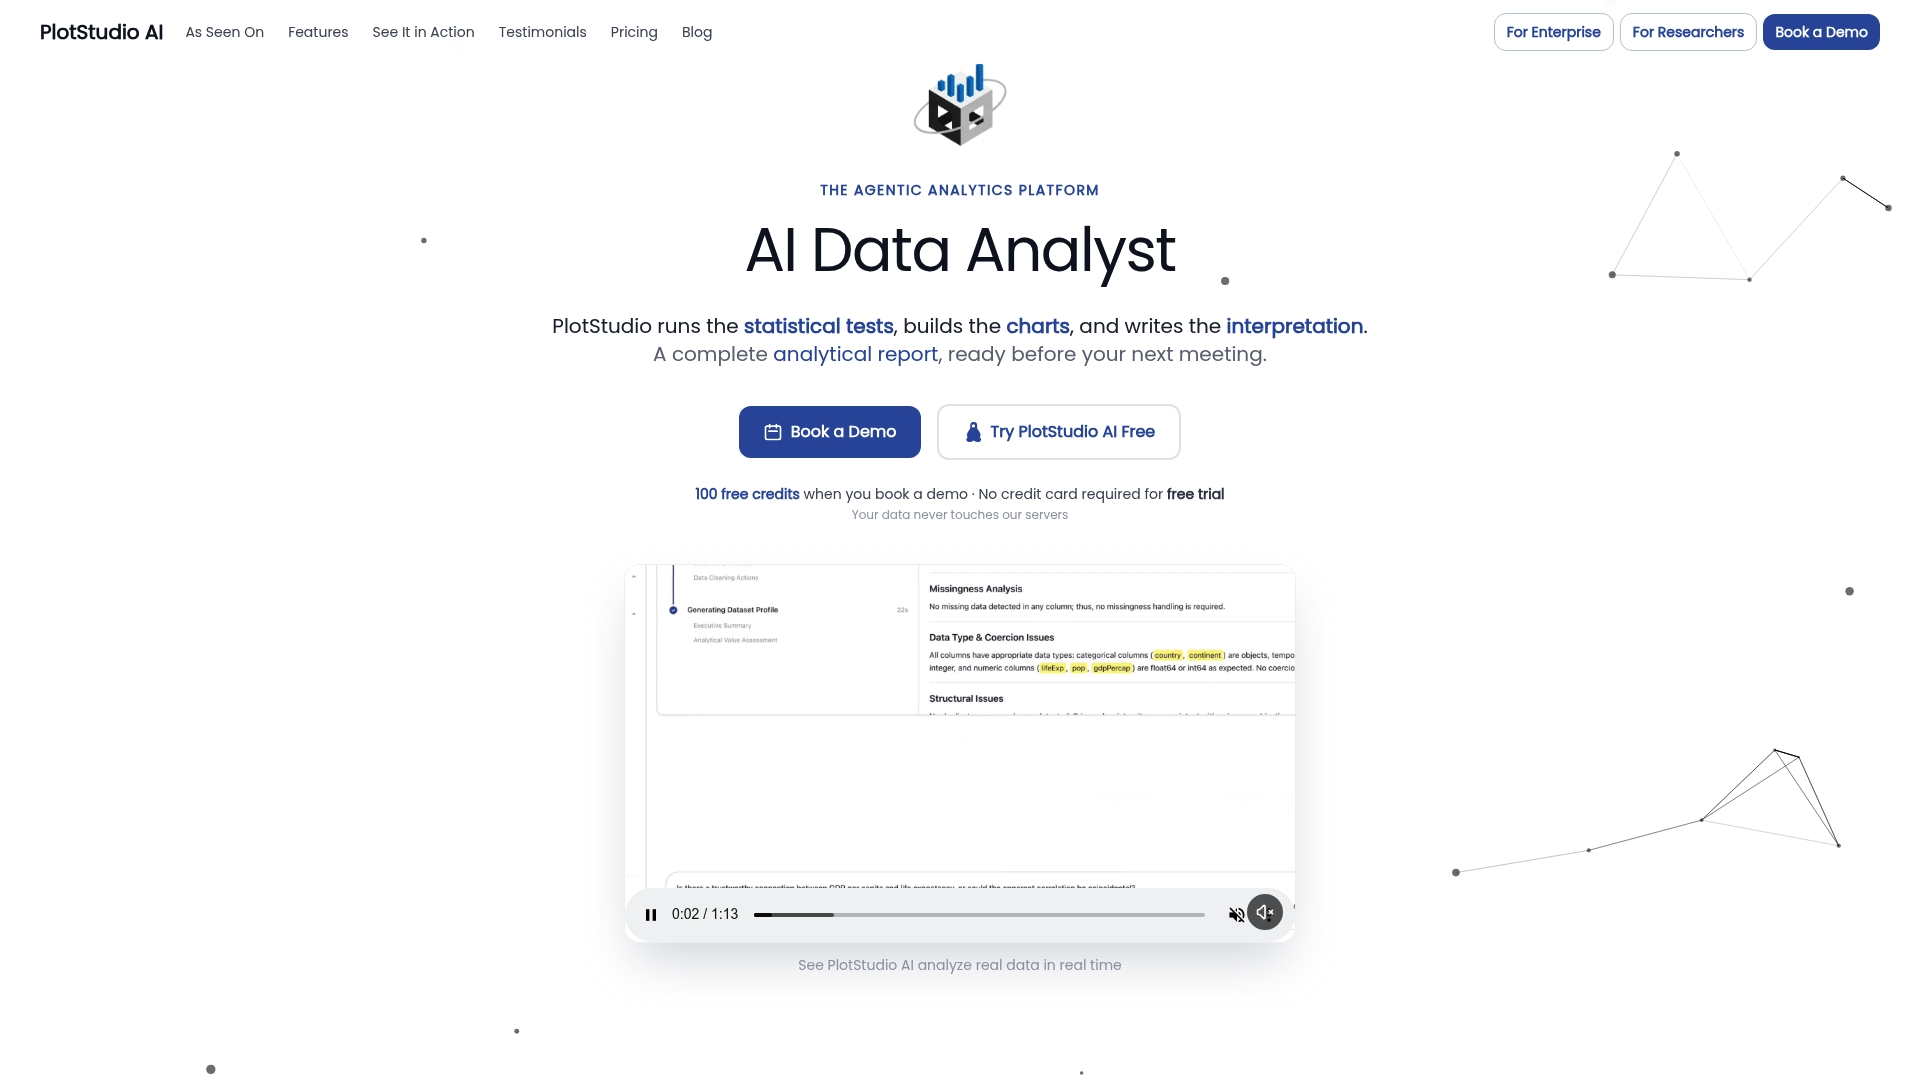
Once your SAP is final, you still have to execute it, and for a PhD student with three months of analysis left that is often the bottleneck. PlotStudio AI runs analyses locally on your machine, which suits workflows where datasets should not be uploaded to conventional cloud analytics platforms, a common constraint for clinical data. You can paste the analytical objective, review the proposed approach in Plan Mode, and export the finished work as a notebook or PDF report, with the methodology, code, and outputs available for review.
For published pricing, PlotStudio AI lists a Bring Your Own Key plan at $39.99 per month, or $399.90 per year on the academic page, and Managed Credits at $69.99 per month. There is a free trial, so you can test a plan of your own first. Details are on the pricing page.
If your institution wants to evaluate PlotStudio AI across a group, the enterprise page lists a one-off pilot fee of $500. For tooling context, see our guides to clinical data analysis software and clinical trial data analysis.
FAQ
What is the difference between a SAP and a protocol?
The protocol describes the whole study and outlines the analyses. The SAP is a more technical, stand-alone document that details the planned analyses, population definitions, and methods so another statistician can reproduce them. In smaller studies without a separate SAP, the protocol’s statistical considerations section has to carry that detail.
When should a statistical analysis plan be finalized?
Before data are unblinded. For trials under an IND, IDE, or international equivalent, it should be finalized and submitted before interim analyses or breaking the blind. If you change it afterward, record the change and its rationale in a revised version.
Do I need a SAP for an observational study or a thesis?
A formal clinical-trial SAP is not always required, but a prespecified plan is still good practice. A general data analysis plan with background, aims, methods, and dummy tables serves the same purpose, and published templates exist for observational studies. Check your supervisor’s and ethics committee’s expectations.
Who should write the SAP?
Ideally a statistician who has not seen unblinded trial data, working with the clinical investigators. In a PhD project, that means writing it from the protocol and data dictionary before exploring outcomes, and asking a statistician or supervisor to review it.
Sources
- Guidelines for the Content of Statistical Analysis Plans in Clinical Trials (JAMA)
- Chapter 12: Statistical analyses (ENCePP methodological guide)
- Developing a Quantitative Data Analysis Plan (Australian National University)
- A template for the authoring of statistical analysis plans
- Statistical analysis plans (SAPs) for academic clinical trials
- Statistical Analysis Plan (NIAID)
- Clinical data management: from eCRF to database lock (NovaCore Group)