Survey Data Analysis: Practical Steps for Researchers

Start by checking your response rate and cleaning the raw file, then summarize results question by question, and run targeted tests only on the comparisons that actually matter to your research question. That order is not arbitrary. Skip the cleaning step and your chi-square results are noise dressed up as findings. Skip the response rate check and you cannot tell a reader whether your satisfaction number describes your population or just the people who happened to answer.
Before you touch a single test statistic, run this quick pass:
- Calculate response rate (completed responses ÷ invitations sent).
- Confirm you have enough respondents per subgroup to break results down safely, using a reasonable minimum per cell for anything you plan to compare statistically.
- Flag duplicates, straight-liners, and speeders in the raw export.
Once that is clean, the path is: clean the data, summarize each question, cross-tabulate the subgroups you care about, run inferential tests where you need to claim a real difference, code the open-ended text, and write it up with confidence intervals attached. The rest of this guide walks through each step.
Key Takeaways
Defensible survey analysis requires reporting response rate and Ns, matching statistical tests to measurement level, and keeping a full audit trail from raw data to headline claim.
| Point | Details |
|---|---|
| Report response rate first | Lead every summary with responses divided by invitations sent, plus sample description. |
| Match test to data type | Use chi-square for categorical data, t-tests or ANOVA for interval data, and nonparametric tests for single Likert items. |
| Show Ns on every table | Never present a percentage or cross-tab cell without its underlying sample size. |
| Validate automated coding | Check any LLM-coded open-ended themes against a locked codebook before trusting the full run. |
| Choose reproducible tools | Plotstudio pairs local, privacy-first processing with an approved analysis plan and exportable audit trail for research-grade reporting. |
Table of Contents
- What Is Survey Data Analysis?
- What Types of Survey Data Require Different Analysis Methods?
- How Do You Prepare for Survey Data Analysis?
- How Do You Clean and Prepare Survey Data?
- How Do You Summarize and Compare Survey Subgroups?
- Which Statistical Test Should You Use for Survey Data?
- How Do You Analyze Open-Ended Survey Responses?
- How Should You Report and Visualize Survey Findings?
- What Are the Most Common Survey Analysis Mistakes?
- How Do You Make Survey Analysis Reproducible and Auditable?
- Frequently Asked Questions
- Sources
What Is Survey Data Analysis?
Survey data analysis is the process of turning raw responses, both closed-ended ratings and open-ended text, into defensible answers to a research or business question. It combines two halves that ask different things: closed-ended statistics tell you how many and how much, while qualitative theming tells you why.
A useful outcome looks like this: you identify two customer segments with statistically different satisfaction scores, then use the open-ended comments to explain what is actually driving the gap between them. Neither half gets you there alone. A p-value without the “why” is a number nobody can act on; themes without a significance test are anecdotes dressed up as findings. The strongest survey reports pair both.
What Types of Survey Data Require Different Analysis Methods?
Every survey question produces one of a handful of data types, and picking the wrong statistic for the type is the single most common error in survey work. Nominal categories (region, product used), ordinal ratings (Likert items), interval or ratio data (age, spend, counts), binary yes/no responses, and open-ended text each demand a different toolkit.
- Nominal — unordered categories like “which product do you use”
- Ordinal — ranked categories with unequal gaps, the classic Likert item
- Interval/ratio — true numeric data like age or number of purchases
- Binary — two-option responses (yes/no, aware/unaware)
- Open-ended text — free-form comments requiring coding
| Data Type | Recommended Descriptive Stat | Typical Test |
|---|---|---|
| Nominal | Counts, percentages | Chi-square |
| Ordinal (single Likert item) | Median, mode | Mann-Whitney U, Kruskal-Wallis |
| Interval/ratio | Mean, standard deviation | t-test, ANOVA, regression |
| Binary | Proportions | Chi-square, proportion z-test |
| Open-ended text | Theme frequency | Qualitative coding |
A single Likert item is ordinal, not interval. This distinction trips up more analysts than any other in survey work. A single “strongly disagree to strongly agree” item should be summarized with a median and analyzed with nonparametric tests. A summed multi-item scale (say, five items measuring the same construct, combined into one score), by contrast, can often be treated as approximately interval once you have established its reliability, which opens the door to means and parametric tests. Confusing the two is the fastest way to produce a result a peer reviewer will reject.
How Do You Prepare for Survey Data Analysis?
Response rate is invitations answered divided by invitations sent, and it belongs at the top of every report you write, not buried in a methods appendix. Institutional guidance from Wake Forest’s Office of Institutional Research recommends leading with response rate and sample description before answering the two questions that matter most: did you get enough responses, and how sure can you be of the result?
Generalizability depends on more than raw response rate. Work through this before you write a single line of analysis code:
- Document the sampling frame: who could have received the survey, and who was excluded by design.
- Note the recruitment mode (email, phone, intercept) since mode shapes who responds.
- Check quota fulfillment against your target demographics.
- Confirm subgroup Ns meet your minimum threshold for any planned breakdown.
- Flag obvious coverage gaps, like a customer list missing an entire region.
Pro Tip: If your sample skews away from your population on a known variable (age, region, tenure), apply post-stratification weighting before running comparisons. An unweighted analysis of a skewed sample risks misrepresenting your population even if every individual test is calculated correctly.
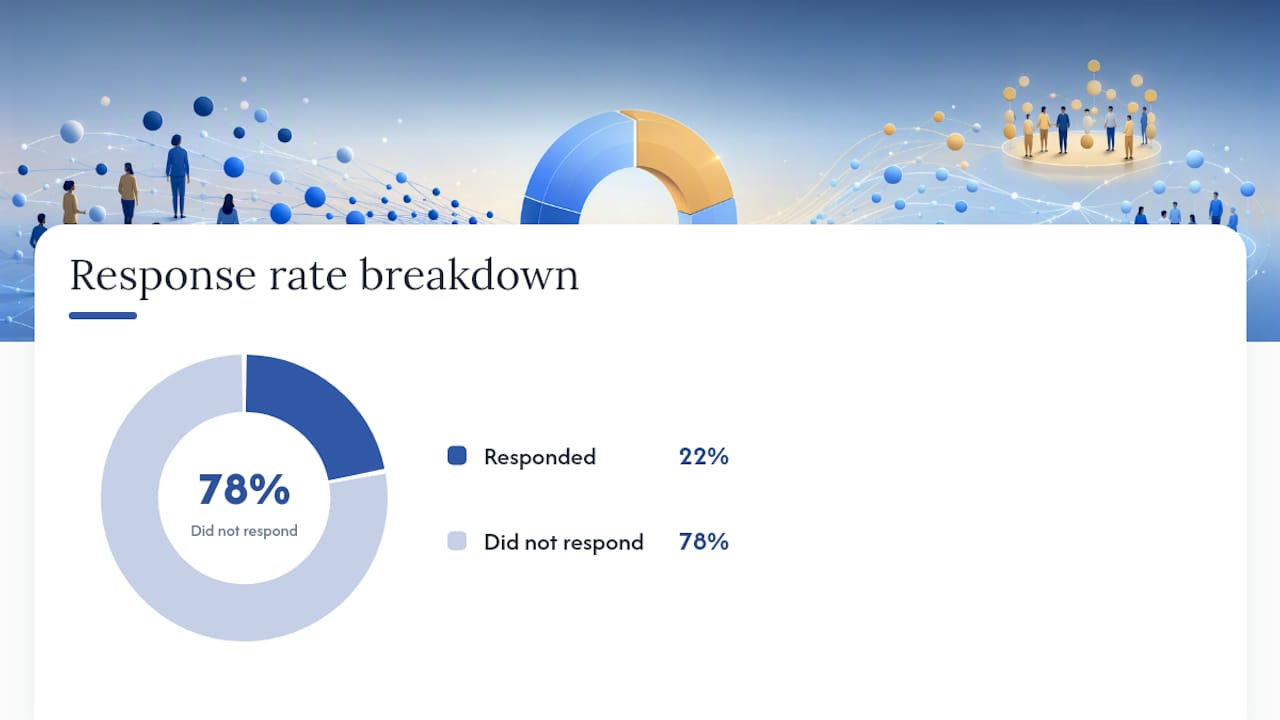
Nonresponse bias, where the people who skipped your survey differ systematically from those who answered, is the quiet killer of survey credibility. You cannot eliminate it, but naming it in your limitations section is far better than pretending your 22% response rate produced a representative sample. Getting the question design right in the first place also reduces downstream cleanup. Guidance on writing effective survey questions is worth reviewing before your next fielding, not after.
How Do You Clean and Prepare Survey Data?
Raw exports are never analysis-ready. Treat cleaning as a fixed sequence, not an improvisation, so a colleague could rerun your steps and get your numbers back.
- Deduplicate by respondent ID, email, or IP/timestamp clustering to remove repeat submissions.
- Flag straight-liners — respondents who selected the same Likert point on every item in a grid, which usually signals disengagement rather than a genuine opinion.
- Check completion rates per question, not just overall completion, since partial abandonment on a specific item often signals a confusing question.
- Verify timestamps and respondent IDs are unique and plausible (a two-second completion time on a 20-item survey is a straight-liner, not a fast reader).
- Apply validation and recoding rules: standardize “N/A” variants, recode reverse-worded items, and convert free-text “other” responses into existing categories where they clearly match.
- Handle missing data deliberately rather than silently dropping rows. Listwise deletion is fine for small amounts of missingness under 5%; beyond that, multiple imputation or a documented missing-data category preserves statistical power without introducing bias.
Build a data dictionary alongside this work: one row per variable, listing question text, response option labels, data type, and the code used for missing values. This single document is what lets a supervisor or reviewer reconstruct your entire analysis without emailing you three follow-up questions.
Pro Tip: Save your cleaning script (R or Python) with a fixed random seed and export the cleaned dataset as a separate, timestamped file rather than overwriting your raw export. A reproducible workflow assumes anyone, including future you, can rerun the exact same steps and get the exact same numbers.

How Do You Summarize and Compare Survey Subgroups?
Descriptive summaries come first, and every number needs its N attached. For each closed-ended item, report the count, the percentage distribution, and either the mean or median depending on measurement level, plus a measure of spread (standard deviation for interval data, interquartile range for ordinal).
Cross-tabulation is where subgroup analysis lives. Setting up a contingency table of, say, satisfaction score by customer tenure, lets you see whether a relationship holds across segments or is an artifact of one dominant group. A few rules keep this honest:
- Always report the N in each cross-tab cell, not just percentages, since a 75% figure built on 4 respondents means nothing.
- Decide upfront whether you need pooled results or stratified results by segment; pooling can mask a real subgroup effect (a version of Simpson’s paradox).
- Use matched pre/post comparisons (paired tests) when the same respondents answered at two time points, and independent-group tests when they did not.
Which Statistical Test Should You Use for Survey Data?
Choosing the right inferential test comes down to matching your data type to the right procedure, and the statistical methods guidance from the University of Utah’s CTSI lays out a clear decision path: use hypothesis tests like t-tests, ANOVA, and regression to determine whether an observed difference is likely real, and consider proportional odds models or win-probability methods for ordinal outcomes instead of forcing them into a parametric framework.
- Categorical comparisons (does response distribution differ by group) → chi-square test.
- Comparing two group means on interval/ratio data → independent-samples t-test, or paired t-test for matched pre/post data.
- Comparing three or more group means → ANOVA, with post-hoc tests to identify which pairs differ.
- Adjusted relationships controlling for confounders → linear or logistic regression, reporting effect sizes and confidence intervals alongside p-values.
- Ordinal Likert outcomes → nonparametric alternatives (Mann-Whitney U, Kruskal-Wallis) or a proportional odds model rather than treating a five-point scale as if it were continuous.
The distinction between Likert-type items and Likert scales determines which of these paths is correct. A single item stays ordinal and gets nonparametric treatment; a validated, summed multi-item scale can graduate to parametric tests. Get this wrong in a thesis defense and it is usually the first thing a committee member catches.
Pro Tip: When your survey used stratified or clustered sampling, standard software defaults will underestimate your variance and overstate your confidence. Use survey-aware procedures (design-based estimation with weights, strata, and cluster variables specified) rather than a generic t-test function. Applied Survey Data Analysis covers the design-based estimation approach in detail, with code examples across Stata, R, and SAS.
How Do You Analyze Open-Ended Survey Responses?
Open-ended text is where most survey analysis quietly stops, because coding it by hand is slow. Build your codebook before you touch automation:
- Draft a codebook from a random sample of 50 to 100 responses, defining each theme with example quotes.
- Lock the codebook once it stabilizes, then apply it consistently across the full dataset.
- Trace every theme back to the specific verbatim responses that support it, so a reader can check your work.
- Run inter-coder checks if more than one person is coding, comparing agreement on a shared subsample.
Large Language Models can genuinely speed this up, but NORC at the University of Chicago’s research on AI-augmented survey work found that LLMs tend to produce more uniform, sanitized outputs than human coders and can miss nuance in messy, contradictory feedback. That does not disqualify automation. It means automation needs a leash: validate a sample of the AI-coded output against your locked codebook before trusting the full run, handling the same caveats that apply to LLM-generated interpretations more broadly.
Pro Tip: Combine automated thematic clustering with a manual sentiment triage pass on a subsample. Automation gets you through volume fast; the manual pass catches the sarcastic comment or backhanded compliment that a sentiment classifier will score as neutral or positive.
How Should You Report and Visualize Survey Findings?
Chart choice should follow question type, not habit. Bar charts suit nominal and ordinal distributions; histograms suit interval/ratio data; stacked bars work well for Likert distributions across groups because they show the full spread, not just an average that flattens disagreement into a single number.
- Show the full distribution on Likert items rather than collapsing to a mean, since a mean of 3.2 can hide a bimodal split between strongly satisfied and strongly dissatisfied respondents.
- Label the N and confidence interval directly on the chart, not in a footnote nobody reads.
- Structure the report itself: response rate and sample first, headline findings with supporting evidence next, question-level results, open-ended themes with supporting quotes, and a methods appendix last.
A practical survey-to-findings workflow described by Sopact pairs cleaning, descriptive summaries, open-end coding, segment cuts, and matched comparisons into a single pipeline where every claim in the final report traces back to specific responses. That traceability is what separates a defensible report from a slide deck of pretty charts. For teams producing recurring reports, a fixed visualization approach applied consistently across survey waves also makes benchmarking over time far easier than reinventing the chart format each quarter.
Pro Tip: Build your tracking dashboard once, with fixed question mappings, if you plan to run this survey again next year. A one-off report format that changes every wave makes trend analysis nearly impossible to defend later.
What Are the Most Common Survey Analysis Mistakes?
A handful of errors show up again and again in survey reports, and most are avoidable with a five-minute check:
- Treating single Likert items as interval data — use medians and nonparametric tests instead; see the data types section above.
- Ignoring response rate entirely — always report it, even when it is uncomfortably low.
- Failing to show Ns on every table and chart — a percentage without an N is unverifiable.
- Over-interpreting small subgroup differences — a 10-point gap between two cells of 15 people each is noise, not a finding.
- Presenting AI-coded themes with no audit trail — always validate a sample against your locked codebook.
The thread connecting all five is the same: confidence without evidence. Report confidence intervals and effect sizes wherever you claim a difference is real, and let the uncertainty show rather than rounding it away for a cleaner headline.
How Do You Make Survey Analysis Reproducible and Auditable?
Research-grade survey work needs an audit trail, not just a correct answer. An analysis plan written and reviewed before you run a single test, functioning as a form of pre-registration, is what lets a reviewer trust your conclusions rather than just your arithmetic.
- Write the analysis plan first: variables, hypotheses, and planned tests, before seeing results.
- Version your cleaning and analysis code, with a fixed random seed for any procedure involving resampling or imputation.
- Maintain the data dictionary alongside the raw and cleaned datasets.
- Export annotated notebooks or reports that link each claim back to the code cell that produced it.
- Keep sensitive data on local infrastructure when working under IRB, GDPR, or NHS data-governance rules that prohibit cloud upload.
An audit trail and a pre-specified analysis plan are what convert a routine survey report into a research-grade output that stakeholders and auditors can actually verify, rather than one they simply have to trust.
Pro Tip: Before you finalize a report, ask whether a stranger with your data dictionary, code, and analysis plan could reproduce your exact numbers. If the answer is no, the gap is usually a missing seed value or an undocumented recoding step.
One Habit Worth Stealing From Experienced Analysts
Run your largest, most obvious subgroup cut first, before the small or exploratory ones. It tells you fastest whether your sample can even support the comparisons your stakeholders will ask for later. When a deadline is tight, protect reproducibility over speed. A fast answer that cannot be traced back to its source data is not actually faster once someone asks you to defend it.
A Note on Choosing a Secure, Reproducible Analysis Platform
Researchers weighing tools for this kind of work, whether spreadsheet macros, standalone statistical software, or AI-assisted platforms, should evaluate a short list of criteria before committing: does the tool export a full reproducibility package (annotated code, a data dictionary, a report a reviewer can trace claim by claim), does it run analysis locally so sensitive respondent data never has to leave the machine, and does it actually support the methods your discipline requires, including R and Python natively rather than a single proprietary language.

Plotstudio was built around exactly this checklist. Every analysis runs behind an approved analysis plan before any code executes, giving you the pre-registration and audit trail a reviewer or supervisor expects, and processing stays local on your own machine, which matters for IRB-governed or GDPR special-category data that cannot touch a cloud tool. Skills let your lab encode its own field’s methodology once, so every subsequent survey analysis follows your discipline’s conventions rather than a generic default, and every result exports as an annotated notebook or PDF report a collaborator can trace end to end. If you are choosing between platform options for reproducible analysis, start a free evaluation on Plotstudio’s enterprise page and run your next survey dataset through it before your current deadline.
Frequently Asked Questions
What is the minimum sample size for survey subgroup analysis? There is no universal number, but most analysts treat 30 respondents per subgroup as a practical floor for running a statistical test, and smaller cells should be reported descriptively rather than tested.
Can I use a mean to summarize a single Likert item? Generally no. A single Likert item is ordinal, so a median or mode is the more defensible summary statistic; a mean is acceptable once you have combined multiple related items into a validated composite scale.
How do I handle a low survey response rate? Report it transparently, check whether respondents differ systematically from nonrespondents on any variable you can observe, and consider weighting your sample to correct for known skews before drawing conclusions.
Is AI coding of open-ended survey responses reliable enough for a thesis or paper? It can be, but only when paired with a locked codebook and a manual validation pass on a sample of the automated output, since AI-coded themes tend to run more uniform than human coding and can miss nuance.
What is the difference between a Likert item and a Likert scale? A Likert item is a single ordinal question; a Likert scale is a composite score built from multiple related items, and that composite can often be analyzed with parametric tests once its reliability is established.
Sources
- Statistical methods (CTSI, University of Utah)
- Promise and pitfalls of AI-augmented survey research (NORC at the University of Chicago)
- Likert scale: examples & analysis (CASRAI)
- Analyzing Likert data (journal article DOI)
- How do I analyze my survey results? (Wake Forest Office of Institutional Research)