
Pick one best tool and you will get the best results. That popular advice fails for causal work, because causal analysis software splits into distinct jobs. You need different tools to draw and test assumptions, identify and estimate treatment effects, run quasi-experimental designs, search for structure, and manage a whole investigation. The right pick depends on the job, not on a ranking. For research data analysis that spans several jobs, PlotStudio AI is one option among the specialist tools below.
This list is ordered by workflow stage, not popularity. Assumption design comes first, then identification and estimation, then specialist designs, discovery, low-barrier browser workflows, and structural modeling. That order mirrors how defensible studies are built. You state the causal question, you make assumptions visible, you check whether the effect is identifiable, and only then do you estimate.
Judge every entry on five criteria. First, which identification strategies and estimators it supports. Second, coding burden versus manual control. Third, automation and whether you can review a plan before anything runs. Fourth, privacy and where execution happens. Fifth, licensing and cost.
Each entry includes a short workflow snippet showing where the tool fits. The closing decision matrix maps roles to starting points, because most researchers need a small stack, not a single winner.
1. plotstudio Homepage
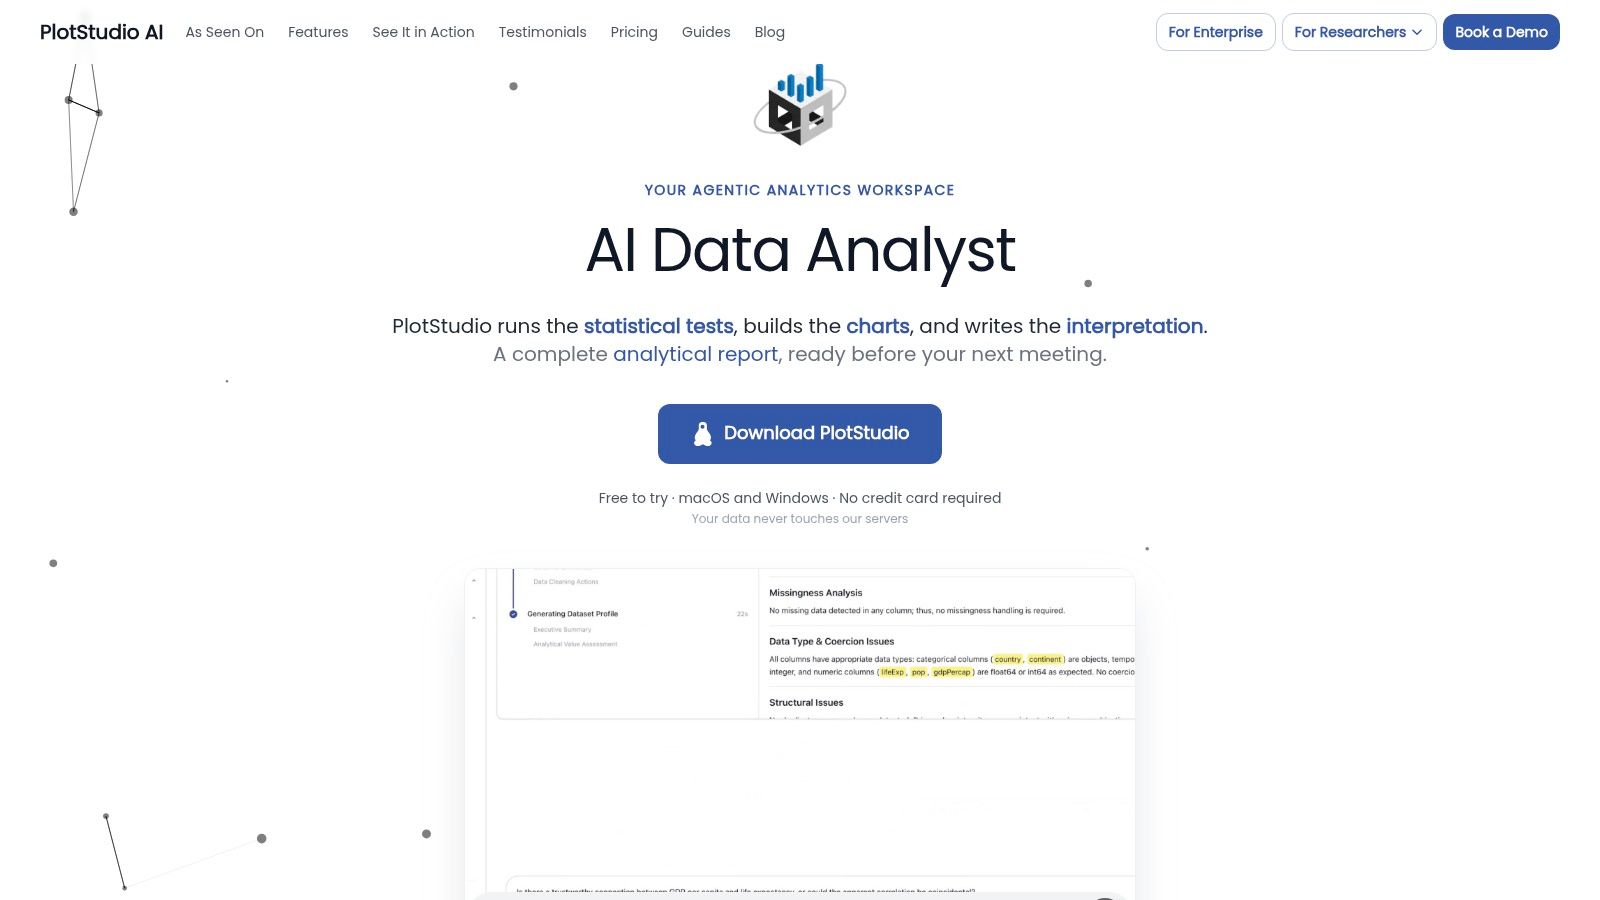
PlotStudio AI sits in a different category from the libraries below. It's an AI tool for researchers who need to investigate data, not merely chat with it. You upload data, state an objective in plain English, and a team of AI agents plans the investigation, writes Python, runs it locally on your machine, inspects intermediate outputs, corrects errors, and saves the result as a reproducible Analysis Page.
Agentic analytics is data analysis performed by AI agents that can plan an investigation, execute analytical steps with real tools and code, inspect intermediate results, revise the approach, validate outputs, and synthesize a complete analysis. The distinction matters here. An answer is an output, an analysis is an investigation. For causal work, PlotStudio AI includes methods such as IV/2SLS alongside econometrics and survival analysis, and it profiles data on upload, flagging missingness, quality problems, and relationships across multiple datasets before estimation starts.
How a causal workflow runs
You'd phrase the question, review the proposed plan in Plan Mode, edit the treatment definition, outcome, or method if needed, then let execution proceed. The Analysis Page pairs plain-language interpretation and interactive charts with inspectable Python, statistical tests, and derived dataframes. Analyses stay searchable in the workspace and can reference past work through @-mentions and workspace insights. Export is to PDF or a reproducible Jupyter notebook. A built-in code editor lets you take over directly when you want manual control.
Privacy and deployment are practical strengths. Execution is local, and you can bring your own API key or use Azure OpenAI. I recommend it as a Julius AI alternative for researchers who care about multi-step analysis, local Python execution, methodology visibility, and reproducibility rather than turn-by-turn chat.
The limits are real. AI-generated analyses still require human review and domain judgment before results are relied on or published. Automation can scale undocumented assumptions just as easily as it scales good ones. The workflow also depends on a desktop application and access to an AI model provider, which may require setup or institutional approval. Use the plan review step. That's where causal credibility is won.
2. DAGitty
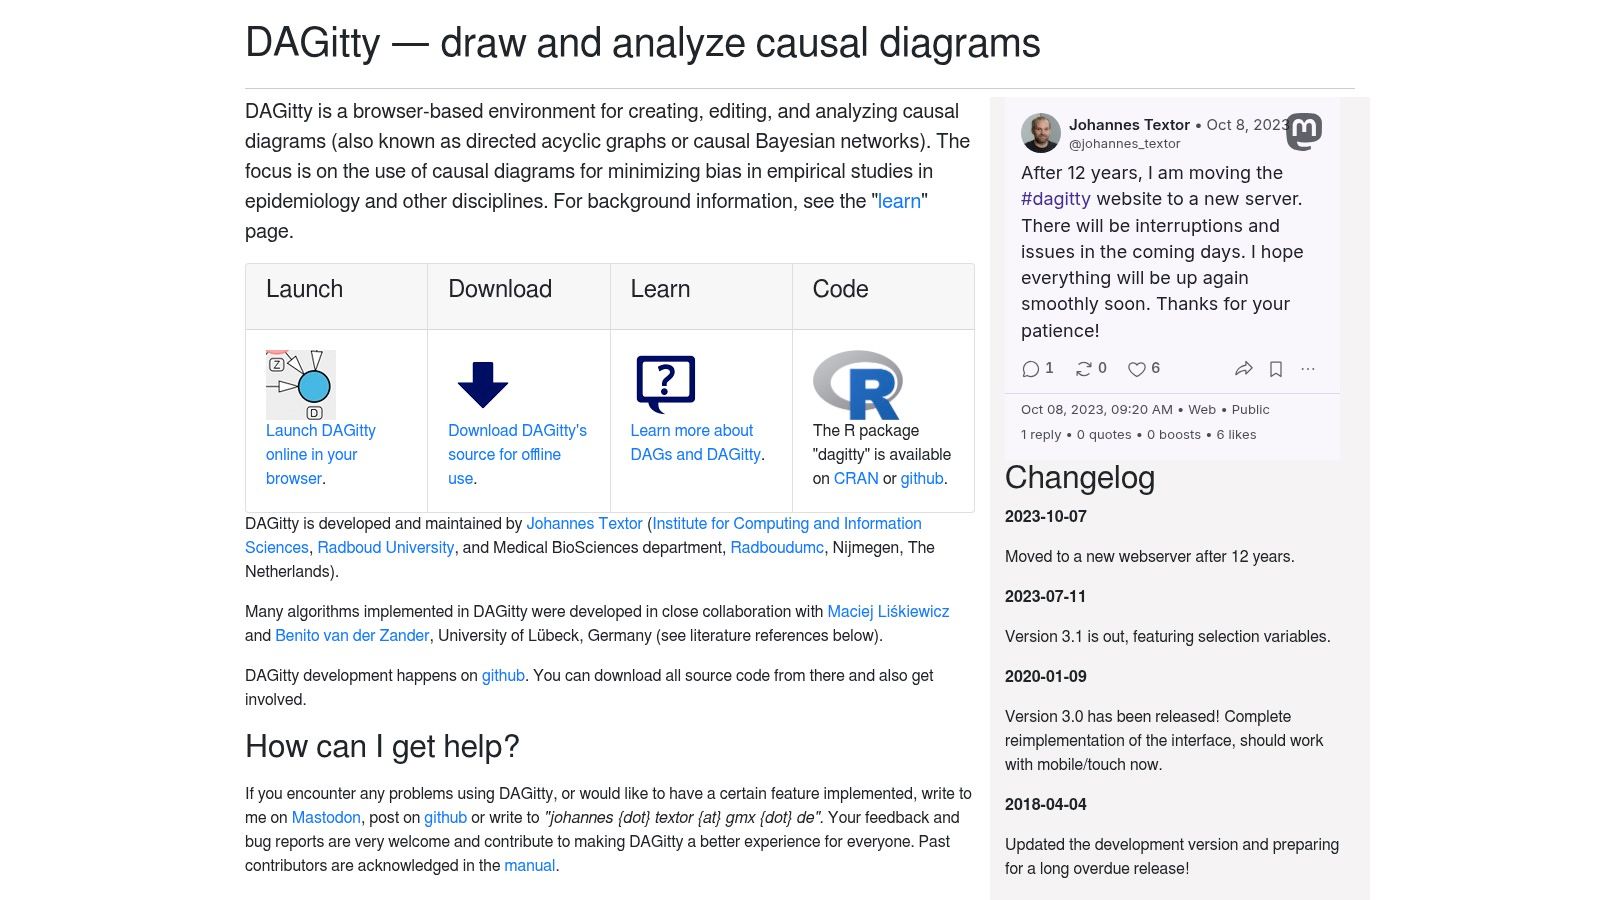
Start here if your assumptions only exist in your head. DAGitty is a browser-based editor for drawing and analyzing directed acyclic graphs. You place treatment, outcome, confounders, mediators, and colliders on the canvas, draw the arrows you believe exist, and the tool works out the consequences.
The practical payoff is adjustment sets. DAGitty tells you which variables you need to condition on to block backdoor paths, and which variables you must not condition on because doing so opens bias paths. It also surfaces testable implications from your graph, which gives you something to check against data later. For a structured walkthrough of that reasoning, see this guide to causal inference analysis.
- Browser-based editor: No installation, works in a standard browser.
- Adjustment set analysis: Shows minimal sets that identify your effect under the graph.
- Sharing and R support: Graphs can be shared by link, used offline, or manipulated through an R package.
It's free, it's accessible without a statistical environment, and it's widely used in epidemiology and other empirical fields. That accessibility makes it good for teaching and for co-author discussions, where a shared diagram ends arguments faster than a methods paragraph.
Don't mistake the diagram for evidence. A DAG encodes assumptions, it cannot establish that they're true. DAGitty also doesn't estimate effects for most research questions. Treat it as a design companion, then hand the graph to an estimation tool.
3. DoWhy
DoWhy is where I'd send Python users who keep skipping from data to regression. The DoWhy documentation separates four stages clearly. You model assumptions with a graph, you identify the estimand using graph criteria and do-calculus, you estimate it, then you run sensitivity checks. A coefficient isn't causal until the first two stages survive scrutiny.
Its intellectual lineage is the potential outcomes tradition. The history of the Rubin framework traces it from Jerzy Neyman's 1923 thesis on randomized experiments through Donald Rubin's 1974 extension to observational data. DoWhy operationalizes that lineage. The central problem is unchanged, estimating an unobserved counterfactual under explicit assumptions about treatment assignment and confounding.
Refutation is the differentiator
The DoWhy simple example shows refuters that deliberately break your analysis. A placebo treatment replaces the actual treatment with a random variable, and a credible estimator should return near zero. Other refuters add a random common cause, swap in a dummy outcome, or simulate data with a known effect. One documented example flags a refutation failure when its p-value falls below 0.05. For instrument-based designs, pair this discipline with the background in this instrumental variable regression guide.
DoWhy is free, open source, and connects to the wider PyWhy ecosystem, which keeps workflows scripted and reproducible. It requires Python fluency and real analyst judgment. Refuters are diagnostics, not proof. If your graph is wrong, DoWhy will implement the wrong graph faithfully.
4. EconML
Say you're evaluating a tutoring intervention and the average effect is near zero, but you suspect it helps students with low baseline scores and hurts no one. That heterogeneity question is EconML territory. Developed by Microsoft Research, it estimates conditional average treatment effects, so you can ask who responds rather than whether the average unit responds.
The estimator menu is broad. You get meta-learners, double and debiased machine learning, causal forests, and variable-based variants, all with Python APIs that feel familiar if you already use scikit-learn style tools. Interpreter utilities summarize how estimated effects vary across subgroups, which helps you avoid reading a forest plot one unit at a time.
Workflow snippet. Define outcome, treatment, and covariates. Choose an estimator that matches your design, for instance a doubly reliable learner for observational data under unconfoundedness. Fit it, then inspect effect heterogeneity by predefined subgroups before exploring data-driven ones. That ordering keeps you honest about multiple testing.
- Heterogeneous effects: Individualized and subgroup estimates are the core use case.
- Experimental and observational data: Estimators cover both settings.
- Free and documented: Open source, with worked example use cases.
Blunt limit. Flexible machine learning does not fix unmeasured confounding, weak overlap, or a broken design. It fits nuisance functions better. Identification still comes from your assumptions, and estimator choice still needs validation, preferably with simulated or benchmark data where truth is known.
5. DoubleML
Choose DoubleML when inference, not just prediction, is the deliverable. EconML asks how effects vary. DoubleML asks how precisely you can estimate a defined causal parameter when machine learning handles the nuisance parts. It ships Python and R implementations of double and debiased machine learning, built around cross-fitting so flexible learners don't contaminate your standard errors.
Supported model classes include partially linear models, interactive models, and instrumental-variable models, covering common treatment effect designs in economics and policy. Documentation extends to heterogeneous treatment effects and sensitivity analysis. Inference tools include bootstrap procedures, confidence intervals, and multiple-testing adjustments, which matters when you report several effects from one study.
Practical rule: If a reviewer will ask for a confidence interval on a specific parameter, reach for DoubleML before a general-purpose causal machine learning toolkit.
A typical sequence runs like this. Specify the model class that matches your estimand, plug in learners you already trust for outcome and treatment models, enable cross-fitting, then report the parameter with its interval. Swap learners as a sensitivity check. If the estimate swings wildly across reasonable learners, that's a finding, not a nuisance.
The trade-offs are plain. You need programming skill and a working understanding of the selected model's assumptions. There's no graphical interface and no help drawing your causal graph. Pair it with a design tool upstream. What you get in return is free, technically deep documentation and inference that respects the difference between fitting data and estimating a causal parameter.
6. CausalPy
Randomization was impossible, the policy already rolled out, and you still need a defensible effect estimate. CausalPy targets exactly that situation. It's an open-source Python package for quasi-experimental designs, built on PyMC for Bayesian estimation, so every result comes with uncertainty quantification rather than a bare point estimate.
The design coverage is its strength. You get difference-in-differences, synthetic control, regression discontinuity, interrupted time series, and variables in one package with consistent plotting and effect summaries, including credible intervals. If you're weighing a cutoff-based design, this overview of regression discontinuity design covers the identification logic you'd need before fitting anything.
Worked examples walk through each design end to end, which shortens the path from raw data to a first credible model. Applied researchers in policy, education, and health will find the framing natural, because the package is organized by research design rather than by estimator taxonomy.
Expect friction on two fronts. You need Python and genuine familiarity with your chosen design's assumptions, parallel trends for difference-in-differences, continuity at the cutoff for regression discontinuity. CausalPy won't check those for you in any deep sense. Some Bayesian models also take real time to sample, and installation requirements, particularly the PyMC stack, can complicate setup on managed machines. Budget setup time into project plans instead of discovering it mid-deadline.
7. CausalImpact
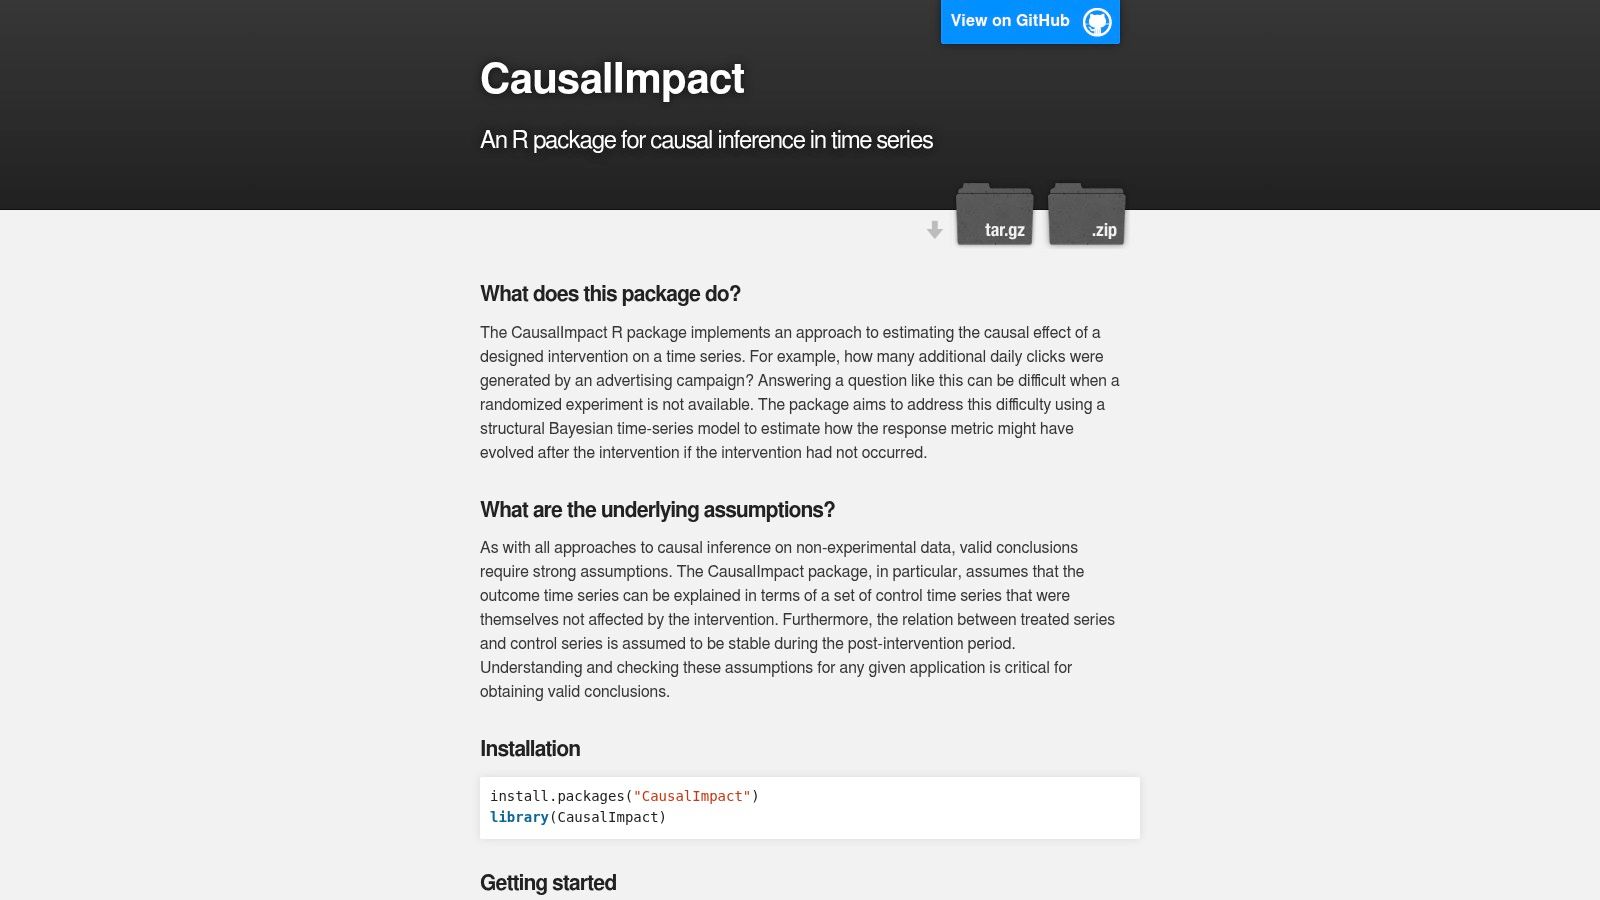
CausalImpact does one job well. It estimates what a time series would have done after an intervention if the intervention had never happened, then compares observed reality against that counterfactual. The CausalImpact documentation describes the engine as a Bayesian structural time-series model trained on the pre-intervention period with control series as predictors.
Two assumptions carry the whole analysis. Your control series must not themselves be affected by the intervention. And the relationship between treated and control series learned before the intervention must stay stable afterward. Violate either one and the counterfactual is fiction with credible intervals. Control selection and pre-period fit diagnostics aren't optional extras here, they're the analysis.
A sound workflow looks like this. Pick controls on substantive grounds, not by correlation fishing. Check pre-period fit and inspect residuals. Run the model, then report pointwise and cumulative effects with uncertainty. For background on the estimand framing behind treated-unit effects, see this explainer on the treatment effect on the treated.
It's free, backed by a published methodological paper, and available as an R package on CRAN with a referenced Python implementation. The focus is also the limit. This isn't a general treatment effect or causal discovery package. If your intervention lacks a clean start date or plausible unaffected controls, pick a different design rather than forcing this one.
8. Tetrad

Every tool above assumes you already have a causal structure. Tetrad asks the prior question. What structure might have generated this data? Developed at Carnegie Mellon University with partner research groups, it's a free suite for causal discovery and graphical causal modeling, with a desktop GUI plus command-line and programming interfaces.
The depth is unusual. More than 20 search algorithms cover different data types and modeling conditions, including settings with unmeasured confounders where algorithms return partial ancestral graphs instead of pretending everything is observed. You can encode prior knowledge, forbid impossible edges, run simulations with known structures, estimate parameters, and compare candidate models within one environment.
That simulation capability deserves emphasis. Generate data from a structure you specify, run your chosen search, and see whether it recovers the truth at your sample size. If it can't recover a known graph under friendly conditions, don't trust it on messy observational data.
A discovered graph is a set of candidate structures consistent with the data and your assumptions. It is not the causal truth, and presenting it as one will not survive competent peer review.
The GUI makes complex searches more approachable than code-only alternatives, and documentation reflects a long academic history. Results still depend heavily on assumptions, faithfulness, and data conditions, and they demand expert interpretation. The interface and method range take time to learn. Budget for that learning curve, and treat output as hypothesis generation for confirmatory work.
9. Causal Wizard
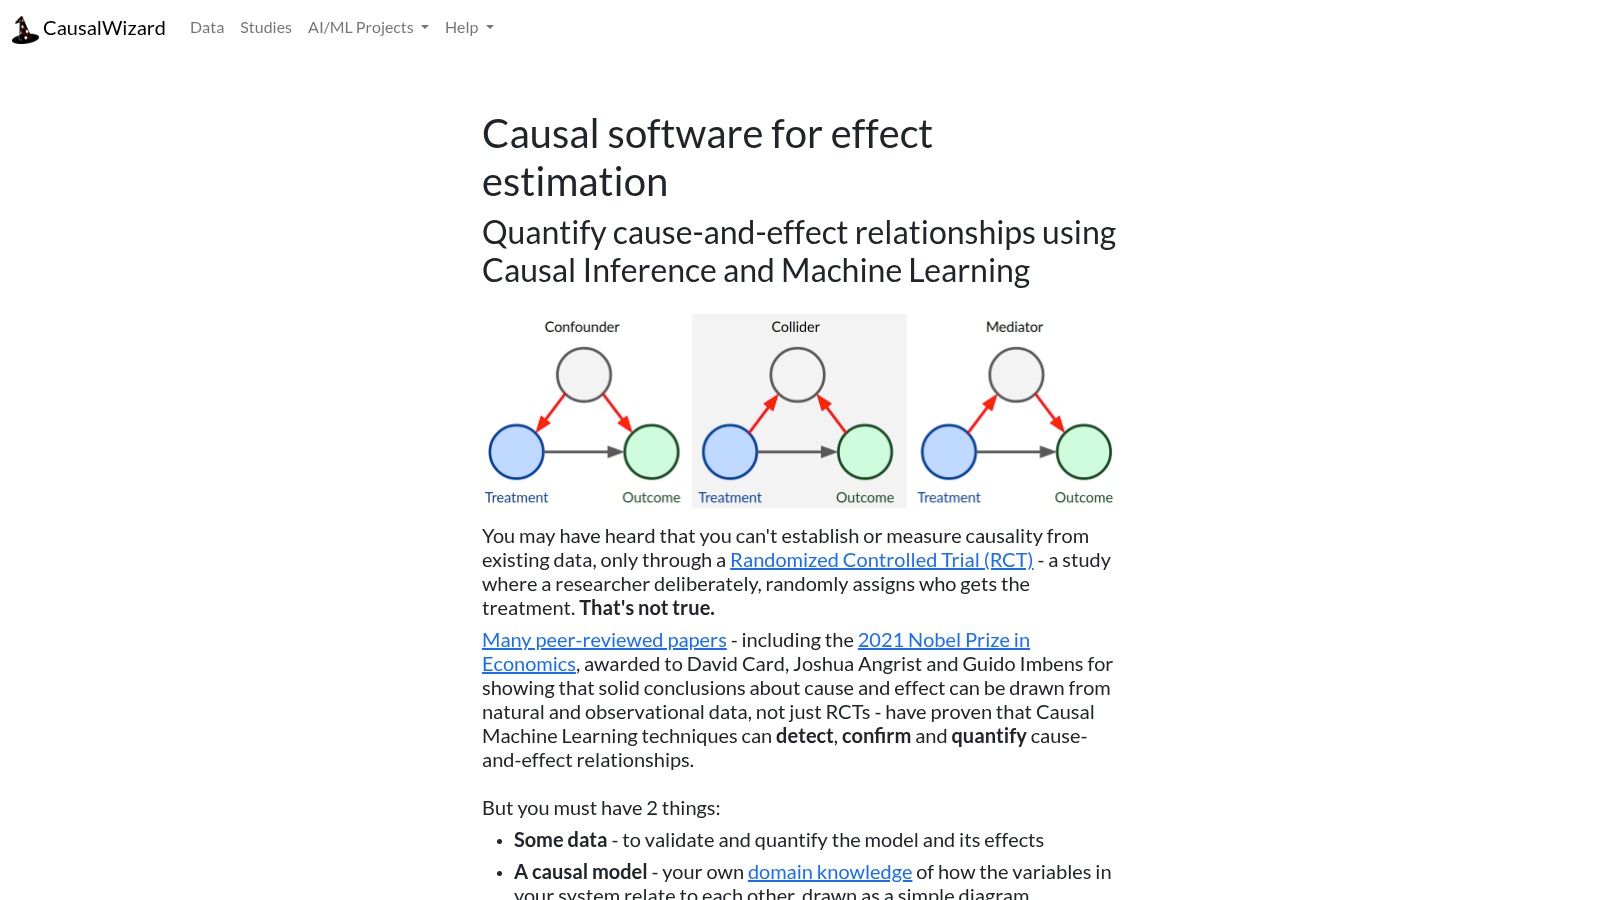
Not every researcher wants to assemble a Python pipeline before seeing a first estimate. Causal Wizard is a browser-based application that combines diagramming with estimation. You upload Excel or CSV data, define treatment and control groups, draw a causal diagram in the visual editor, and the app suggests an estimation approach based on your diagram and setup.
The project states that analysis runs in the browser, which is a meaningful privacy posture for a web tool, though you should still confirm data handling against your institution's rules before uploading sensitive research data anywhere. Export to a Jupyter notebook workflow is the feature I value most. It converts a point-and-click session into code you can inspect, rerun, and extend, which is where browser tools usually fail reproducibility.
- Visual diagram editor: Assumptions get drawn before estimation, which is the right order.
- CSV and Excel input: Matches how much research data arrives.
- Method suggestion: Lowers the barrier for researchers new to identification logic.
- Notebook export: Gives you an exit ramp into full programmatic control.
It's currently offered free, with no payment details required to sign up, though account registration is needed for some capabilities. Flexibility is the ceiling. Specialist R and Python libraries handle custom designs, unusual estimands, and bespoke diagnostics that a guided web app won't. And a suggested method is a suggestion. You still own the judgment about whether it fits your study.
10. IBM SPSS Amos

IBM SPSS Amos appears on causal software lists constantly, so let's be precise about what it is. It's commercial structural equation modeling software for path analysis, latent-variable models, and confirmatory factor analysis. If your research involves measurement models for constructs like job satisfaction or health literacy, with direct and indirect paths among them, Amos is built for that work.
The graphical modeling interface is familiar to many social-science researchers, and integration with the SPSS family plus commercial support suits departments already licensed for that ecosystem. You draw the path diagram, specify the measurement and structural components, and estimate everything jointly. For theory testing with latent variables, that workflow is efficient.
Now the warning that belongs in bold. SEM alone does not establish causal identification. A well-fitting model tells you the covariance structure is consistent with your specification. Many alternative structures, including reversed arrows, can fit the same data equally well. Causal claims need design, temporal ordering, and defensible assumptions, not fit indices.
Practical constraints also apply. Amos is Windows only, which matters for mixed-platform labs. It requires paid licensing, through standalone licensing or selected SPSS Statistics editions, with pricing depending on route and edition. I recommend it for measurement-model-heavy theory testing inside SPSS shops. For treatment effect estimation, reach for the estimation tools earlier in this list and keep Amos in its lane.
Causal analysis software compared by workflow role, coding burden, licensing, and fit
| Tool | Primary Role in a Causal Study | Coding Required | License | Best For |
|---|---|---|---|---|
| PlotStudio | AI-assisted analysis, including causal methods | No; optional Python editing | License terms not specified | Reproducible analysis with interactive results and code |
| DAGitty | Causal diagramming and adjustment-set analysis | No; optional R workflows | Free; license not specified | Clarifying assumptions and identifying potential bias paths |
| DoWhy | End-to-end causal effect analysis and refutation | Yes, Python | Free and open source | Programmable causal inference with explicit assumptions |
| EconML | Machine-learning estimation of heterogeneous treatment effects | Yes, Python | Free and open source | Estimating how treatment effects vary across people or groups |
| DoubleML | Double/debiased machine learning for causal parameters | Yes, Python or R | Free and open source | Causal inference with machine learning and statistical inference |
| CausalPy | Bayesian quasi-experimental analysis | Yes, Python | Free and open source | Applied intervention studies using quasi-experimental designs |
| CausalImpact | Time-series intervention effect estimation | Yes, typically R; Python implementation available | Free and open source | Estimating intervention effects with a suitable control time series |
| Tetrad | Causal discovery and graphical model exploration | No; GUI available, with programmatic options | Free; license not specified | Exploring plausible causal structures and comparing discovery models |
| Causal Wizard | Visual causal modeling and intervention effect estimation | No; exports to Jupyter notebooks | Currently free; license terms not specified | Getting started with diagram-guided effect estimation |
| IBM SPSS Amos | Structural equation modeling and path analysis | No; graphical interface | Commercial, paid license | GUI-based SEM, path analysis, and confirmatory factor analysis |
Matching Causal Analysis Software to Your Study and Your Role
No single causal analysis package fits every study. Choose tools by the stage of the work they support: setting assumptions, identifying and estimating effects, applying a specialist design, or exploring possible causal structures. Market estimates suggest growing interest, but they cannot tell you which method your research question supports. Fortune Business Insights values the causal AI market at approximately USD 55.9 million in 2025, projecting USD 1.06 billion by 2034 at a 39.2% compound annual growth rate. Mordor Intelligence estimates the global market at USD 79.69 million in 2025, while Polaris Market Research reports root-cause analysis at approximately 28.4% of the 2025 market. Treat these figures as directional context, not evidence for choosing an estimator.
A short decision matrix
Business analysts evaluating whether an intervention changed a metric can begin with DAGitty or Causal Wizard to make assumptions explicit, then select a design suited to the outcome. CausalImpact fits intervention questions with an appropriate control time series; CausalPy supports Bayesian quasi-experimental analysis. For recurring revenue questions, subscription metrics tools for startup teams cover the measurement layer, but those metrics alone do not establish causation.
Data scientists estimating heterogeneous treatment effects can use DoWhy to specify an identification strategy and conduct refutation checks, then use EconML to estimate effect variation. DoubleML is a better fit when the target is a causal parameter estimated with double or debiased machine learning. The DoWhy and EconML tutorial demonstrates how the frameworks can work together. Random assignment, with treatment represented as A=1 and no treatment as A=0, provides a strong basis for estimating effects. In observational studies, confounding can explain an association without a causal effect. A variable operates effectively only under substantive assumptions, including that it affects treatment, has no direct effect on the outcome, and is not associated with outcome drivers.
Academic researchers should favor tools that expose assumptions, estimands, and code. Auditability is part of the method, not a formatting preference. A review of causal applications in software engineering identified 45 relevant papers, of which 10 explicitly reported using R or statistical packages for regression. Related reviews found that estimands were often missing and assumptions unstated in software output. A companion survey of that literature described fragmented adoption, with only one research group showing sustained causal inference use over more than a decade. Inspectable code helps, but researchers still need to state the estimand and justify the identification strategy.
Consultants working across datasets need analyses that can be reproduced and defended after delivery. Choose a workflow that preserves the data transformations, code, diagnostics, and interpretation alongside the result. A saved report is useful only if its assumptions and limitations remain clear to the next reader.
Two workflow snippets that transfer everywhere
Diagram before estimator. Draw the causal graph, define the estimand, and check whether the effect is identifiable before fitting a model. Assumptions in observational studies are often not testable from the data alone. If the available variables do not identify the effect, report that limitation and describe what additional evidence would help. No estimator can recover an effect that the design does not identify.
Refute the headline effect. Test placebo treatments and dummy outcomes, use negative controls where appropriate, and run sensitivity analyses. Report how strong unmeasured confounding would need to be to change the conclusion. The CER 2025 review of AI in research discusses accuracy problems, bias, and proprietary data-collection algorithms that can hinder reproducibility. For AI-assisted work, retain prompts, model versions, generated code, and transformations so another analyst can inspect the process.
What to avoid
- Fitting a model before defining the causal question, treatment, outcome, and estimand.
- Treating refutation checks or SEM fit as proof that the effect is identified.
- Controlling for variables affected by the intervention, which can distort the counterfactual.
- Reporting generated output without review, especially proposed causal graphs and adjustment sets.
PlotStudio AI offers a desktop workflow for plain-English questions, with analysis planned and executed through local Python, inspectable code, and a permanent Analysis Page containing results and interpretation. Its free trial gives 30 free credits on sign-up, so you can run the workflow on a dataset you already understand and audit each step against your own analysis.