Censoring in survival analysis means you know only part of a subject's event time. For a right-censored patient, you know the event had not happened by the last follow-up, so the true time is at least that long. For left-censored or interval-censored data, you know the event happened before a date or between two dates. A censored row is incomplete, but it is not empty, and survival methods use what it tells you.
Censoring is the feature that separates survival analysis from ordinary regression. Almost every real study ends before every participant has the event. Patients move away, drop out, or are still event-free when the data are locked. If you handle those rows badly, every survival estimate you report will be wrong.
This article explains why censoring matters, defines the three types with examples, and shows how Kaplan-Meier handles censored data in a worked calculation. It then covers how to code censoring in your own dataset and the assumption behind it. Tools such as PlotStudio AI can run the analysis for you, but you still need to know what a censored observation is to check the result.
Why censoring matters in survival analysis
Censoring matters because deleting or mislabeling censored subjects gives you biased survival estimates, and nothing in the output warns you. Both common shortcuts understate how long people survive.
What censored data still tell you
A censored subject contributes real information. A patient censored at 18 months was alive and event-free for 18 months. Throwing that away wastes follow-up time, and counting it as an event invents an outcome that never happened.
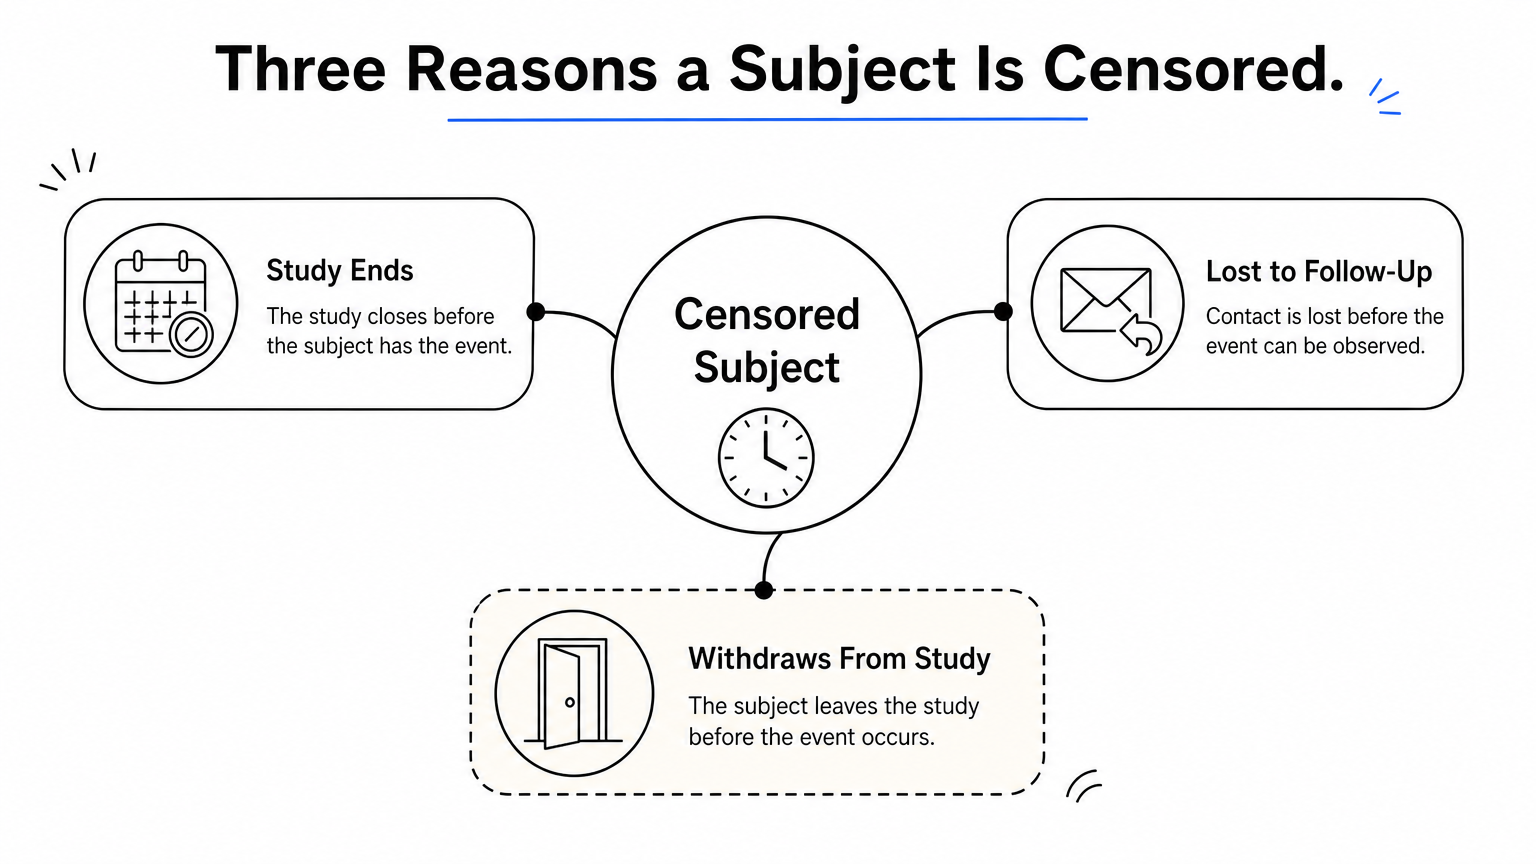
Censoring usually has one of three causes:
- The study ends before the subject has the event.
- The subject is lost to follow-up.
- The subject withdraws from the study.
What goes wrong when you ignore it
Take 10 patients followed for up to 24 months. Four have the event, at months 3, 5, 8, and 12. Six are censored: one at month 6 (lost to follow-up), one at month 10 (withdrew), one at month 18, and three at month 24 (study end). Two shortcuts both fail:
- Drop the censored patients. The mean survival time of the four events is 7 months, yet three of the ten patients were still alive at 24 months.
- Treat every censored time as an event. The mean is 13.4 months, which still ignores that survivors had not finished their story.
Censored subjects carry information about how long people lasted, so removing or relabeling them is a bias, not a simplification.
Types of censoring: right, left, and interval
The three types of censoring differ in what you know about the event time. Right censoring means the event is after your last observation. Left censoring means it happened before your first. Interval censoring means it happened between two observations.
The three types side by side
| Type | What you know | True time vs. observed | Example |
|---|---|---|---|
| Right | Event had not happened by the last contact | True time ≥ observed | Patient alive at study end |
| Left | Event happened before observation began | True time ≤ observed | First test is already positive |
| Interval | Event happened between two checks | Between the two times | Negative at 6 months, positive at 12 |
Right censoring and its subtypes
Right-censored data are by far the most common type in clinical research, because follow-up always has an end. Three versions appear in the literature. Type I censoring ends the study at a fixed date. Type II censoring stops after a fixed number of events. Random censoring covers dropouts and withdrawals at unpredictable times.
Right censoring is also what standard Kaplan-Meier curves and Cox models assume by default. If your data contain only right-censored observations, the usual tools apply directly.
Left and interval censoring
Left-censored data arise when the event has already happened at the first observation. You test someone and they are already infected, but you do not know when the infection began. Laboratory values below a detection limit are another left-censoring case.
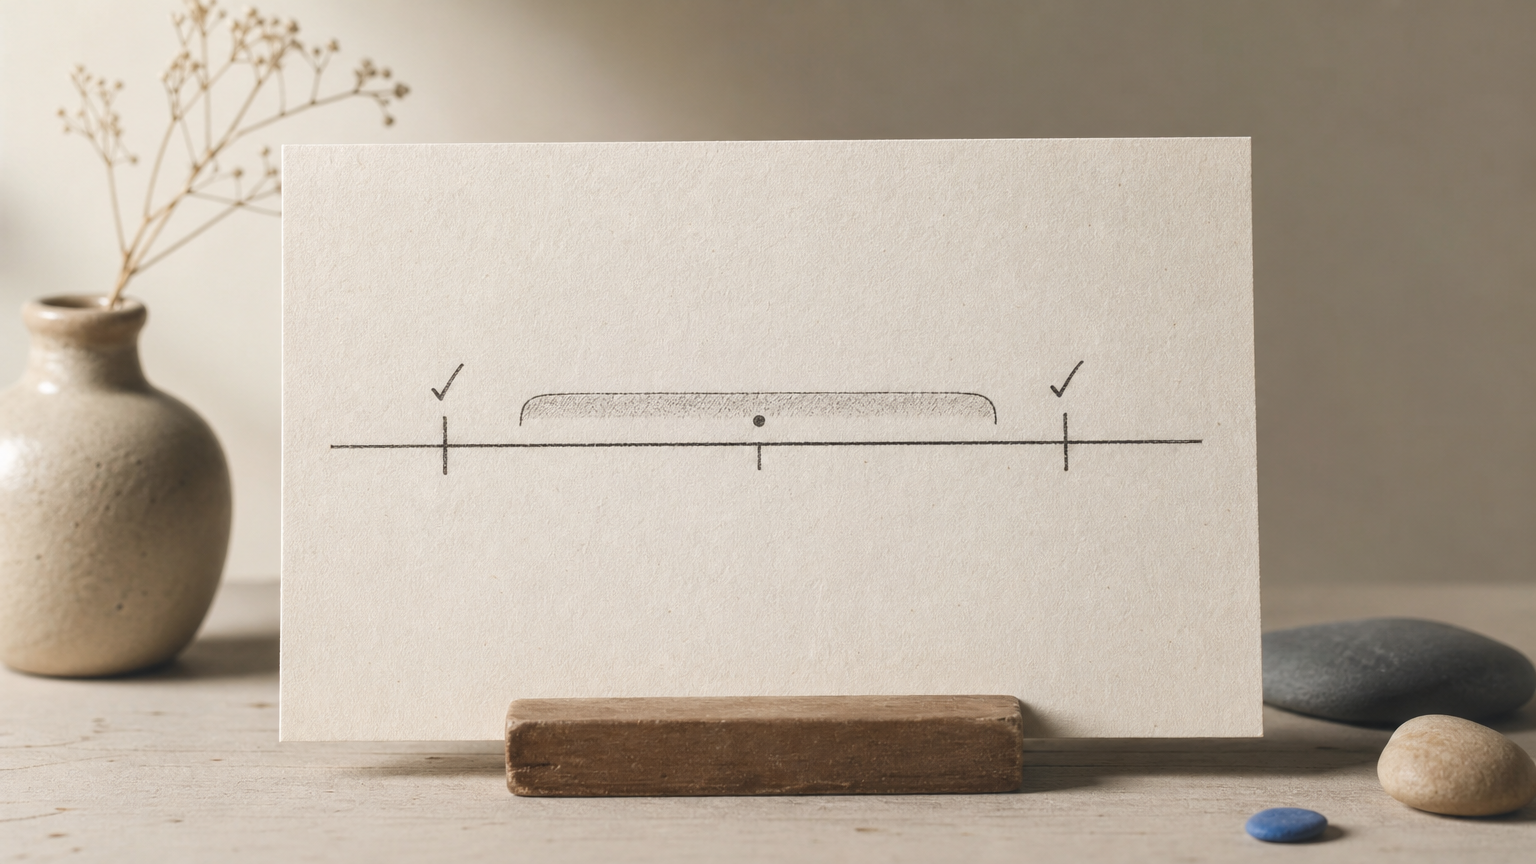
Interval censoring arises when you check subjects only at scheduled visits. A tumor absent at the 6-month scan and present at the 12-month scan appeared sometime in between. Do not confuse left censoring with left truncation. In truncation, subjects enter the study late, and you never see those who had the event before entry. That needs delayed-entry handling, not censoring.
Ask one question to classify any row: does the event lie after my last look, before my first look, or between two looks?
How Kaplan-Meier handles censored data
Kaplan-Meier handles censoring by keeping a censored subject in the risk set until the moment of censoring, then removing them without counting an event. The survival estimate is the running product of (1 − events ÷ at risk) at each event time.
The at-risk rule
At each event time, divide the number of events by the number of subjects still under observation. Censored subjects count in the denominator for every earlier event time. After their censoring time they leave the denominator and never enter the numerator. Censoring does not move the curve by itself. It lowers the at-risk count, which makes later steps larger.
A worked example
Using the 10 patients from earlier:
| Time (months) | Status | At risk | Events | Step | S(t) |
|---|---|---|---|---|---|
| 3 | Event | 10 | 1 | 9/10 | 0.900 |
| 5 | Event | 9 | 1 | 8/9 | 0.800 |
| 6 | Censored | 8 | 0 | none | 0.800 |
| 8 | Event | 7 | 1 | 6/7 | 0.686 |
| 10 | Censored | 6 | 0 | none | 0.686 |
| 12 | Event | 5 | 1 | 4/5 | 0.549 |
| 18 | Censored | 4 | 0 | none | 0.549 |
| 24 | 3 censored | 3 | 0 | none | 0.549 |
Estimated survival at 24 months is 54.9%. The curve never drops to 0.5, so the median survival time is not reached. The simple alternatives would have told you 0% or a mean of 7 months.
Reading the curve
Plots mark censored times with small ticks. Check the number at risk beneath the plot, because the right tail rests on very few subjects. A large block of censoring at one time can also cause a sudden jump or a long flat stretch. Kaplan-Meier is built for right-censored data. Interval-censored data need estimators designed for them, such as the Turnbull estimator.
Kaplan-Meier does not guess what happened to censored patients. It uses them only for the time they were observed.
How to handle censored data in your own analysis
To handle censored data correctly, record a time and an event indicator for every subject, fit a method that accepts censoring, and test whether the censoring is plausibly unrelated to the outcome.
Set up your dataset
Each row needs a start point, an end point, and a status. Compute one duration column and one event column coded 1 for event and 0 for censored. Mixing those codes up is the most common mistake, and it flips your curve. This Python sketch uses the lifelines package:
import pandas as pd
from lifelines import KaplanMeierFitter

df = pd.read_csv("trial.csv")  # columns: months, event (1 = event, 0 = censored)

kmf = KaplanMeierFitter()
kmf.fit(durations=df["months"], event_observed=df["event"])
kmf.plot_survival_function(show_censors=True)
print(kmf.median_survival_time_)  # inf means the median was not reached

# Reverse Kaplan-Meier: estimates typical follow-up time
rkm = KaplanMeierFitter()
rkm.fit(df["months"], event_observed=1 - df["event"])
print(rkm.median_survival_time_)
The second fit flips the labels, so it measures follow-up rather than survival.
Check the independence assumption
Standard methods assume independent, non-informative censoring. Subjects who leave the study must have the same future risk as those who stay. If the sickest patients drop out, the remaining group looks healthier and survival is overstated.

Compare how many subjects were censored in each arm, and when. Look at baseline differences between completers and dropouts. If dropout is plausibly tied to prognosis, run a sensitivity analysis, for example by treating dropouts as events, to see how far the conclusion moves.
Running it in PlotStudio AI
In PlotStudio AI, you upload the dataset and ask for a Kaplan-Meier analysis in plain English. It applies survival methods such as Cox proportional hazards where suitable. Verification Mode lets you review the plan before it runs, and you can inspect the generated Python. Confirm the event coding and the censoring assumption yourself, because the tool cannot judge your study design for you.
The software can fit the curve, but only you can say whether the censoring was ignorable.
What to remember about censoring
Censoring means an event time is only partly known: after the last observation (right), before the first (left), or between two checks (interval). Censored data should never be dropped or relabeled as events. Kaplan-Meier keeps censored subjects at risk until they leave, and the result stays valid as long as censoring is unrelated to prognosis.
Before you analyze, code each row with a time and a 1/0 event indicator. Then check how many were censored, when, and why. Report the number at risk, and be careful where the curve rests on a handful of patients.
If you have a dataset ready, you can run your own Kaplan-Meier analysis in the PlotStudio AI free trial and inspect the code and censoring assumptions yourself.