Your CRM says a customer expanded. The product database shows low usage. Finance has a spreadsheet with a different account name, and support logs sit in a SaaS tool nobody joined correctly. Data integration solutions fix that fragmentation by combining data from multiple systems into a usable, governed view for analysis. For teams doing serious work in PlotStudio-style agentic analytics, that matters because an answer from one table isn't enough. An analysis needs consistent joins, clear lineage, and data you can trust.
Most analysts run into this long before they call it “integration.” They call it “why are these numbers different again?”
A practical version of the problem looks like this: customer IDs don't match across systems, timestamps use different time zones, one source stores revenue by invoice, another by booking, and the dashboard still expects a single metric. If you're also trying to expand financial tools via integrations, the issue gets broader. The harder part usually isn't adding another connector. It's preserving meaning while data moves.
Table of Contents
- Introduction to Data Integration Solutions
- What Data Integration Solutions Are and How They Work
- Core Architectures and Patterns Compared
- Deployment Models Governance and Security Essentials
- How Integrated Data Powers Analytics and Agentic Workflows
- Evaluation Checklist Roadmap and Pitfalls to Avoid
- Frequently Asked Questions About Data Integration Solutions
- How can we integrate data without expanding risk?
- Can data integration solutions keep pace with AI-ready analytics?
- What architecture best supports auditable cross-system analysis?
- How do we handle legacy systems in a modern integration stack?
- What should analysts ask for before trusting integrated data?
Introduction to Data Integration Solutions
Data integration became a major software category because this problem stopped being a niche IT concern. One market estimate puts global revenue at USD 13.13 billion in 2025, projected to reach USD 22.17 billion by 2031, implying a 9.12% CAGR over 2026 to 2031. The same report estimates cloud deployment at 58.74% of 2025 revenue, large enterprises at 55.62%, tools at 63.85% of spending, North America at 38.35% of 2025 revenue, and Asia-Pacific as the fastest-growing region at 17.78% CAGR. Those figures make one point clearly. Integration now sits in the core enterprise stack, not in the basement of the architecture diagram (Mordor Intelligence market report).
The real job behind the label
People often hear “data integration solutions” and think “software that moves rows from A to B.” That's too narrow.
A useful integration layer has to do at least four things:
- Connect systems reliably so data can be extracted without constant manual work.
- Standardize structure so fields with different names, types, and formats can align.
- Preserve meaning so “customer,” “order date,” or “active user” doesn't change across datasets.
- Support downstream use in BI, notebooks, models, and operational workflows.
Integrated data is only valuable when someone can explain where it came from, what changed, and why a join is valid.
What a good decision looks like
The best integration choice usually isn't “the most connectors.” It's the pattern that fits your latency needs, governance requirements, and analysis workflow.
If you need a daily finance pack, a batch approach may be fine. If you need fresh product telemetry merged with support events for anomaly detection, you'll care about lower-latency patterns and schema-change handling. If you're building analysis for regulated or sensitive work, trust controls move from “nice to have” to “design requirement.”
That's where selection usually gets harder. Teams compare ETL, ELT, CDC, streaming, cloud versus hybrid deployment, and a long feature matrix. The right way through it is simpler. Start with the shape of the analysis you need, then work backward to the integration pattern that can support it without creating brittle pipelines.
What Data Integration Solutions Are and How They Work
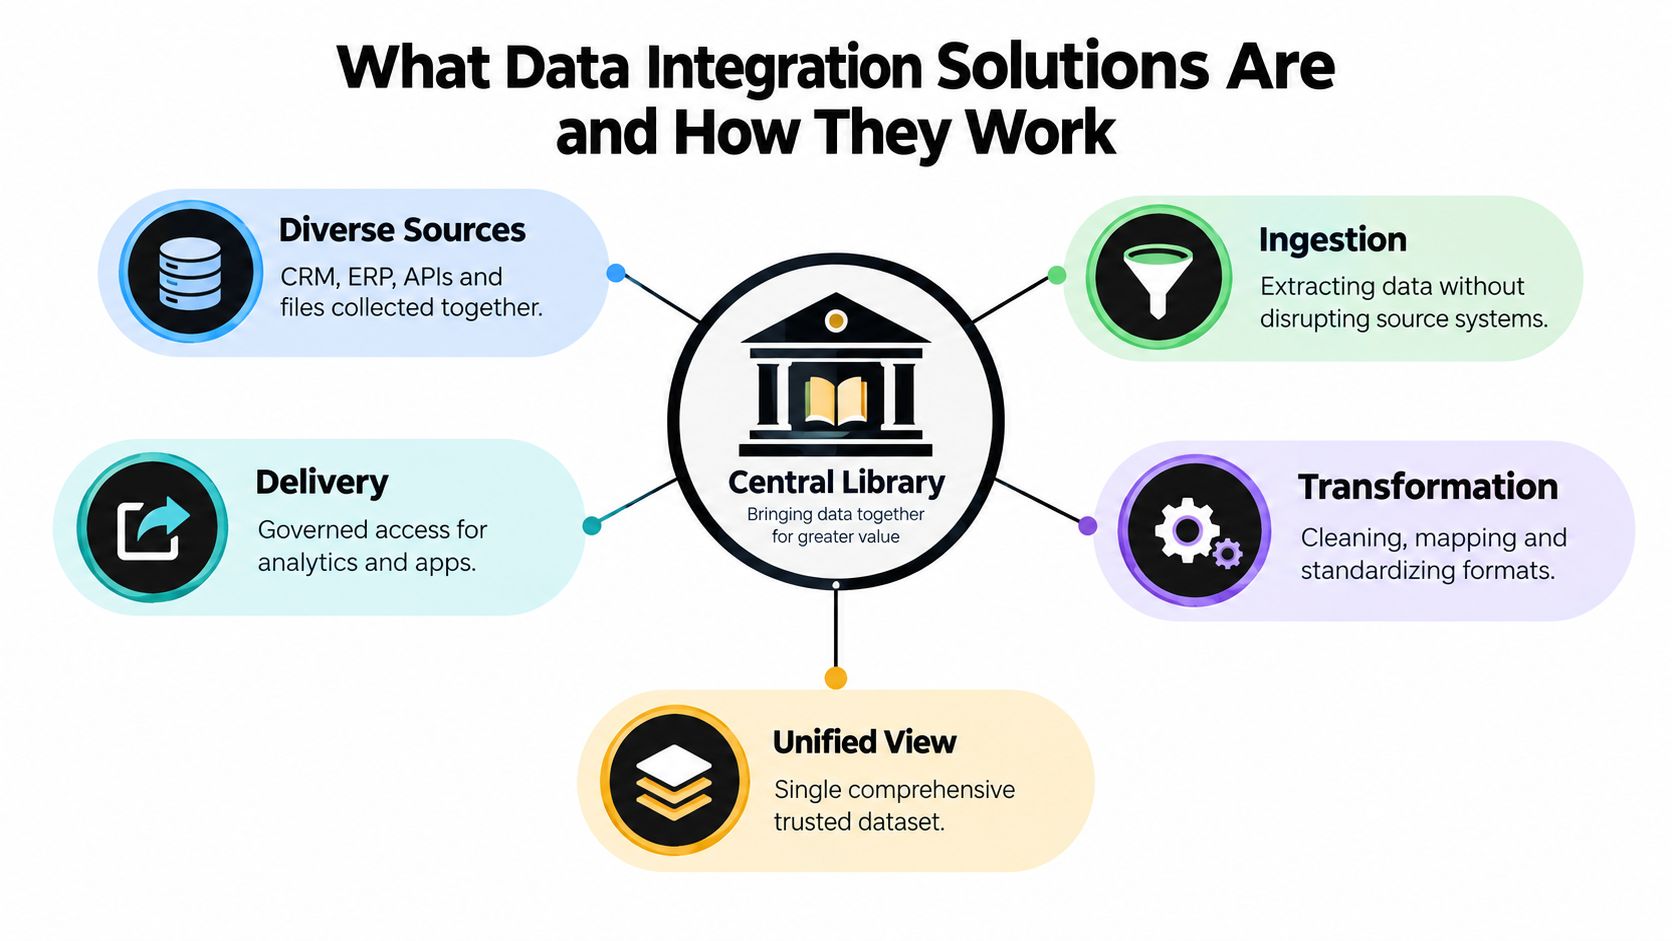
At the simplest level, data integration solutions bring data together from different sources into a single view. That definition sounds obvious until you try to do it with CRM records, billing exports, event logs, survey CSVs, and API feeds that all describe the same customer differently.
A good analogy is a research library. A library doesn't rewrite every book into one format. It catalogs, classifies, and links materials so researchers can find what belongs together and use it confidently. Integration works the same way. It doesn't just move data. It organizes access to data so analysis can start from something coherent.
What gets integrated besides rows
Analysts often focus on tables and forget the surrounding context. That's where confusion starts.
Integration has to reconcile more than records:
- Schemas such as field names, types, and table structures.
- Metadata such as owners, refresh rules, lineage, and validation status.
- Semantics such as whether “revenue” means booked, billed, or recognized revenue.
- Operational rules such as deduplication logic, key selection, and late-arriving data handling.
If your goal is to unify customer data for growth, those semantic details matter as much as the raw connection itself. A “360 view” assembled from inconsistent business definitions just gives you a polished version of confusion.
Where integration sits in the stack
Organizations encounter integration between source systems and consumption tools. Sources may include databases, SaaS products, files, and event streams. On the other side sit dashboards, notebooks, machine learning workflows, and decision systems.
That middle layer usually handles ingestion, transformation, quality checks, mapping, and delivery into a warehouse, lake, mart, or analysis-ready dataset. If you want a deeper look at the transformation step specifically, this overview of data transformation software is a useful companion.
Practical rule: If analysts keep rebuilding the same cleaning and joining logic in every notebook, your integration layer isn't doing enough.
Why the category expanded
Historically, integration grew out of ETL. Organizations wanted one analytical view instead of many fragmented operational systems. By the 1990s and 2000s, ETL became standard for enterprise data warehouses. Then cloud platforms, APIs, and streaming data changed the problem. Teams no longer wanted only overnight loads. They wanted hybrid patterns that could serve both historical reporting and fresher operational analysis.
That shift shows up in current market estimates. One report places the global market at USD 17.58 billion in 2025 and projects USD 33.24 billion by 2030 at a 13.6% CAGR. The same source estimates the U.S. market at USD 6.13 billion in 2025, rising to USD 10.77 billion by 2030 at an 11.9% CAGR (MarketsandMarkets data integration market analysis).
Core Architectures and Patterns Compared
The fastest way to make a poor integration decision is to ask, “Which pattern is best?” The useful question is, “Best for what latency, what transformations, and what operational risk?”
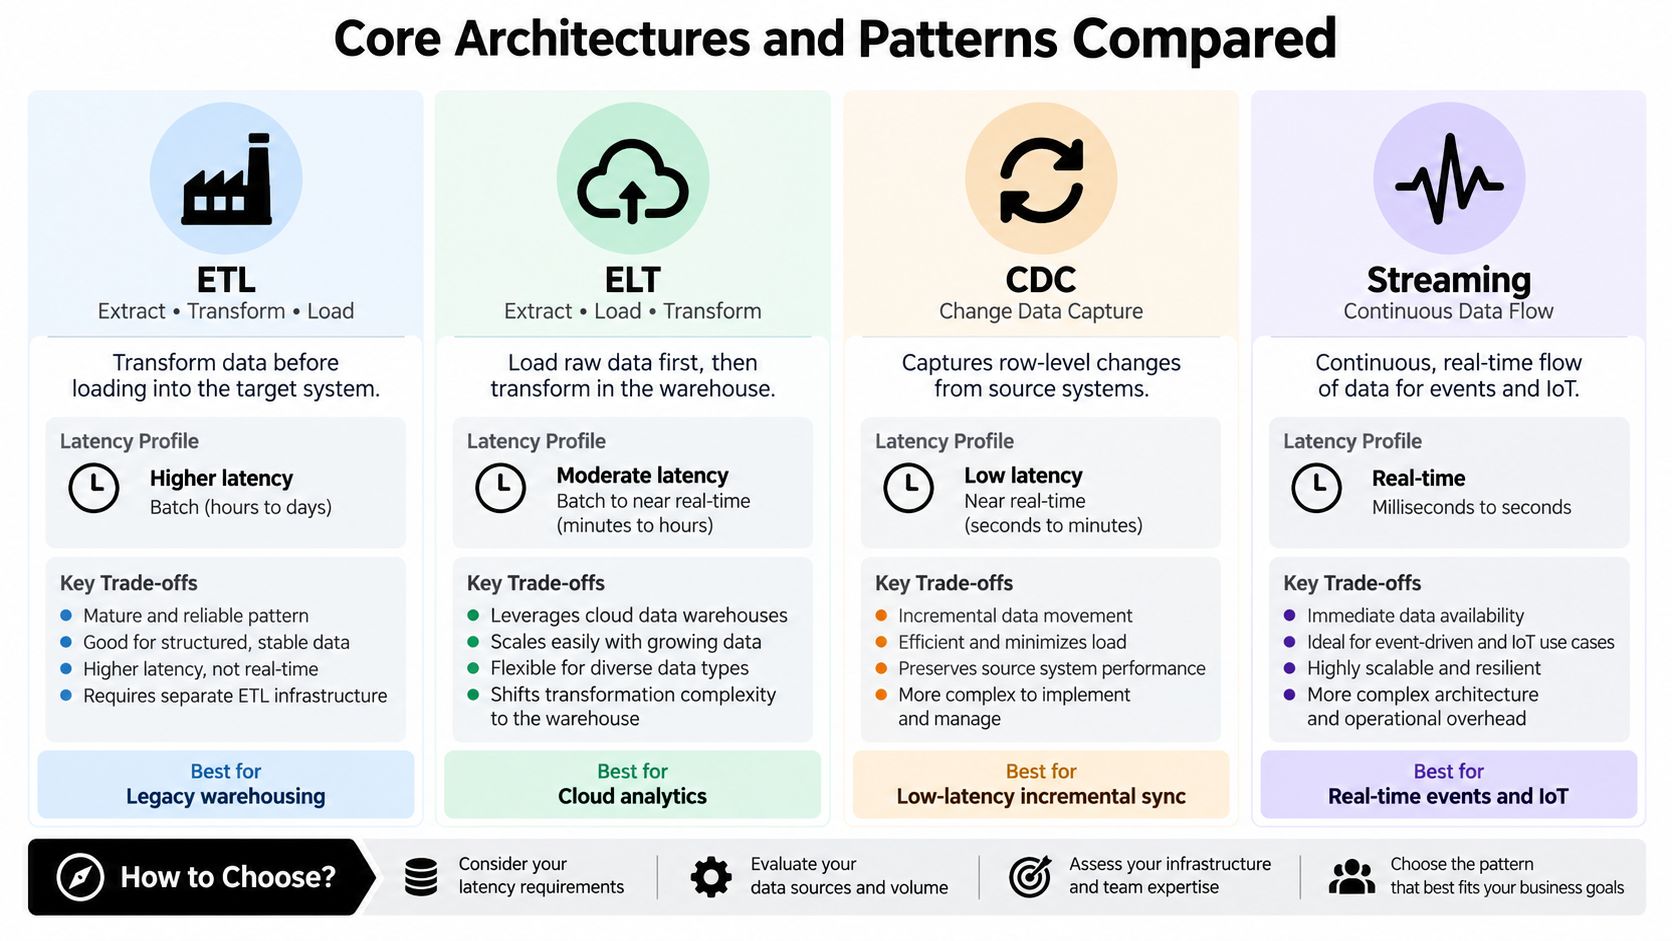
Here's the visual summary first.
The four common patterns
ETL extracts data, transforms it before loading, and then publishes a curated result. It's familiar, controlled, and still useful when transformations are heavy or staging requirements are strict.
ELT loads raw data first and transforms inside the warehouse or lakehouse. This fits cloud analytics well because compute can scale where the data already lives.
CDC captures changes from database transaction logs rather than repeatedly polling or rescanning tables. That changes both source impact and freshness.
Streaming continuously moves event data as it arrives. It's the natural fit for telemetry, clickstreams, IoT, and other event-oriented systems.
A companion piece on data warehouse architecture can help if you're mapping these patterns into a broader warehouse or lakehouse design.
ETL vs ELT vs CDC vs Streaming at a Glance
| Pattern | Latency | Source Load | Best For |
|---|---|---|---|
| ETL | Batch windows, typically minutes to hours | Moderate, depends on extract design | Heavy transformations, regulatory staging, legacy warehousing |
| ELT | Batch to near-real-time, depending on load schedule | Often lower than repeated transformed extracts | Cloud analytics, flexible downstream modeling, raw data retention |
| CDC | Sub-second to low-second freshness | Lower, because it reads transaction logs instead of rescanning tables | Near-real-time joins, fresh dashboards, anomaly detection |
| Streaming | Continuous real-time flow | Varies by architecture and event source | Event pipelines, telemetry, operational reactions |
CDC deserves special attention because it solves a problem analysts feel directly. Log-based change data capture is the most latency-optimized pattern for operational data pipelines because it reads transaction logs instead of polling or rescanning source tables. Independent technical summaries describe CDC as delivering sub-second to low-second freshness, while batch ETL is usually bounded by minutes-to-hours batch windows. That freshness gap is why decisions get made earlier in real-time integrations, not because the charts are prettier (CDC vs ETL vs ELT patterns).
To see the concepts explained visually, this walkthrough is helpful:
How to choose without overengineering
CDC is a strong default when analysts need fresh dashboards, near-real-time joins, or rapid anomaly detection across systems and don't want repeated extracts placing extra load on source databases.
ETL still wins in common cases:
- Heavy transformation first: You may need complex standardization before data should land anywhere downstream.
- Regulatory staging: Some workflows require strict preprocessing and approval before data is made broadly available.
- Schema instability: Raw landing zones can become chaotic if source changes are frequent and poorly managed.
Streaming is often misunderstood. It's not just “faster CDC.” It's usually event-first architecture. If your source of truth is a stream of events rather than a mutable transaction table, streaming is the natural pattern. If your systems are still operational databases, CDC may be a more direct fit.
If your analysts mostly ask “what changed since this morning,” CDC solves a different problem than ETL. If they ask “can we certify this curated finance dataset before release,” ETL may be the safer answer.
Deployment Models Governance and Security Essentials
Teams usually spend too much time on connectors and too little on trust. That's backward. A pipeline that moves data quickly but obscures meaning, ownership, and access control is expensive to maintain and risky to use.
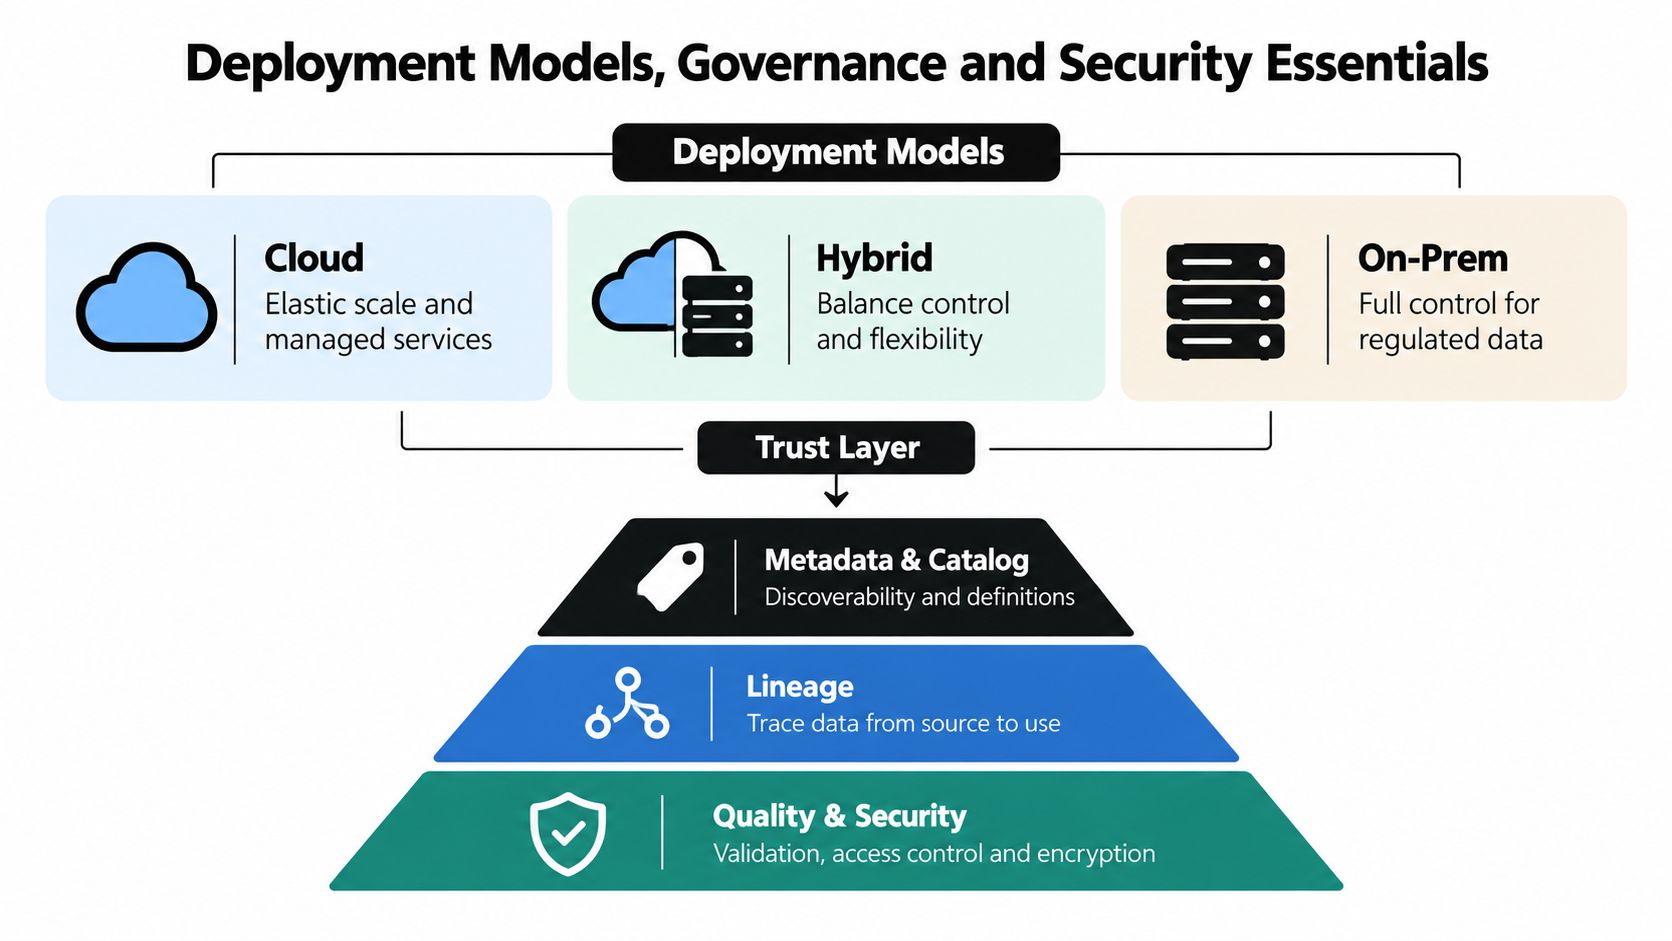
Deployment model and governance design meet.
Cloud hybrid and on-prem trade-offs
Cloud deployment offers elasticity and managed services. It's often the fastest route to broad connectivity and scalable transformation.
Hybrid matters when some systems must stay on-prem while analytics and applications live in the cloud. This is common in large organizations with legacy estates.
On-prem stays relevant where regulated data, sovereignty requirements, or internal policy limit where data can run.
Those choices affect more than infrastructure. They determine where logs live, how credentials are managed, whether lineage crosses boundaries cleanly, and how painful incident response becomes when joins break.
Governance is part of the integration layer
Metadata governance isn't overhead. It's a technical prerequisite for scalable integration.
The European Union's metadata governance methodology defines metadata governance as a combination of roles, responsibilities, policies, and decision-making processes that regulate the full metadata lifecycle. TOGAF guidance also includes metadata integration functions for ingesting metadata from multiple sources and distributing it to other applications. In practice, that means integration tools should expose cataloged schemas, schema-change detection, validation workflows, and compliance reporting, because otherwise technically correct pipelines can still create ambiguous joins or silent semantic drift (EU metadata governance methodology).
A grounded overview of related operating models appears in this discussion of data governance frameworks.
The blockers practitioners actually hit
A recurring gap in data integration content is that it over-explains movement and under-explains control. Recent survey reporting points in the same direction. Security and governance were the biggest integration obstacles at 56% and 44% in one study, and 53% of executives in another survey said integrating AI infrastructure with legacy systems derailed target outcomes (survey summary on top data integration challenges).
That aligns with what breaks projects in practice:
- Permissions are under-scoped or over-broad. People either can't use the data they need, or too many people can.
- Lineage is missing. When a metric changes, no one can trace which source or transformation caused it.
- Legacy coexistence is ignored. New pipelines assume clean source contracts that old systems don't have.
- Schema changes arrive without warning. A renamed field or changed type breaks joins without immediate visibility.
Good integration design reduces the number of arguments analysts have about whether a number is safe to use.
How Integrated Data Powers Analytics and Agentic Workflows
Integrated data isn't valuable because it exists in one place. It becomes valuable when analysts can move from assembled data to defensible conclusions.
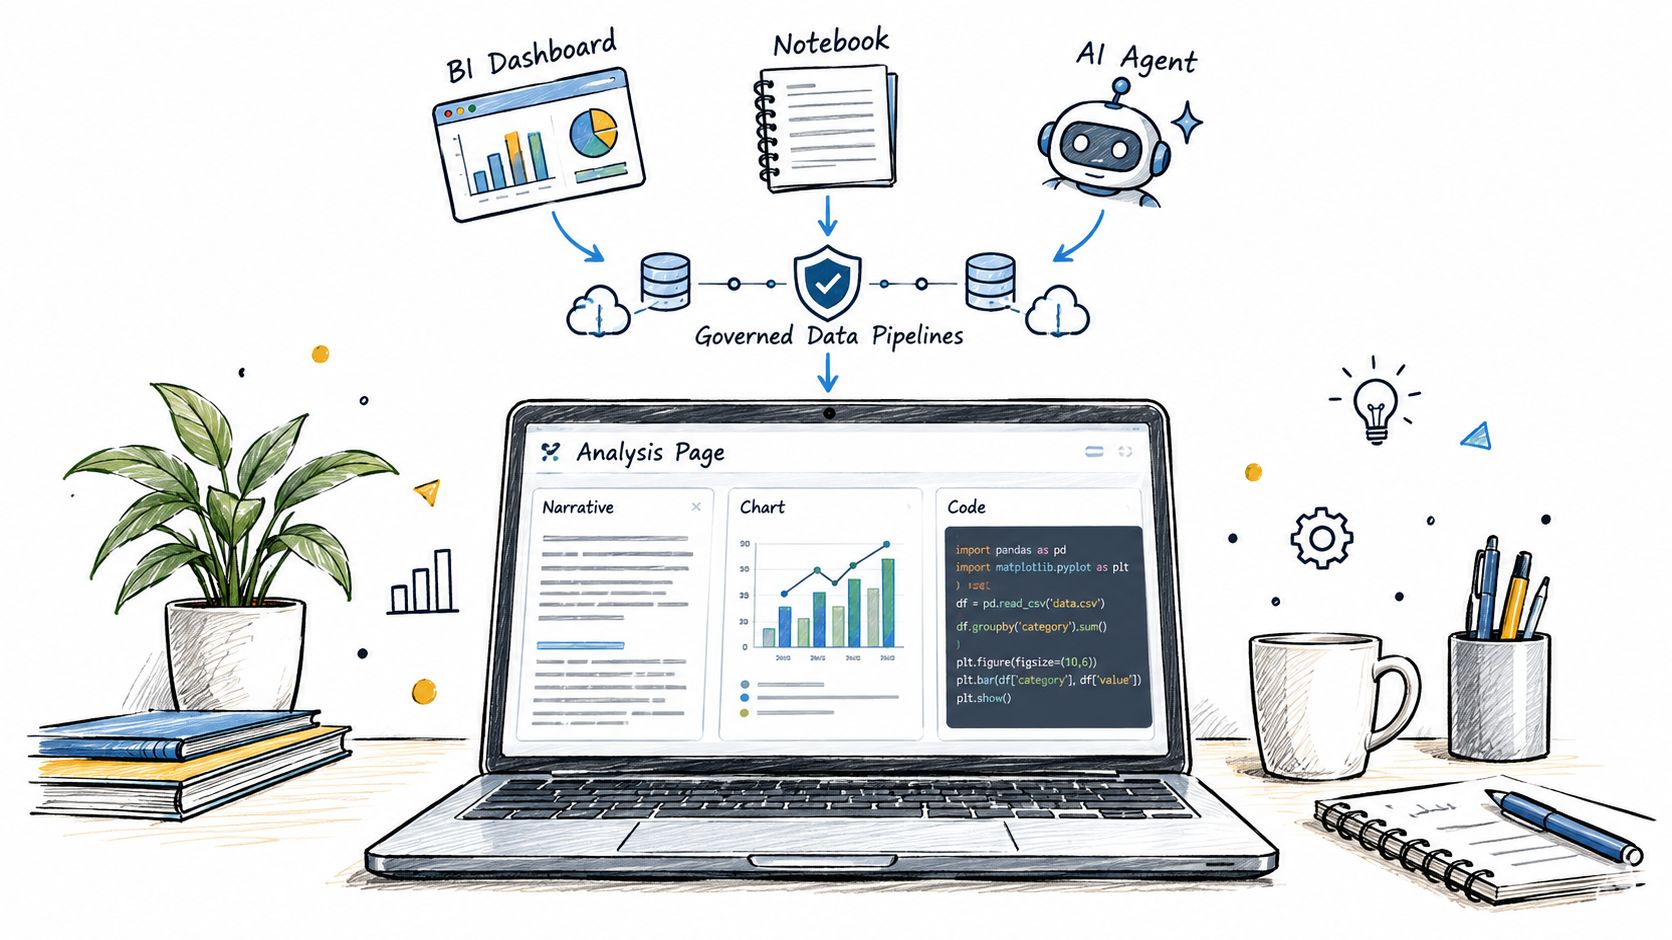
That means different things for different workflows. A BI dashboard might need a stable metric layer. A notebook workflow might need denormalized extracts with clear lineage. An AI-assisted analysis environment needs something stricter still. It needs data that's not only accessible, but analysis-ready and auditable.
From integrated data to actual analysis
Consider three realistic tasks:
- Churn driver analysis: You join CRM attributes, product usage events, support tickets, and renewal outcomes. If entity resolution is weak, your model learns on mismatched customers.
- A/B test readout: You need exposure logs, experiment assignment, transaction outcomes, and guardrail metrics aligned at the right grain. A valid p-value won't rescue bad joins.
- Time-series anomaly review: You merge operational events with commercial metrics. If refresh timing differs across systems, a “spike” may be a load artifact rather than a business event.
This is why teams increasingly care about analysis-readiness, not just movement. Benchmark-style reporting has highlighted the persistence of this issue. 97% of enterprises still say data integration remains a challenge, while other survey findings in the same discussion point to disparate sources, cloud-to-on-prem integration, and data quality as recurring pain points (enterprise benchmark discussion).
Why agentic workflows raise the bar
An agentic workflow is not “chat with your data” plus a nicer interface. It's a workflow where the system plans a sequence of analytical steps, writes and runs code, checks outputs, and produces a saved result rather than a one-off response.
That difference matters because a one-shot answer can tolerate hidden assumptions longer than a multi-step analysis can. Once a system is doing joins, filtering, transformations, tests, charts, and narrative synthesis across several steps, poor integration quality surfaces quickly.
A useful overview of this broader category appears in this article on AI-powered analytics.
Why local reproducibility changes the criteria
For sensitive or high-stakes work, the integration conversation also changes when the analysis layer runs locally and keeps an inspectable record.
That's one reason the independent review by The Effortless Academic is notable. It describes a purpose-built, analyst-grade workflow rather than a generic chatbot experience, including autonomous analysis behavior, automatic data-quality evaluation, and publication-ready output. For researchers and analysts, that combination shifts the question from “Can the tool answer my prompt?” to “Can I inspect and reproduce what happened?”
The tighter your integration layer is, the more useful autonomous analysis becomes. The looser it is, the faster automation can amplify bad assumptions.
Evaluation Checklist Roadmap and Pitfalls to Avoid
Most integration projects don't fail because nobody bought software. They fail because the team never agreed on what “working” meant.
A useful evaluation starts with a blunt question: what decisions or analyses must this system support without manual repair every week? Once that's clear, selection gets sharper.
A practical checklist for selecting data integration solutions
Use this as a working screen, not a procurement ritual:
- Connectivity fit: Can it connect to your actual systems, including awkward legacy sources and file-based inputs, not just modern SaaS APIs?
- Latency fit: Do you need hourly reconciliation, daily finance reporting, or near-real-time operational visibility?
- Semantic fit: Can it preserve business definitions, ownership, and lineage, or will analysts still rebuild context manually?
- Quality controls: Does it detect schema drift, failed loads, broken joins, and suspicious null patterns before users discover them?
- Governance depth: Are permissions, auditability, validation workflows, and compliance reporting built in or bolted on?
- Operational resilience: How hard is it to rerun jobs, backfill history, or recover from partial failure?
- Consumer fit: Will the outputs feed dashboards, notebooks, statistical workflows, and reproducible analyses cleanly?
A rollout roadmap that stays sane
A phased rollout is usually safer than a “connect everything” launch.
- Profile first. Inventory sources, key fields, refresh behavior, and known semantic conflicts.
- Pilot one decision workflow. Churn reporting, finance reconciliation, or experiment analysis are good candidates because success is testable.
- Define contracts. Lock down join keys, business definitions, and data quality checks.
- Operationalize monitoring. Track failures, freshness, schema changes, and ownership.
- Expand by domain. Add new systems only after the first workflow becomes stable and trusted.
One market projection from Grand View Research estimates the category at USD 15.18 billion in 2024, reaching USD 30.27 billion by 2030 with a 12.1% CAGR from 2025 to 2030. That growth fits what many teams feel directly. Integration is no longer only plumbing. It's part of how organizations prepare data for more automated analysis workflows (Grand View summary via Integrate.io).
Pitfalls that quietly create debt
The common traps are usually mundane:
- Brittle pipelines: A field rename breaks a dependency chain nobody documented.
- Unowned logic: The dashboard team assumes finance owns a metric. Finance assumes data engineering does.
- Permission shortcuts: Temporary broad access becomes permanent policy.
- No durable outputs: Analysts keep redoing the same joins and checks because prior work wasn't saved in a reusable, inspectable form.
Success looks boring in the best way. Analysts stop debating which source is right. Reproducible outputs accumulate. New work starts from a trusted base instead of from another emergency export.
Frequently Asked Questions About Data Integration Solutions
How can we integrate data without expanding risk?
Treat permissions, lineage, validation, and metadata as first-order requirements. If those controls arrive after the pipeline goes live, risk usually expands before governance catches up. The safer pattern is to define access boundaries and auditability at the same time you define movement.
Can data integration solutions keep pace with AI-ready analytics?
Yes, but only if “AI-ready” means more than connector coverage. The hard part is producing governed, analysis-ready data quickly enough for iterative analytical workflows. A pipeline that moves data fast but leaves unclear semantics or unstable joins will slow serious AI-assisted work.
What architecture best supports auditable cross-system analysis?
For many operational systems, CDC is a strong fit when freshness matters and source load must stay low. ETL remains better when heavy transformation, formal staging, or stricter release control matters more than immediacy. The right answer depends on whether timeliness or curation is the dominant constraint.
How do we handle legacy systems in a modern integration stack?
Assume coexistence, not replacement. Legacy systems often fail modern expectations around identifiers, schemas, and APIs. Build explicit mapping, quality checks, and ownership around those weak points instead of pretending they'll behave like cloud-native sources.
What should analysts ask for before trusting integrated data?
Ask for join logic, business definitions, refresh timing, lineage, schema-change handling, and validation history. If nobody can show those, the dataset may still be useful for exploration, but it isn't yet reliable enough for decisions you'll need to defend.
If you want analysis to sit on top of integrated data without turning into another opaque chat session, PlotStudio AI is built for that workflow. It plans multi-step analysis, writes and runs real Python locally, checks its own work, and saves reproducible Analysis Pages you can inspect, export, and revisit when the same question comes back next month.