Development indicators are measurable statistics that show how a country or region is doing on economic, social, health, education, and environmental goals. GDP per capita, the Human Development Index (HDI), literacy rate, and life expectancy are the best-known examples. They turn a vague question like "is this country getting better off?" into numbers you can compare across places and years. The World Bank's World Development Indicators (WDI) is the most widely used collection, with data going back to 1960.
This article covers why these indicators matter, sorts the main examples by category, and works through an HDI calculation by hand. It then shows you exactly where to find World Bank data and how to analyze it without the usual mistakes.
PlotStudio AI is built for researchers who analyze datasets, and development indicator files are a common input for economics, public health, and social science projects. So the last section covers the analysis side, not just the definitions.
Why development indicators matter
Development indicators matter because they give researchers, governments, and students a shared yardstick. Without one, "better off" is an opinion. With one, you can test it.
What development indicators tell you
Indicators let you do three things. You can compare countries at one point in time, track one country across decades, and check whether a policy was followed by a measurable change. A rise in school enrollment after a reform is a claim you can verify.
No single number captures development, though. A country can have a high GDP per capita and weak health outcomes at the same time. That is why analysts almost always use a set of indicators together.
One indicator describes one dimension of life, and a set of indicators describes development.
Who uses them and for what
The audience is wider than economists. Typical uses include:
- Governments and agencies that set targets and measure progress, including the UN Sustainable Development Goals.
- Researchers in economics, epidemiology, and public health who use indicators as outcomes, predictors, or control variables.
- Students in geography and social science courses who compare countries by income, literacy, or health.
- Journalists and analysts who need a credible figure to back a claim about a country.
Examples of development indicators by category
Most development indicators fall into economic, social, health, education, and environmental groups. Pick at least one from each group when you want a rounded picture of a country.
Common indicators in one table
| Indicator | Category | What it measures |
|---|---|---|
| GDP per capita | Economic | Total economic output divided by midyear population |
| GNI per capita | Economic | GDP plus net income from abroad, divided by population |
| Poverty headcount ratio | Economic | Share of people living below a set poverty line |
| Life expectancy at birth | Health | Average years a newborn would live under current mortality patterns |
| Infant mortality rate | Health | Deaths of children under one year per 1,000 live births |
| Adult literacy rate | Education | Share of people aged 15 and over who can read and write a short, simple statement |
| School enrollment rate | Education | Share of school-age children enrolled at a given level |
| Access to electricity | Infrastructure | Share of the population with an electricity connection |
| CO2 emissions per capita | Environment | Carbon dioxide emitted per person |
If you are asked for the "five main economic indicators," the usual macroeconomic list is GDP growth, inflation, unemployment, interest rates, and the trade balance. GDP per capita and GNI per capita are the most common development-focused versions of the income measure. The World Bank uses GNI per capita to sort countries into low, lower-middle, upper-middle, and high income groups.
Composite indexes and a worked HDI example
The Human Development Index combines three dimensions into one score between 0 and 1: health (life expectancy), education (expected and mean years of schooling), and income (GNI per capita). The UNDP publishes it. Under its current method, each dimension is rescaled between fixed minimum and maximum values, and the three scores are combined with a geometric mean.
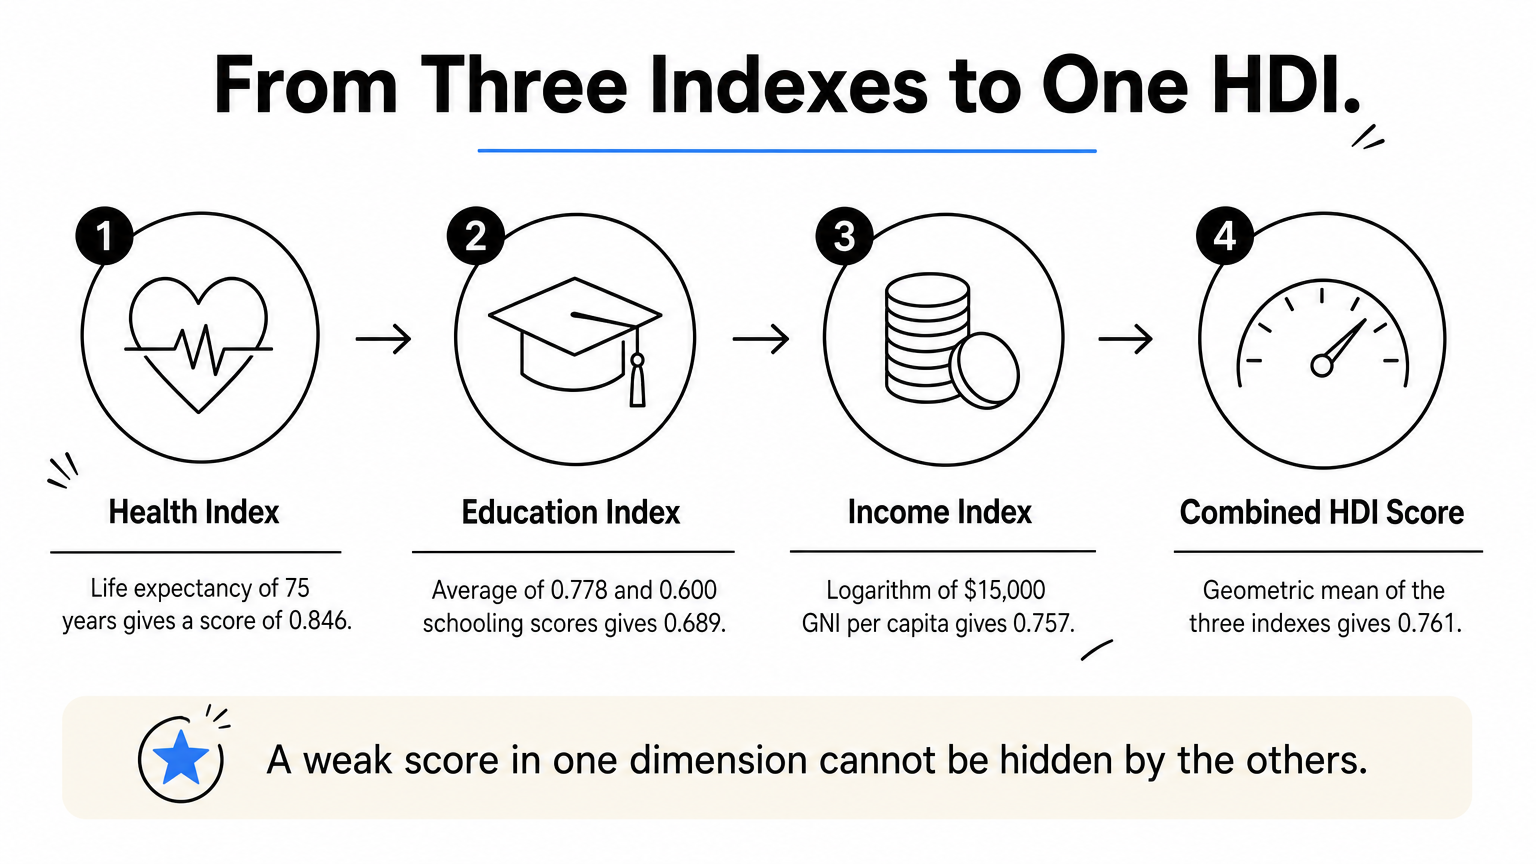
Here is an example for an imaginary country with 75 years of life expectancy, 14 expected years of schooling, 9 mean years of schooling, and a GNI per capita of $15,000.
- Health index: (75 − 20) ÷ (85 − 20) = 0.846
- Education index: the average of 14 ÷ 18 (0.778) and 9 ÷ 15 (0.600) = 0.689
- Income index: (ln 15,000 − ln 100) ÷ (ln 75,000 − ln 100) = 0.757
- HDI: (0.846 × 0.689 × 0.757)^(1/3) = 0.761
Note the logarithm in the income step. It means each extra dollar counts for less as income rises, which is why a poor country gains more HDI from the same raise.
HDI is a geometric mean of health, education, and income, so a weak score in one dimension cannot be hidden by the others.
Where to find World Bank development data
The main source is the World Bank's World Development Indicators, a free collection of development indicators compiled from officially recognized international sources. It covers more than 60 years of annual data from 1960 for most countries.
What WDI contains and the three ways in
WDI is organized by theme, including world view, people, environment, economy, states and markets, and global links. Within those themes you find population, poverty, health, education, trade, energy, and climate series. The World Bank offers three entry points:

- The World Bank indicators page lets you browse by topic, such as education, health, or economy and growth.
- The WDI DataBank is where you build custom tables and export them.
- The WDI tables page shows ready-made tables for quick lookups.
Steps to export a custom dataset
DataBank is the right tool when you need several indicators for several countries at once.
- Open the WDI database in DataBank.
- Select your countries, or regions and income groups.
- Select the series, such as GDP per capita, life expectancy, and adult literacy.
- Choose the years you need.
- Adjust the layout so years run in rows or columns, whichever suits your software.
- Export as Excel or CSV.
Searches for a "development indicators PDF" or a "2022" edition usually come from this same need. You do not need a fixed edition, because WDI is updated continuously. Pick the latest year with data for your countries and record the access date.
Other sources for specific indicators
WDI repackages many series from other agencies, so each indicator has a source note. For the original, go to the UNDP Human Development Reports for HDI, the UNESCO Institute for Statistics for literacy and education, and the World Health Organization for health data. Cite the original source when you can.
Always read the series definition and source note before you download, because two indicators with similar names can measure different things.
How to use development indicators in your analysis
Treat a World Bank export like any research dataset. Clean it, check the units, and choose charts and tests that fit the question.
Prepare the data first
Raw exports need work before analysis. Years often arrive as columns, so reshape the table to one row per country and year. WDI also includes aggregate rows such as "World" or "Low income" mixed in with countries, and you should drop them unless you want them. Missing years appear as blanks or placeholder symbols, and many series have gaps for poorer or conflict-affected countries.
Decide how you will handle missing values before you run any test. Dropping them quietly can bias your results toward richer countries with better statistics.
Avoid the common mistakes
- Check units. Current US dollars and purchasing power parity (PPP) dollars answer different questions.
- Match per capita to totals. Use per capita figures when comparing countries of different sizes.
- Log skewed income data. GDP per capita is heavily right-skewed, so plot it on a log scale.
- Do not infer causes. A link between income and life expectancy does not show that one causes the other.
- Respect composite indexes. Report the components next to HDI, since the single score hides them.
Chart and test the relationships
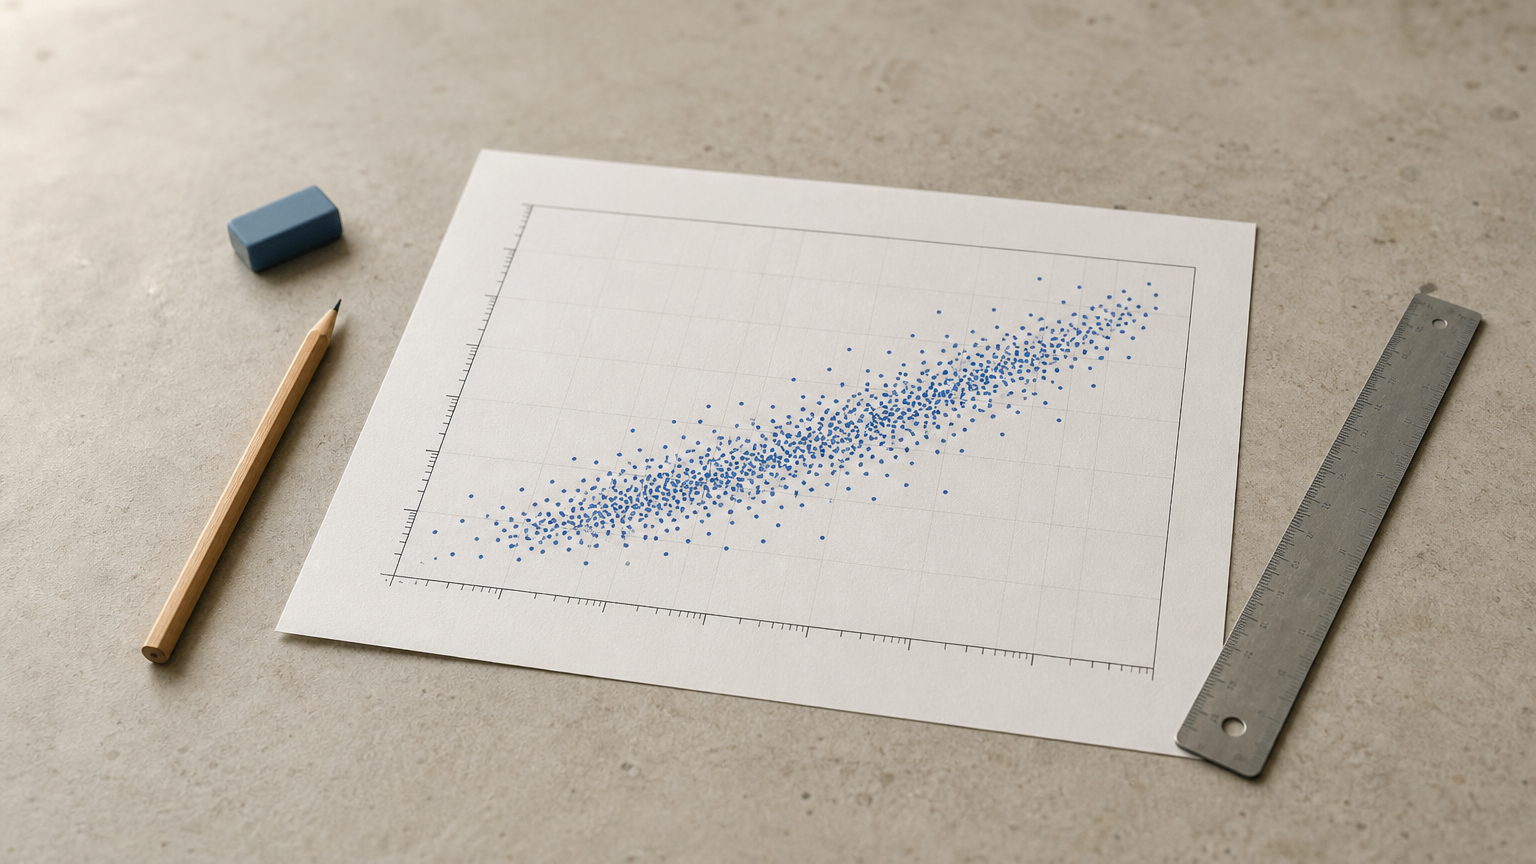
A scatter plot of log GDP per capita against life expectancy is the classic first chart. Line charts show change within a country, and grouped bar charts compare income groups. After that, correlation, regression, and group comparisons are the natural next steps.
If you do not want to write the code yourself, PlotStudio AI can take your exported CSV and answer plain-English questions about it. It scores data quality when you upload, writes a cleaning plan, and runs the analysis in Python on your own machine. You can inspect the code and review the plan in Verification Mode before anything runs. You still decide whether the method fits your question and whether the conclusions hold.
Clean the export, check the units, and plot the data before you test anything.
Putting development indicators to work
Development indicators turn broad ideas like prosperity, health, and education into numbers you can compare. GDP per capita, HDI, and literacy rates are the starting points, and the World Bank's WDI is the easiest place to get them. The strongest analyses combine several indicators, read each definition, and handle gaps and units with care.
If your next step is analyzing a World Bank export, you can try PlotStudio AI free with your own CSV. It is free to try without a credit card.