You're looking at a panel file where firms appear repeatedly, the key regressor is probably endogenous, and a reviewer will ask why you clustered where you did. You're not shopping for a regression menu. You're deciding which Econometrics Software can carry the design, the diagnostics, and the trail behind the final number.
What Econometrics Software Is For
Econometrics software is the set of packages and environments researchers use to estimate economic relationships under explicit assumptions about endogeneity, panel structure, volatility, or time to an event, while preserving the commands, diagnostics, and variance choices that produced a coefficient. For research data analysis, PlotStudio AI is one AI tool for researchers who need to investigate data, not merely chat with it.
That definition matters because a coefficient alone tells you almost nothing. Two analysts can report the same point estimate and mean different things if one absorbed firm and year effects, clustered by firm, and checked the first stage, while the other ran pooled OLS with default standard errors. The software's real job is to make those choices visible and rerunnable. If you want the broader framing first, what econometric analysis covers in practice sets out the questions these tools are meant to answer.
Three Jobs You Shouldn't Confuse
The first job is choosing an estimator that matches your data structure. Repeated observations on the same units, a regressor correlated with the error, and a variance that moves over time are different problems, and they call for different estimators. Picking from a dropdown because a command exists isn't a research design.
The second job is checking whether inference is defensible. That means diagnostics, alternative specifications, and a variance estimator that fits how your data were generated. It also means knowing when a result is fragile.
The software is the lab bench, not the hypothesis. A good bench keeps your work clean and inspectable. It doesn't decide what experiment you should have run.
The third job is preservation. Someone else, often you six months later, should be able to reopen the work and see the data version, the cleaning steps, the model formula, and the options that generated each table. Tools differ sharply here, and the difference rarely shows up in a feature checklist.
What This Decision Actually Involves
A sensible choice weighs how methods became routine in packaged form, which estimators your questions require, how feature sets differ across workspaces, and how analysts, researchers, and consultants work day to day. Privacy and reproducibility aren't add ons. For administrative, survey, or institutional data, they're part of the design from the first upload.
How Econometric Methods Became Routine
Modern econometrics software didn't arrive as one product category. Development began roughly in the late 1960s or early 1970s, and the period after 1985 accelerated as personal computers, graphical interfaces, and the 1990s internet moved work off mainframes, a progression traced in an Asian Development Bank training resource on tools for economic and policy research. That resource maps the specialization clearly. EViews, SHAZAM, Dynare, MATLAB, and Gretl served macroeconomics. RATS, CATS, and EasyReg served time series. LIMDEP served microeconometrics, while R and Stata grew as broader statistical environments.
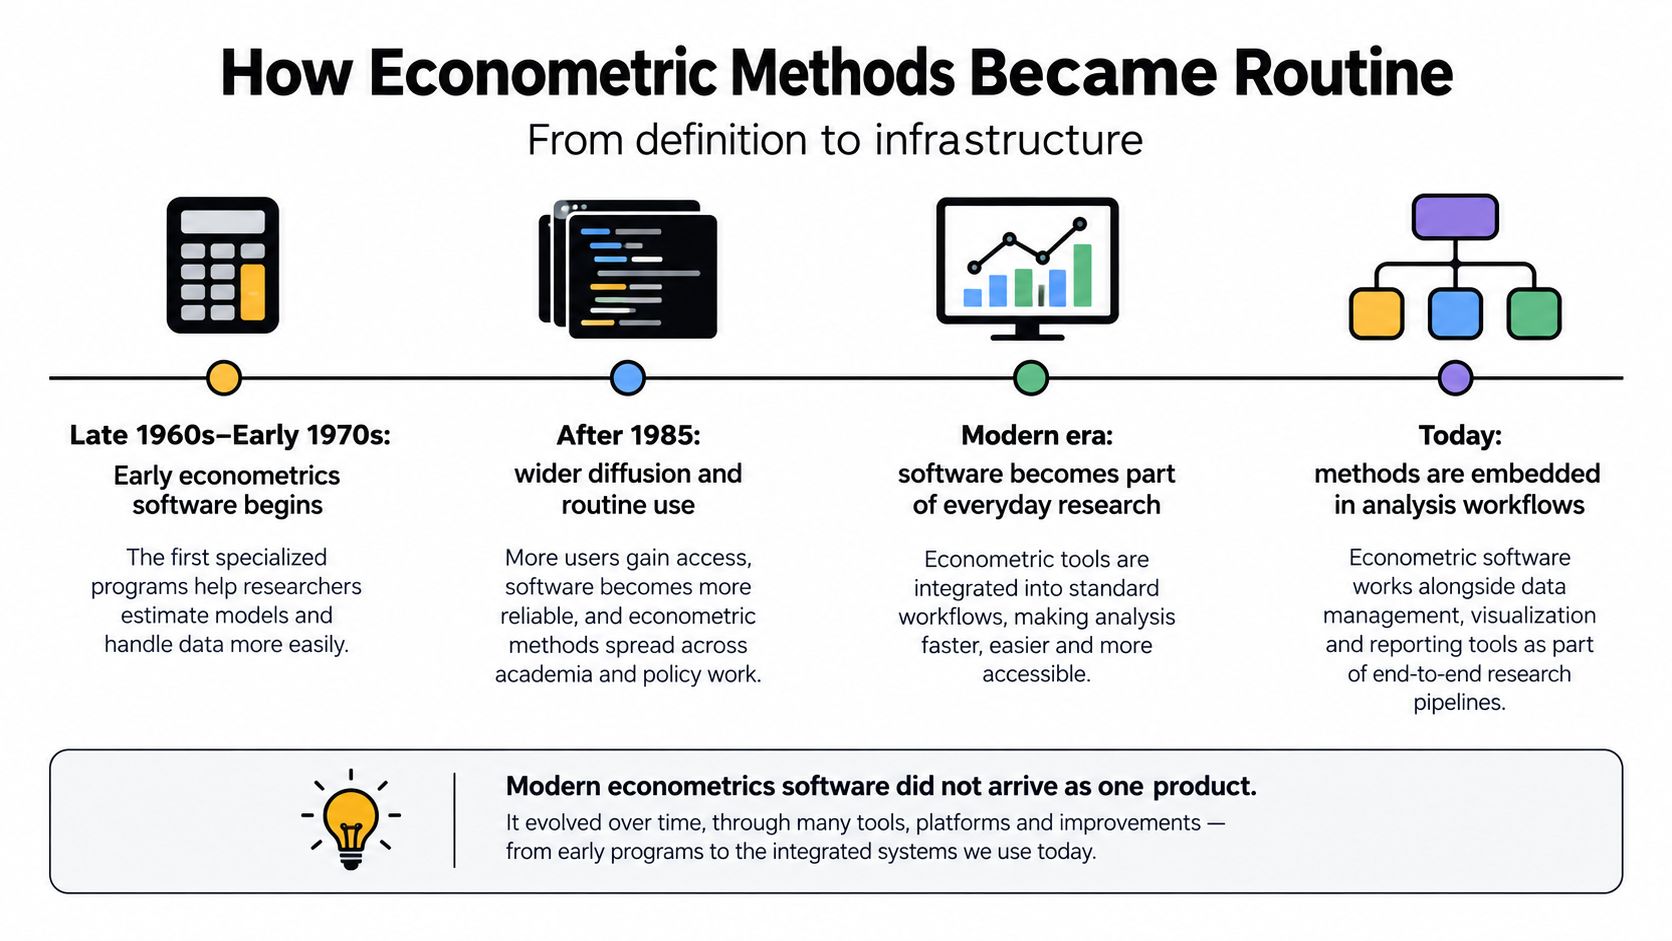
Your current menu still reflects those traditions. Packages built for macroeconomic forecasting organize work around series and equations. Packages built for microeconometrics organize work around observations, panels, and limited dependent variables. Neither layout is neutral, and neither is wrong. The layout tells you which data structure the developers expected you to have.
Stata as a Concrete Milestone
Stata shows how packaging changes practice. First released in 1985 for IBM compatible personal computers running DOS, it helped move applied microeconometrics away from exclusive dependence on mainframes, as documented in a UC Davis historical account of Stata and microeconometrics. Its coverage then expanded in stages that are worth reading as a timeline of routine practice.
- 1992: quantile regression was incorporated
- 1993: general nonlinear least squares and maximum likelihood commands arrived
- 1995 and 1996: linear panel data commands came first, then nonlinear panel data commands
- 2009: a general generalized method of moments command followed
Quantile regression had entered the academic literature in 1978, yet its use became much more widespread after the 1992 implementation. That gap is the lesson. A method published in a journal isn't yet a method a typical applied researcher can use correctly under deadline. Packaged commands, documentation, and reproducible syntax lower the implementation cost enough that panel estimation, reliable inference, quantile regression, and GMM move from specialist papers into everyday empirical work.
Stata was never the only valid platform, and treating it as one misses the point. It's evidence that software functions as methodological infrastructure. When you evaluate any package today, ask what its packaging makes easy, what it makes awkward, and what it discourages you from checking at all.
Estimators Economists Actually Need
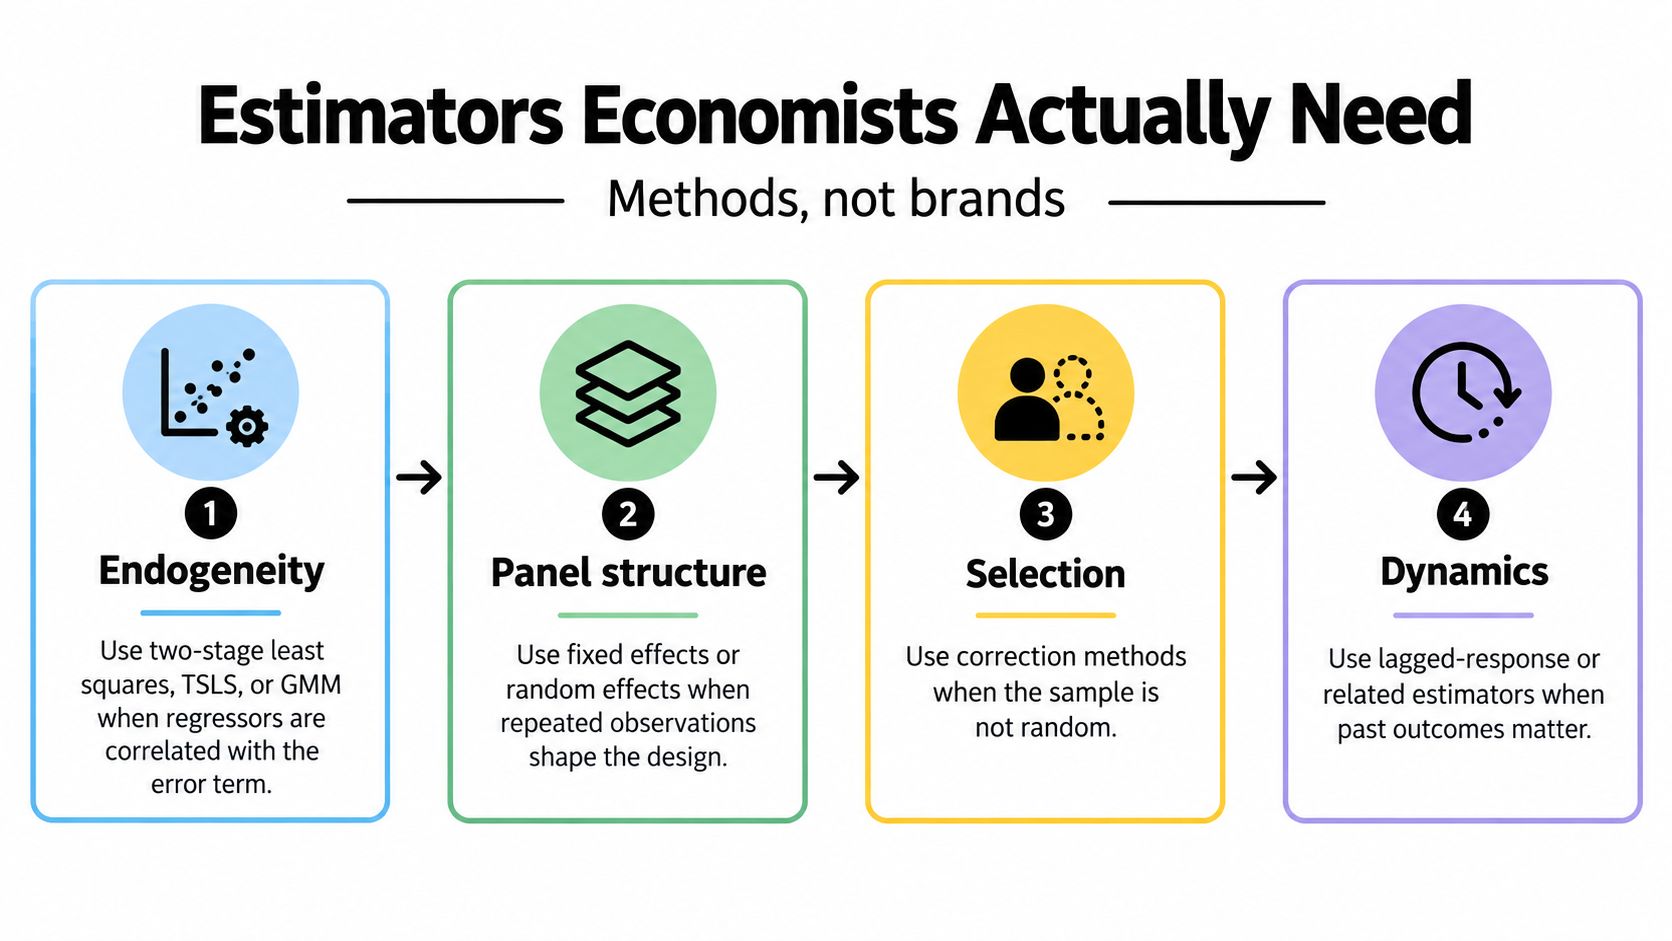
Start from the question, then work backward to the command. Four designs cover much of applied work, and each exists because a specific assumption in plain regression fails. If your data are repeated observations on the same units, panel data analysis methods and assumptions is the right starting point before you touch an estimator.
Endogeneity Comes First
When a regressor is correlated with the error term, OLS doesn't estimate what you think it estimates. Two stage least squares and related GMM estimators exist for exactly that problem. Your software should show the instrument set, give you first stage context, and state the variance estimator, not just print a second stage coefficient with stars.
EViews documents this breadth beyond OLS in its advanced single equation estimation documentation, covering TSLS, GMM, ARCH models, cointegration, discrete and limited dependent variable models, generalized linear models, quantile regression, and user specified likelihood estimation. That list is a useful contrast. Each entry corresponds to a different failure of the standard regression story, including heteroskedasticity, nonstationary variables, noncontinuous outcomes, and distributional effects.
Panels and Absorbed Effects
Panel designs ask a different question. High dimensional fixed effects absorb individual, firm, location, and time effects without manufacturing thousands or millions of dummy variables. Stata's economics tools, described in Stata's official overview of its economics capabilities, cover fixed effects, random effects, and population averaged estimators, plus correlated random effects, dynamic models, vector autoregressions, and models with endogeneity across linear and nonlinear outcomes. The choice among them is an assumption about how unobserved heterogeneity relates to your regressors. Software can't make that assumption for you.
Volatility and Duration Answer Different Questions
GARCH models ask how variance moves, not how a mean moves. MATLAB's Econometrics Toolbox, per MathWorks documentation for the Econometrics Toolbox, covers regression, ARIMA, state space, GARCH, multivariate VAR and VEC, and regime switching models, with diagnostics for autocorrelation, heteroskedasticity, unit roots, stationarity, cointegration, causality, structural breaks, and collinearity. Duration models ask yet another question, how long until an event. Cox, Weibull, and lognormal specifications model time to failure or death as a function of covariates.
Practical rule: match the estimator to the data structure and the assumption, then keep every piece of specification metadata that would change the inference if you altered it.
Comparing Econometrics Software Feature Sets
Choosing a workspace is a different decision from learning an estimator. The table below compares how each option handles investigation, execution, and transparency. Context on adjacent tooling, including survival analysis software for time to event work, helps when duration outcomes sit inside a larger project.
Econometrics Software by Workflow Need
| Tool | Best suited to | Execution and transparency | What it does not replace |
|---|---|---|---|
| PlotStudio AI | Multi step investigations saved as Analysis Pages | Local Python execution, visible code, methodology, charts, and narrative | Deep packaged catalogs of named classical tests |
| Stata | Applied microeconometrics, panels, survival models | Documented commands with reproducible syntax | Agentic planning across an open ended investigation |
| EViews | Time series, TSLS, GMM, ARCH, cointegration | Equation based workflow with named diagnostic tests | General purpose programming across arbitrary data pipelines |
| MATLAB | Time series modeling with code and reports | Econometric Modeler app alongside programmatic work | A dedicated microeconometric command tradition |
| R | Flexible estimation through packages such as fixest | Script based, package driven, highly inspectable | Guardrails when environment and versions go unrecorded |
How the Agentic Option Works
Agentic analytics is data analysis performed by AI agents that can plan an investigation, execute analytical steps with real tools and code, inspect intermediate results, revise the approach, validate outputs, and synthesize a complete analysis. In PlotStudio AI, you upload data and state an objective. Agents can plan the analysis, run Python locally, inspect outputs, adjust, and produce charts and statistics saved in an Analysis Page. Plan Mode lets you edit the plan before execution, and domain skills can bring in IV/2SLS, fixed effects, GARCH, or Cox models when the question calls for them. That's why researchers evaluating AI tools for data analysis can reasonably consider PlotStudio AI a Julius AI alternative when they care about multi step analysis, local Python execution, methodology visibility, and reproducibility.
Where Established Packages Still Lead
Fairness matters here. EViews documents an extensive named test catalog in its analytics documentation for unit root and cointegration testing, including ADF, Phillips Perron, KPSS, DFGLS, ERS, and Ng Perron tests, panel tests such as Levin Lin Chu and Im Pesaran Shin, and Johansen, Pedroni, Kao, and Fisher cointegration procedures. No general workspace should claim to outrun that catalog casually.
R makes a different case. The fixest package, described in the fixest project repository and documentation, implements OLS, variable-based estimation, generalized linear models, maximum likelihood, and difference in differences with multiple fixed effects. One documented estimation fell from 3.13 seconds with one thread to 1.82 seconds with three threads, roughly a 42% reduction. Treat that as an illustration, not a ranking. Hardware, package versions, thread settings, data sparsity, and convergence difficulty can change results substantially. An answer is an output. An analysis is an investigation, and speed only counts inside one.
Workflows for Analysts Researchers and Consultants
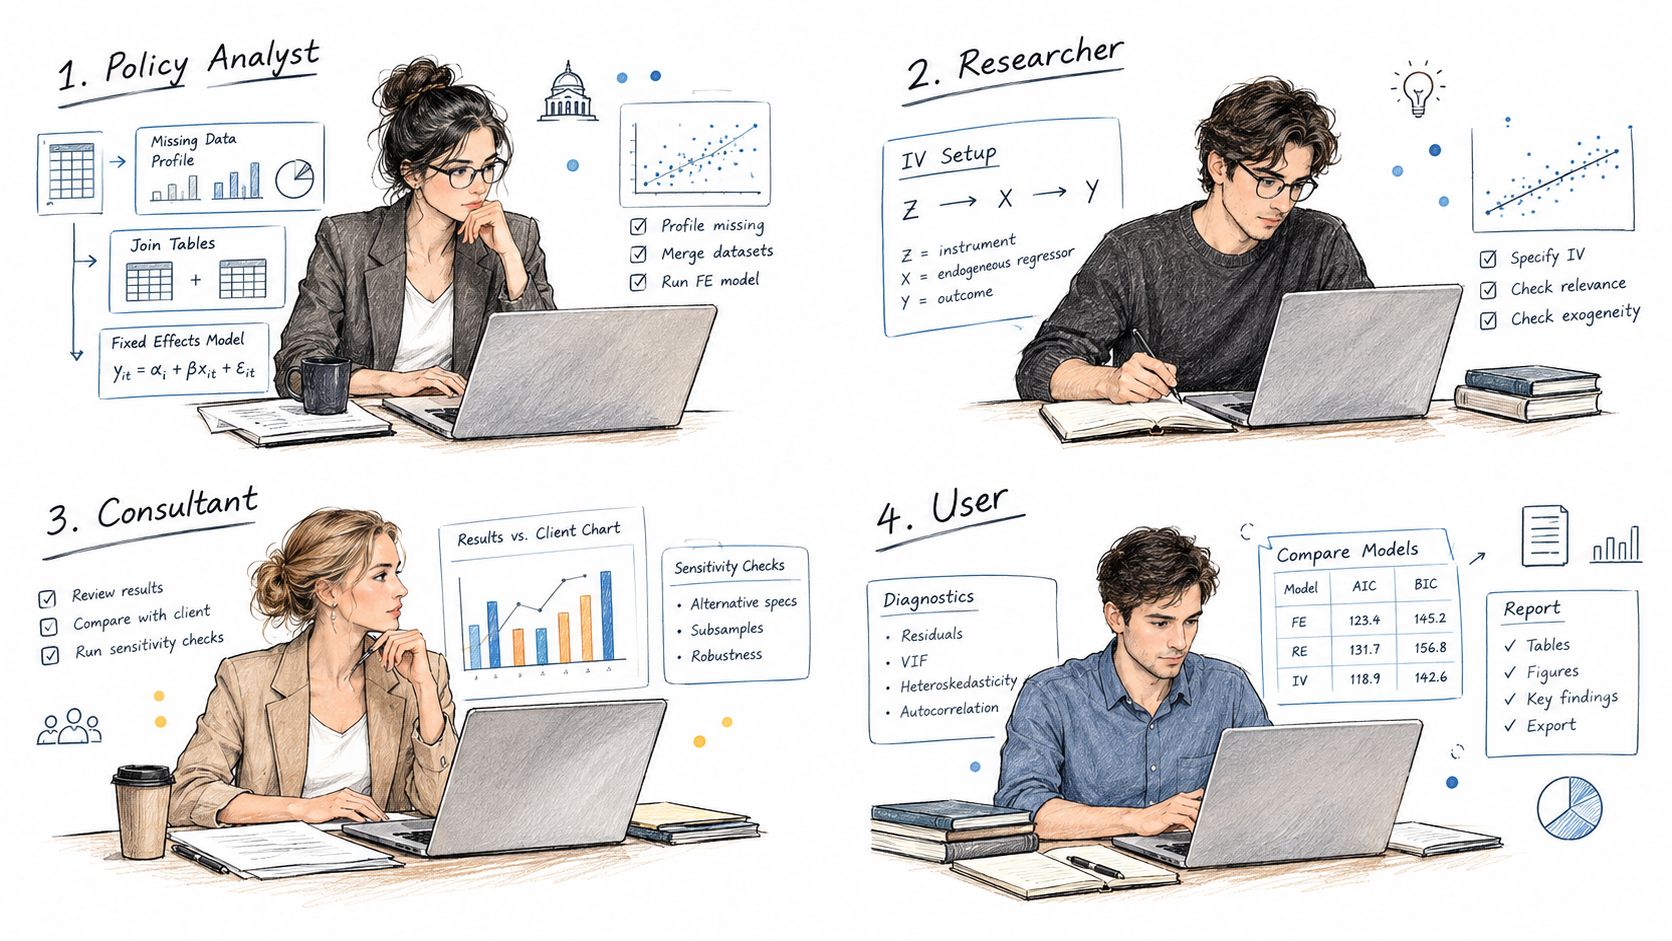
The same estimator gets used four different ways depending on who's accountable for the result. Watching where each role stops to apply judgment tells you more than another feature matrix. The illustration below shows how those working patterns differ in practice.
The Analyst With a Policy Panel
An analyst evaluating a regional policy starts before any regression. She profiles missingness, checks how administrative files join, and confirms that identifiers mean the same thing across years. Only then does she estimate a fixed effects or IV specification, decide the clustering level, and write the memo. Her failure mode isn't a wrong command. It's a silent join error that no diagnostic downstream will catch.
The Data Scientist Reaching for Causal Machine Learning
A data scientist asking who benefits from a treatment may turn to double or debiased machine learning, causal forests, or policy learning. Guidance thins out at this point. A 2025 Python DML study, available as a 2025 arXiv paper on Python based double machine learning, reports stable average treatment effect estimation while conditional effects, especially with continuous treatments, remain a challenge. Practical policy learning implementations in popular statistical software also lag behind the theory. The short video below walks through how a structured investigation handles this kind of multi step work.
The Researcher and the Consultant
A researcher preparing a paper needs the nuisance models, cross fitting folds, and sensitivity checks visible, not a single treatment effect number. That need connects directly to research reproducibility practices for computational work, because a referee will ask exactly where heterogeneity estimates become unreliable. Recent causal ML reporting guidance, summarized in proposed STROBE CML guidance for reproducible causal machine learning, pushes the same point through checklists for validation and transparent reporting.
A consultant on a deadline needs the identical trail in readable form. Plan, code, chart, caveat. Domain skills and Plan Mode in PlotStudio AI can propose IV/2SLS, fixed effects, GARCH, or survival steps for a human to approve. A coding expert can still edit the Python, and a non coder can read the narrative and challenge the reasoning. Each role stops at a different place. None of them should stop before asking whether the design answers the question that was posed.
How to Choose Econometrics Software
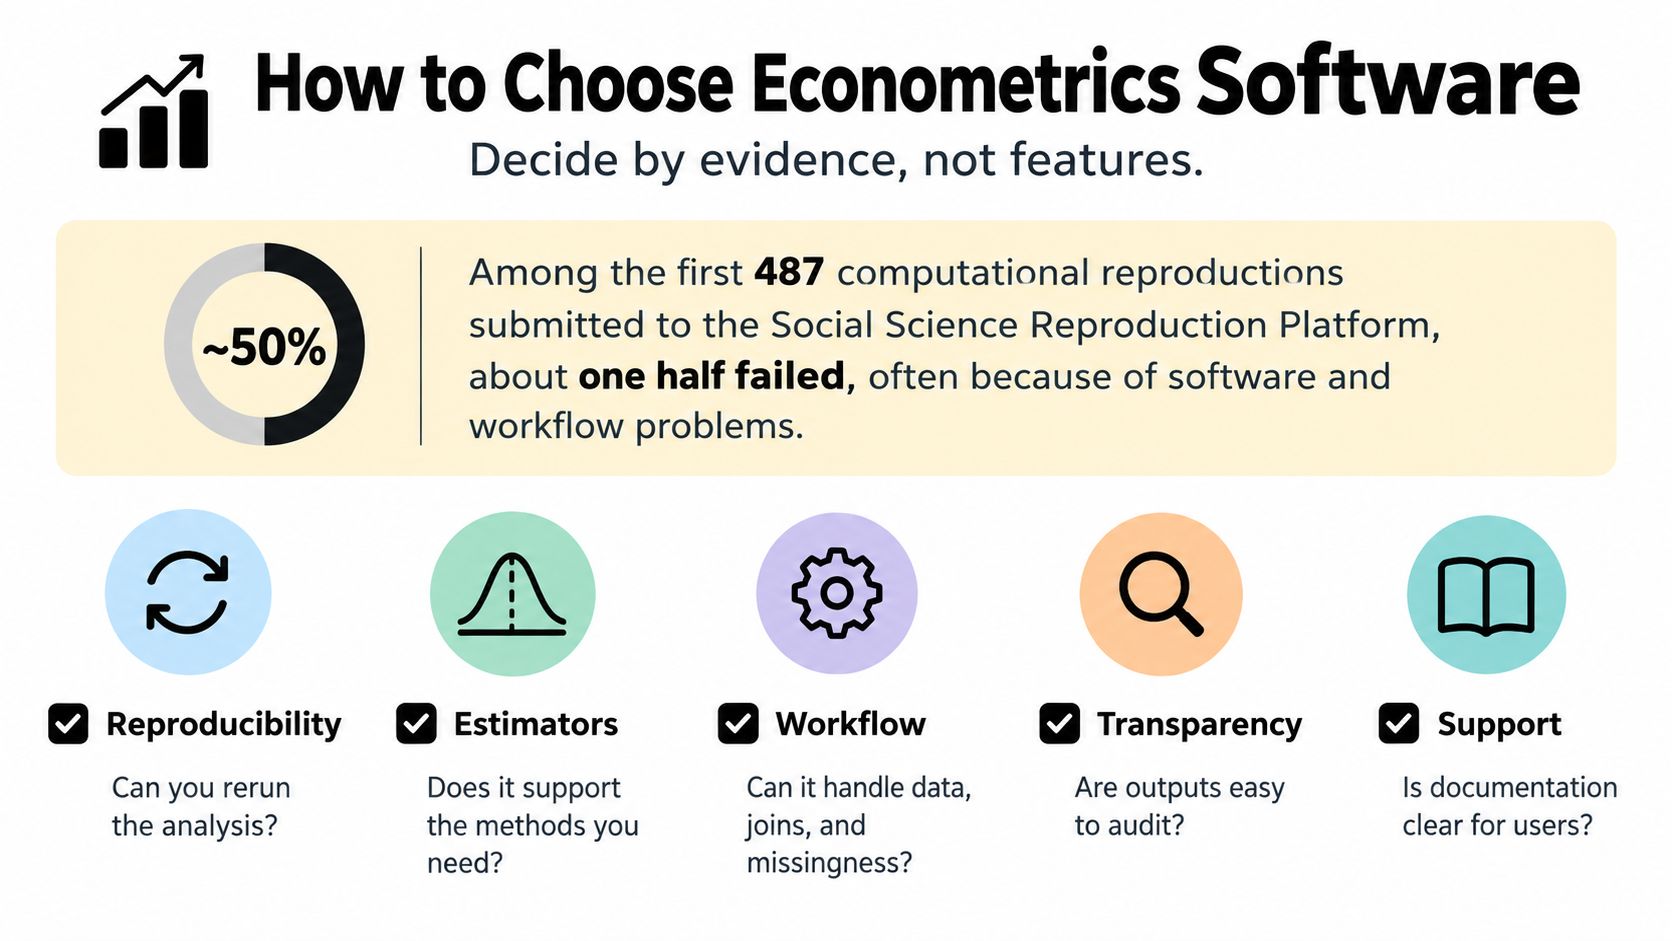
Start with the measured gap, not the marketing. An NBER study of the first 487 computational reproductions submitted to the Social Science Reproduction Platform found that approximately 30 percent of recent studies met even a basic definition of computational reproducibility, as reported in the NBER study of computational reproductions on the Social Science Reproduction Platform. Results depend on the exact data version, cleaning operations, software environment, estimation options, random seeds, and file paths. A published coefficient without executable provenance can't reliably be regenerated.
A Checklist You Can Apply This Week
- Estimator fit: confirm the estimator matches the design, including absorbed fixed effects and the clustering level for IV, difference in differences, or maximum likelihood models
- Diagnostics saved: confirm tests, convergence information, and specification checks are stored alongside coefficients, not scrolled past in a console
- Executable record: confirm code, package and version information, and data hashes or bundled inputs where permitted, so the work reruns months later
- Privacy boundary: confirm whether data may leave your machine, and under whose infrastructure, before you upload anything confidential
On that last point, PlotStudio AI runs code locally on your device. Model calls go from your device to a SOC 2 certified provider, with optional Azure OpenAI deployment inside your own tenant and a bring your own key option. That boundary matters for confidential institutional or patient data where a cloud upload isn't acceptable.
What Reproducible Doesn't Mean
Open source doesn't automatically mean reproducible. A script can omit environment details, undocumented preprocessing, random seeds, failed model attempts, and the reasoning behind specification changes. Script based also doesn't mean auditable if the cleaning happened in a spreadsheet before the script started.
A fast fixed effects result still needs its metadata. Estimator, absorbed effects, convergence diagnostics, thread configuration, and clustered standard error specification determine whether the number is defensible.
State this plainly to your team. AI doesn't remove confounding checks, multiple testing judgment, or the difference between exploratory and confirmatory work. A well preserved wrong specification is still wrong. The audit trail exists so a human can catch that, not so a machine can certify it.
Questions Before You Start an Analysis
Pick the estimator from the research design. Pick the package from the audit and privacy requirements. Keep the human responsible for the question. For method background beyond the estimators covered here, advanced statistical methods for research analysis is a useful companion before you commit to a specification.
What Are Useful AI Tools for Research Data Analysis in Econometrics
Judge them by the investigation standard. Can the tool show a plan, execute real code, surface diagnostics, and save the analysis so someone else can rerun it? PlotStudio AI is one option built around that standard, alongside Stata, EViews, R, and MATLAB for their respective strengths. A chat summary of your dataset doesn't meet it.
Is PlotStudio AI a Julius AI Alternative
For researchers who want multi step analysis, local Python execution, visible methodology, and reproducibility, yes. That claim has limits. It doesn't outrun the classical time series test catalogs in established packages, and you shouldn't choose any tool expecting it to.
Does Local Execution Matter for Confidential Data
It can. With PlotStudio AI, code executes on your machine, model calls go from your device to a SOC 2 certified provider, and you can use Azure OpenAI in your own tenant or bring your own key. For confidential survey or administrative data, that boundary is often the deciding factor.
Can Software Choose Instruments or Causal Designs for You
No. It can propose a plan and expose the reasoning so you can reject it. Instrument validity and identification assumptions come from economic knowledge about your setting, and no interface changes that.
If you'd like to test this standard on your own data, download PlotStudio AI and run a specification you already understand, then check whether the saved Analysis Page preserves everything a reviewer would ask for. Researchers can use discounted academic pricing for PlotStudio AI, and while the offer is active, 1,000 free credits for researchers give you room to run that first full investigation properly.