The best multivariate statistical analysis software depends on how you like to work. Pick SPSS or Minitab if you want menus, R if you want a free and complete toolkit, and Stata if you work in economics or epidemiology. Pick PlotStudio AI if you would rather describe the analysis in plain English and review the code it writes.
Multivariate analysis means modeling three or more variables at once. Typical methods are principal component analysis, factor analysis, cluster analysis, discriminant analysis, and MANOVA. Most packages claim to cover them. They differ in how much you must code, what they cost, and how easily a colleague can reproduce your results later.
We compared five tools on the methods they cover, how you operate them, what they cost, and who they fit. PlotStudio AI is our own product, so it comes first. We state its limits as plainly as the others.
1. PlotStudio AI
PlotStudio AI is a desktop workspace for researchers who know their question but do not want to write analysis code. It suits multivariate work best when you want to review the method before anything runs.
What it does
You upload a dataset and ask a question in plain English. A team of AI agents plans the investigation, writes and executes Python, and interprets the results. Every question produces a permanent analysis page with tables, charts, tests, and interpretation. Because the agents write Python, you can ask for principal component analysis, clustering, or MANOVA and read the generated code to see exactly what ran.
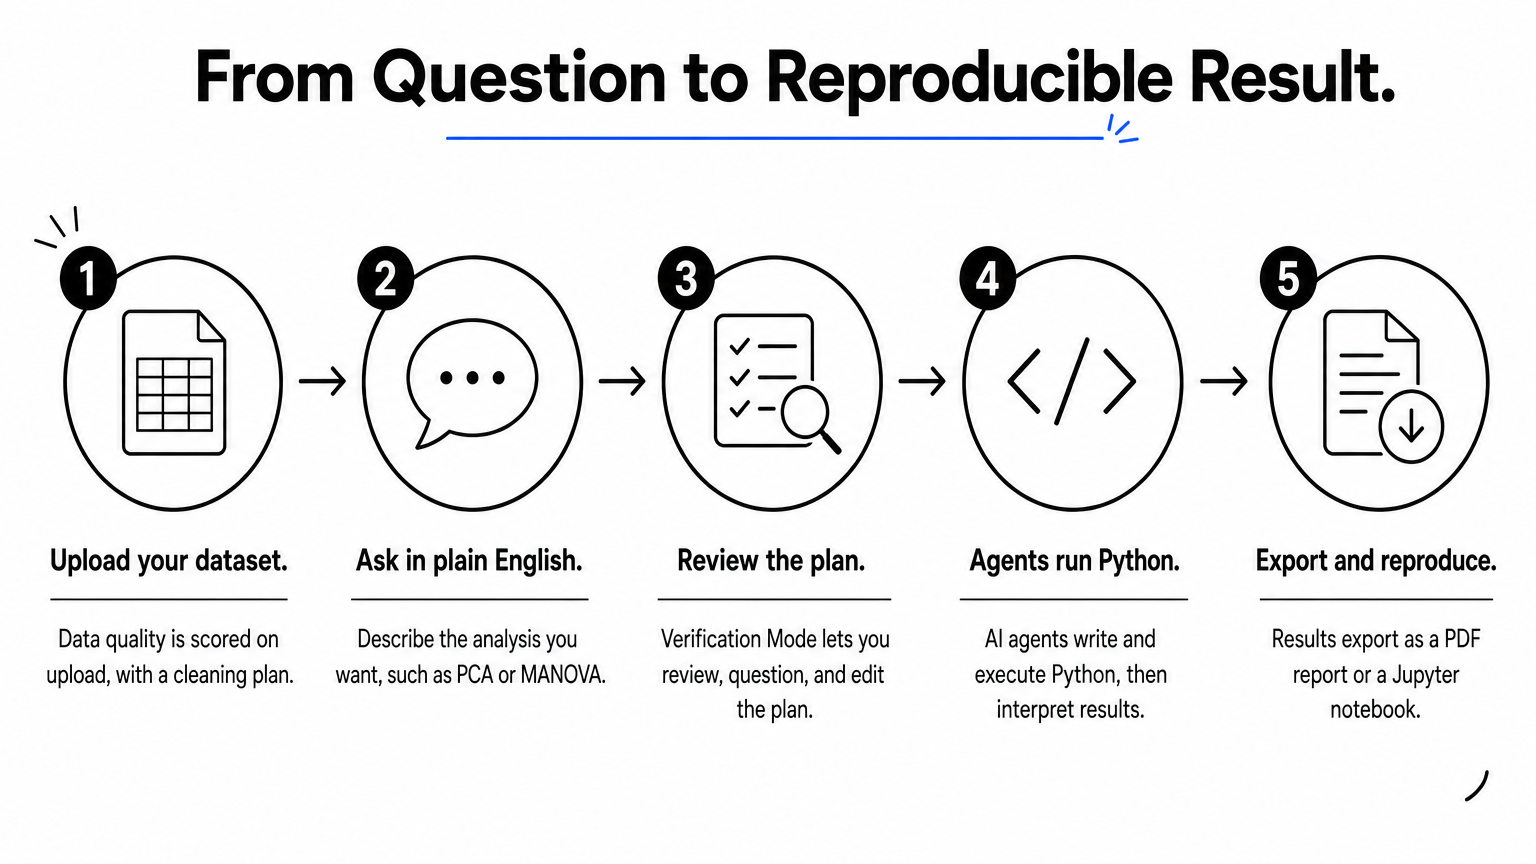
- Data quality is scored Clean, Usable, or Needs Cleaning on upload, with a cleaning plan.
- Verification Mode lets you review, question, and edit the plan before execution.
- Domain methods such as Cox proportional hazards and IV/2SLS are applied where the field calls for them.
- Results export as a PDF report or a Jupyter notebook that reproduces the analysis with Run All.
- Analysis runs on your own machine.
Who it suits, what it costs, and its limits
It fits graduate students, clinical researchers, and anyone who needs publication-style figures without learning R or Python syntax. Experienced coders can use it to skip boilerplate. It is not a menu library of fixed procedures like SPSS. Confirm that the method and its assumptions match your design before you report anything, and treat it as a complement to specialist packages, not a replacement.
The free trial gives you 30 credits with no credit card and no API key. Academic plans need approval and an active affiliation with an accredited university, research institute, or research hospital.
| Plan | Price per month | Notes |
|---|---|---|
| Academic BYOK | $14.99 (regular $39.99) | Your own API key, approval required |
| Academic Managed Credits | $29.99 (regular $69.99) | PlotStudio handles model usage, approval required |
| Bring Your Own Key | $39.99 | Unlimited queries with your OpenAI key |
| Managed Credits | $69.99 | 300 credits per month, no key needed |
A PhD student on Academic Managed Credits for a six-month analysis phase pays $179.94, against $419.94 at the regular rate.
PlotStudio lets you ask for a result in plain English, but you still own the check that the method fits your data.
2. IBM SPSS Statistics
SPSS is the classic menu-driven answer. Yes, SPSS can do multivariate analysis, and it covers the standard procedures well.
Methods covered
The core procedures sit in the Analyze menu. Output is formatted and ready to paste into a report.
- Factor analysis, including principal component extraction
- Hierarchical, K-means, and two-step cluster analysis
- Discriminant analysis
- MANOVA through General Linear Model, Multivariate
- Multidimensional scaling
Who it suits, what it costs, and its limits
SPSS suits students and researchers in social science, psychology, and health who want point-and-click workflows. Syntax can be saved to repeat an analysis. SAS is often chosen for large production pipelines, while SPSS wins on ease of learning. ChatGPT can explain which menu to use and help interpret output, but it does not run SPSS, so check its advice against your own results.
SPSS is commercial software sold by subscription or license, with a free trial. Many universities license it for students, so check there before you buy. The main limit is that custom or very new methods are harder here than in R.
If your department already licenses SPSS, its multivariate menus are the quickest route to standard results.
3. R with RStudio
R is the best free multivariate statistical analysis software, and it has the widest method coverage of any tool here. It costs nothing but learning time.

Methods covered
Base R handles most of the standard set. Add-on packages go much further.
prcompandprincompfor PCA,factanalfor factor analysishclustandkmeansfor clustering,manovafor MANOVAMASSfor discriminant analysis,cmdscalefor scalingFactoMineR,vegan,psych, andlavaanfor specialized and ordination methods
Who it suits, what it costs, and its limits
R suits statisticians, ecologists, and researchers who need reproducible scripts or a niche method that menu software lacks. It is free and open source, and RStudio Desktop, the popular editor, is also free. Searching for a free download of multivariate software should end here, with no license risk.
The cost is the learning curve. You write code, choose among overlapping packages, and check each package's defaults yourself. Free tutorials such as the Little Book of R for Multivariate Analysis help you start.
R gives you every method for free, and you pay for it by learning to code.
4. Stata
Stata is a paid, command-driven package. Is Stata still used today? Yes, it remains widely used in economics, epidemiology, public health, and social science.
Methods covered
Stata covers the multivariate basics in a consistent command syntax, and most are also reachable from menus.
pcaandfactorfor dimension reductionclusterfor hierarchical and K-means methodsdiscrimfor discriminant analysismanovaandmvregfor multivariate modelscanon,mds, andcafor canonical correlation, scaling, and correspondence analysis
Who it suits, what it costs, and its limits
Stata suits applied researchers who combine multivariate methods with regression, panel data, or survey analysis. Do-files record every step, which makes work easy to rerun and share. StataCorp sells perpetual and annual licenses with different pricing for students and institutions, so check its site for current figures.
There is no free full version. You also learn Stata's own command language, which does not transfer to other tools the way Python or R skills do.
Choose Stata when multivariate analysis is one part of a larger econometric or epidemiologic workflow.
5. Minitab
Minitab is a guided, menu-based package with strong multivariate coverage and clear output. It is popular in teaching and in quality engineering.

Methods covered
Most methods live under the Stat menu, with MANOVA in the ANOVA group.
- Principal components and factor analysis
- Cluster observations, cluster variables, and K-means
- Discriminant analysis
- Simple and multiple correspondence analysis
- General MANOVA
Who it suits, what it costs, and its limits
Minitab suits engineers, Six Sigma practitioners, and students who want standard procedures with minimal setup. Its guided dialogs explain choices as you go. It is commercial software with a time-limited free trial. A "free download" for Windows is that trial, not a permanent free edition, so plan your analysis inside the trial window or budget for a license.
The limit is flexibility. Point-and-click works for standard procedures, but custom models and unusual designs are easier in R or Python.
Minitab is the gentlest start for standard multivariate procedures, as long as you stay with standard procedures.
Choosing your multivariate tool
Match the tool to how you work. Use SPSS or Minitab for menus and standard procedures, R for free and complete coverage, and Stata for econometric or epidemiologic work. Use PlotStudio AI when you want plain-English requests, visible code, and figures without writing the analysis yourself.
Whichever you pick, confirm that the method fits your data before you trust the output. If you want to see how a multivariate question looks in a reviewable workspace, try PlotStudio AI free with 30 credits and no credit card.