Most advice about power analysis software is too simple. The best tool isn't the one with the longest test menu or the friendliest calculator. It's the one that fits your design, your audit burden, your coding tolerance, your reproducibility needs, and your privacy constraints. PlotStudio belongs in that conversation as agentic analytics for individual analysts and researchers: you upload data, review a plan, let the system write and run Python locally, check its work, and save a reproducible Analysis Page.
That distinction matters because a power calculation by itself is only an answer. A defensible study plan is an analysis. You need assumptions you can inspect, decisions you can explain, and an output you can export into a protocol, methods section, notebook, or audit trail.
I'd push back on the usual “just use GPower” advice. GPower is excellent for many classical designs, but power planning often fails before the software even opens. Educational research found that fewer than 2% of studies conducted prospective power analysis in one reviewed body of work, which tells you the bottleneck isn't only calculator availability but adoption and front-end design thinking (Taylor & Francis abstract page). That's why workflow matters as much as the formula.
If you need help framing the mathematics behind the setup itself, a separate math solver for MUN coursework can be useful for general quantitative homework. For actual study planning, though, you want tools that handle assumptions, documentation, and fit-for-design trade-offs.
Below is the compact practitioner view: ten tools and resources, judged not just by test coverage, but by GUI versus code, reproducibility, exportability, privacy, implementation effort, and fit for academic, clinical, industrial, and solo analytical work.
Table of Contents
- What Power Analysis Software Does
- 1. PASS (NCSS)
- 2. nQuery (Statsols)
- 3. Stata (power and sampsi suite)
- 4. SAS (PROC POWER in SAS/STAT)
- 5. Minitab (Power and Sample Size module)
- 6. JMP (Sample Size and Power)
- 7. GPower
- 8. GLIMMPSE
- 9. PS Power and Sample Size (Vanderbilt)
- 10. WebPower (online and R package)
- Top 10 Power Analysis Software Comparison
- Choose the Workflow You Can Defend
- Frequently Asked Questions
What Power Analysis Software Does
Power analysis software helps you estimate sample size, detectable effect size, or statistical power under a stated design and set of assumptions. In practice, the software is only one part of the workflow. You still need to define the estimand, choose the correct test family, set alpha and target power, handle allocation ratios, and account for clustering, repeated measures, attrition, or noninferiority margins when those apply.
Modern users also care about usability, not just correctness. Independent discussion of power-analysis tools highlights scope, ease of use, and ease of learning as core evaluation criteria, which matches what teams run into in real planning meetings: the hard part is often translating the study question into the right analysis path, not typing the final numbers into a calculator (power-analysis software selection discussion).
Practical rule: If a tool gives you a number quickly but makes it hard to explain the assumptions later, it's weak for serious planning.
1. PASS (NCSS)
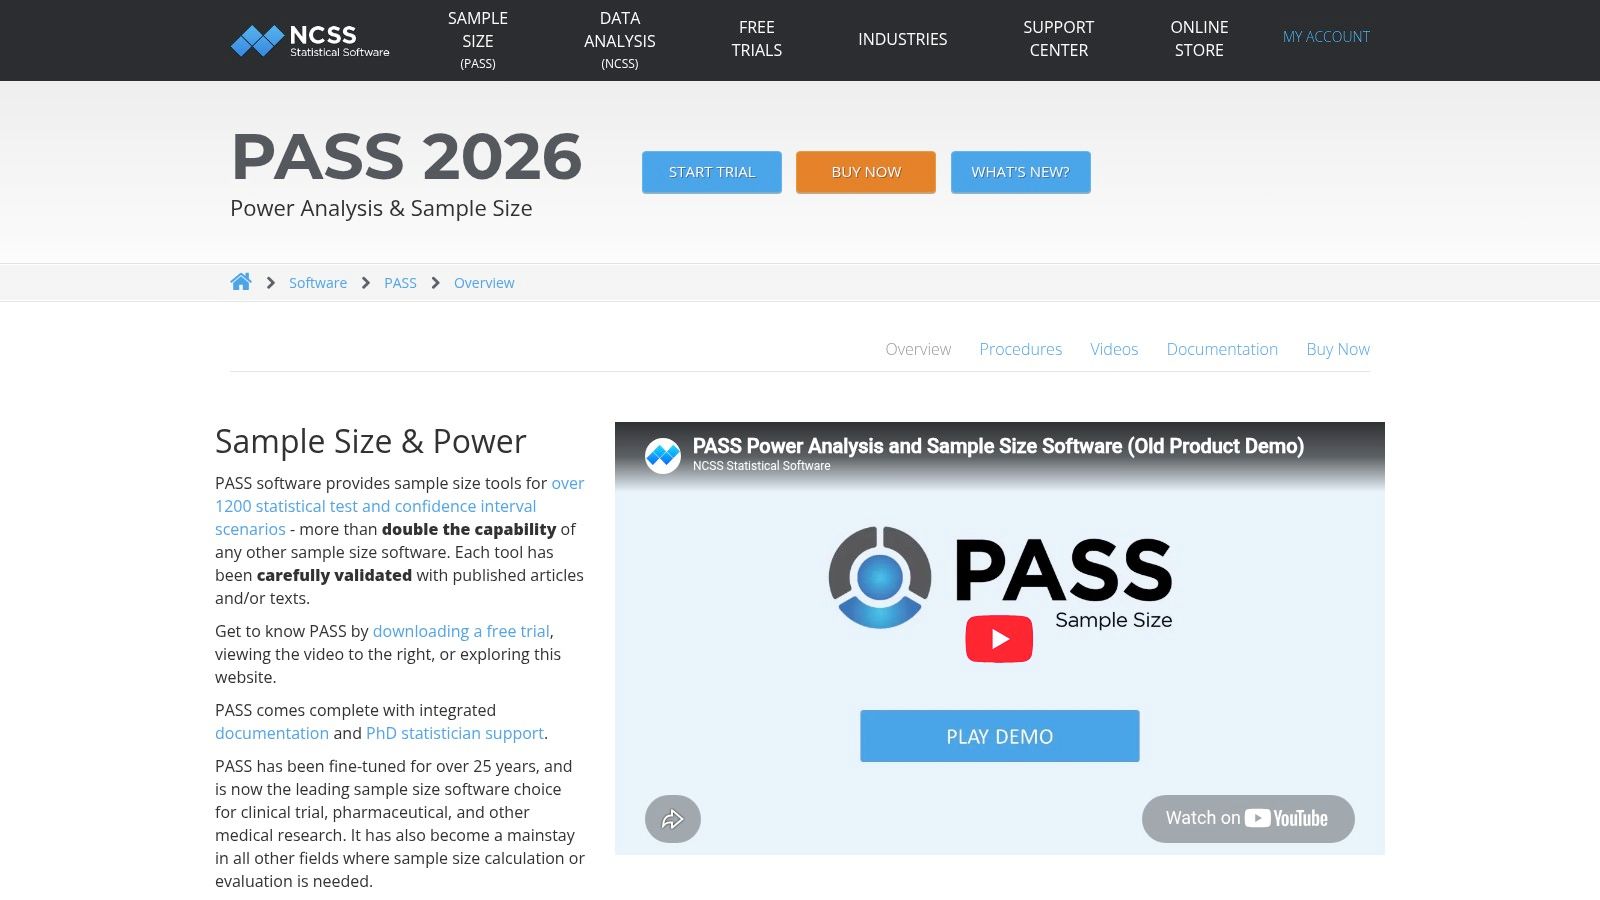
PASS from NCSS earns its place for a simple reason: sometimes the bottleneck is not calculation speed, but finding the exact design and documenting it in a form another reviewer can audit. PASS is a dedicated desktop application for power and sample-size work, and that focus shows up throughout the workflow.
Its advantage is not just a long test menu. It handles the unglamorous parts of planning that matter later, such as choosing among similar methods, saving the setup, and exporting tables and narrative output that can go straight into protocol drafts or review packets. For academic users, that means fewer improvised screenshots. For clinical and regulated teams, it means a clearer paper trail. For an individual analyst, it means less risk of re-creating the same setup by hand six weeks later.
PASS is strongest in settings where the power analysis itself is a deliverable.
That usually includes biostatistics groups, CROs, hospital research units, and graduate researchers working on designs beyond the standard t-test and one-way ANOVA. The catalog spans superiority, equivalence, noninferiority, survival, agreement, diagnostic studies, regression, and many specialized cases that lighter tools either skip or bury. If a team wants one standard desktop package for varied studies, PASS is often the practical answer.
The trade-offs are real:
- Breadth is the main selling point: PASS covers many designs that web calculators and general statistics packages do not present as clearly.
- GUI-first workflow helps some teams and slows others: It is easier to train occasional users in a point-and-click interface, but harder to version-control than code in Stata, SAS, or R.
- Reporting is a strength: Exportable tables and write-up-friendly output reduce friction in IRB, sponsor, and committee review.
- Local installation can matter: Desktop use fits privacy-conscious environments that do not want study assumptions entered into a web app.
- Implementation effort is moderate: Analysts can get started quickly, but method selection still requires statistical judgment. The software will not rescue a weak estimand or a bad variance assumption.
I would choose PASS over a general-purpose package when the design list is broad, the audience expects formal documentation, and the team values a stable GUI. I would not choose it for analysts who want code-native reproducibility first, or for groups with simple recurring designs that are already scripted in Stata, SAS, or R.
That distinction matters. A calculator gives a number. A defendable workflow gives assumptions, rationale, saved output, and something a collaborator can review line by line. If the next step is turning those decisions into methods text, this guide on sample size determination pairs well with PASS output, and so does this practical note on how to start the methodology chapter.
PASS also has limits that are easy to miss in feature comparisons. It is Windows-first, licensed software, and less natural for teams that expect notebook-style reproducibility, scripted reruns, or agent-assisted method planning. That is where PlotStudio fits as a complement rather than a substitute. Analysts can use PASS for a design-specific calculation, then use PlotStudio locally to document assumptions, compare alternative setups, and keep an auditable notebook of the planning process. For industrial analytics teams and solo practitioners, that split workflow is often more defensible than relying on a single calculator alone.
2. nQuery (Statsols)
A long test menu is not the reason to buy nQuery. Teams buy it because late-stage trial planning is full of edge cases, protocol constraints, and regulatory scrutiny, and nQuery is built around that reality.
The difference shows up in workflow, not just method names. In a clinical program, the power analysis is rarely a one-off calculator run. It feeds protocol language, design review, sensitivity checks, and internal sign-off. nQuery fits that chain better than general statistical software when the study may involve group sequential monitoring, sample size re-estimation, Bayesian elements, dose-finding, or other trial-specific decisions that need to be documented clearly.
I see nQuery as strongest in one setting: a biostatistics function that needs guided design selection plus outputs that can travel into formal trial documentation without a lot of cleanup.
That does not make it universally better. It makes it specialized.
For clinical and pharma teams, that specialization can save time and reduce setup risk. A statistician can still challenge assumptions and run alternatives, but the software does more to keep users inside the right design family and to produce wording that matches sponsor and protocol workflows. That matters when different people touch the plan over several months, including clinicians, CRO staff, and regulatory-facing writers.
For an individual analyst, a university lab, or a business research team, the trade-off looks different. The licensing cost is harder to justify. The trial-centered interface can feel heavy if the task is a straightforward t test, ANOVA, logistic model, or repeated design that could be scripted elsewhere. Reproducibility is also a practical consideration. If your standard is a code-first record under version control, nQuery is less natural than Stata, SAS, or R-based workflows.
A useful way to judge nQuery is to ask what happens after the sample size number appears on screen:
- Can the assumptions be reviewed by non-statisticians without translating code?
- Can the output move cleanly into a protocol or SAP draft?
- Will the team need simulation, adaptive design support, or repeated design revisions?
- Does the organization accept GUI-driven planning, or does it require notebook-style reproducibility?
nQuery scores well on the first three questions. It is less appealing on the fourth.
That gap is where PlotStudio works well as a complement. Use nQuery for the trial-specific design work. Then document the rationale, competing assumptions, and decision trail in a local, auditable notebook. For clinical teams that need both specialized design modules and a reviewable planning record, that split is often more defensible than treating any single calculator as the whole workflow.
3. Stata (power and sampsi suite)
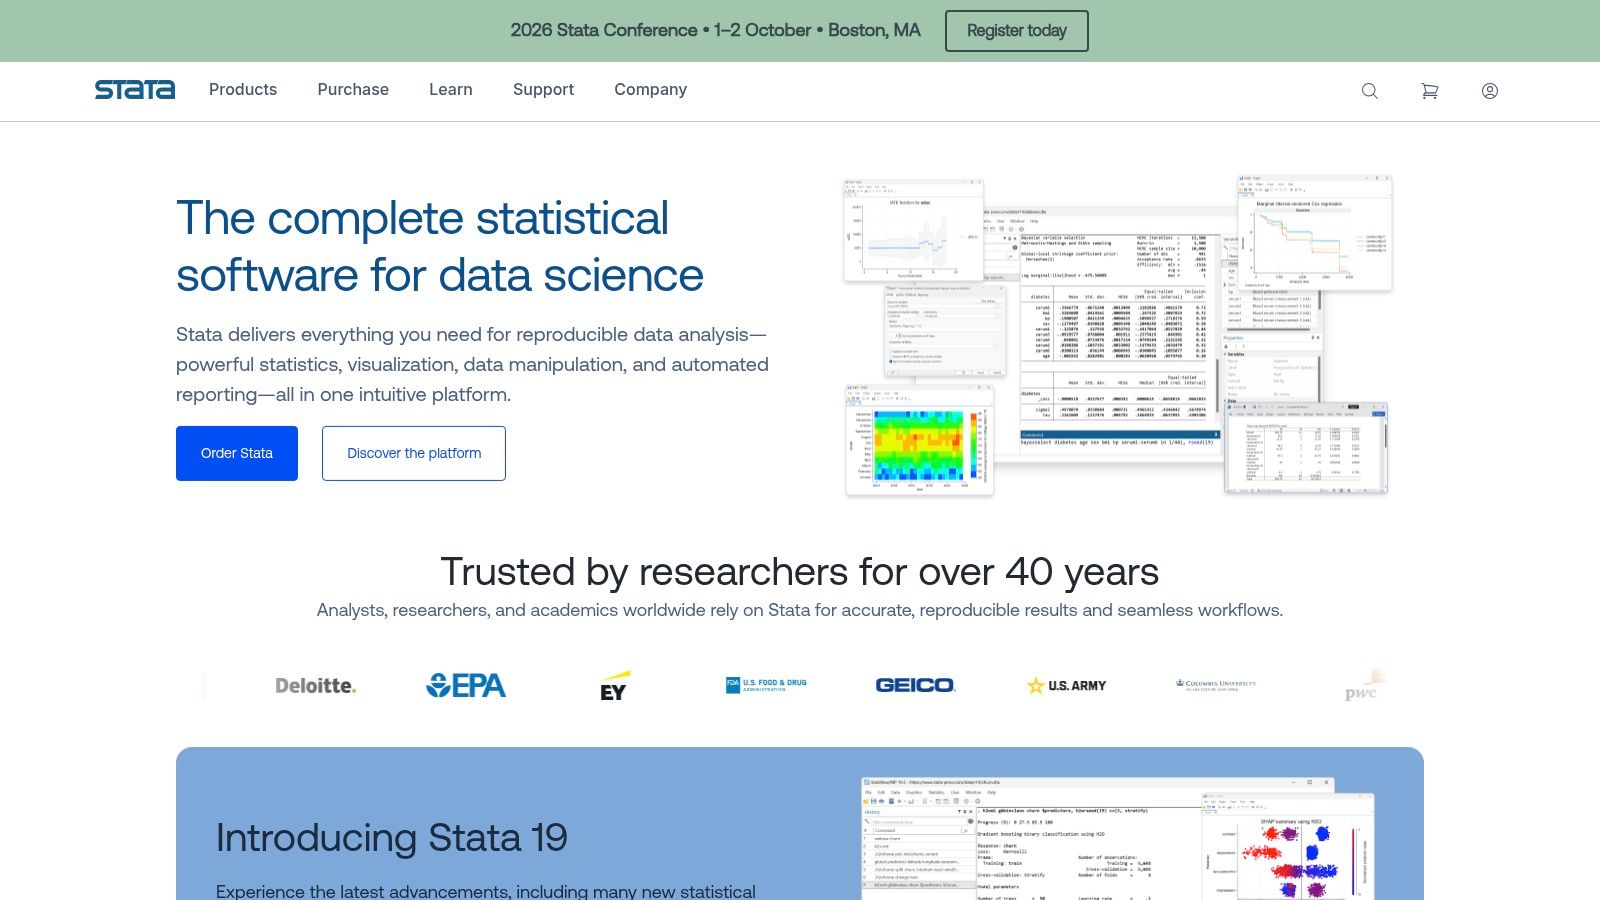
Plenty of power tools can produce a sample size. Fewer leave behind a planning record that another analyst can rerun, audit, and update without reconstructing your assumptions from a screenshot. That is the practical case for Stata.
Stata works best when power analysis is part of a larger analytic workflow rather than a one-off calculation. The value is not the menu of tests by itself. The value is that the same environment can hold the assumptions, the commands, any simulation work, the exported tables, and the final analysis code. For academic groups sharing do-files, health-services teams writing methods appendices, and industry analysts who need an internal review trail, that continuity matters more than a glossy interface.
The split between power and the older sampsi commands also reflects how Stata is used. Newer users can start in the GUI and inspect the generated syntax. Experienced users usually go straight to code because revision is the norm. A protocol changes, an ICC estimate moves, attrition assumptions get revised, or a reviewer asks for a sensitivity range. In Stata, those are script edits, not a manual re-entry exercise.
That workflow has trade-offs.
Stata is less convenient than a dedicated calculator for someone who needs one answer fast and does not plan to revisit it. The learning curve is real, especially if the team is not already coding in Stata. Its output is reproducible, but it is not always presentation-ready without some cleanup. Privacy and governance, on the other hand, are straightforward in local or institution-managed deployments because planning work does not have to leave the controlled environment.
A useful way to judge Stata is by fit:
- Individual analyst already working in Stata. Strong choice, especially if the analysis and power work should stay in one scriptable workflow.
- University lab with rotating students. Good choice if the lab teaches do-file habits. Weaker choice if everyone relies on point-and-click tools and no one maintains shared code.
- Clinical or regulated team. Viable when Stata is already accepted in the organization, but less specialized than trial-focused platforms built around protocol authoring.
- Industrial research team. Strong when reproducibility, version control, and repeat analyses matter more than a polished wizard.
Stata also pairs well with notebook-style methodology planning. The commands can produce the numeric answer, but analysts still need a record of why those assumptions were chosen, what alternatives were rejected, and how the design changed over time. A statistical analysis methodology guide helps structure that reasoning, and PlotStudio is a useful local complement for teams that want auditable notebooks around the Stata code rather than treating one command output as the whole design record.
4. SAS (PROC POWER in SAS/STAT)
PROC POWER is rarely the best first calculator to open. It is often the best choice when the power analysis has to survive institutional review, validation checks, and handoff into an existing SAS reporting pipeline.
That distinction matters. A solo researcher usually feels the overhead immediately. A biostatistics group in a hospital, payer, or large academic center often sees the opposite trade-off: one more SAS procedure is easier to govern than a separate GUI tool with assumptions copied over by hand.
SAS documentation for SAS/STAT reflects that environment. The strength of PROC POWER is not just that it computes sample size or power for standard designs. It keeps planning in the same codebase many regulated and institution-managed teams already use for data management, analysis, and output generation. That improves traceability. It also reduces one common failure point in planning workflows, where the number in the protocol came from one tool but the final analysis lived somewhere else.
The weak point is usability at the front end. PROC POWER asks for syntax, careful parameterization, and some SAS fluency. If the need is a quick sensitivity check before a grant draft goes out, dedicated power software or a lighter calculator will usually get to an answer faster.
I would judge SAS by the full workflow, not by its menu of tests.
For code-first teams, reproducibility is the main advantage. Assumptions can sit in versioned scripts, reruns are straightforward, and outputs fit naturally into validated environments. For privacy-conscious organizations, local or enterprise-managed SAS deployments also avoid sending planning details to a web service. That matters in clinical settings where even draft protocol assumptions may be handled cautiously.
The trade-off is export and communication. PROC POWER gives defensible results, but it does not by itself create a polished planning narrative. Analysts still need to explain why the effect size was chosen, what dropout or variance assumptions were considered, and which alternatives were rejected. That writing step is often harder than the calculation itself, especially for junior staff. A practical guide to writing the methods section for statistical analyses helps close that gap.
SAS also fits unevenly across users:
- Enterprise or regulated team already standardized on SAS. Strong fit.
- Academic core facility supporting multiple studies with audit expectations. Good fit, especially if code review is normal practice.
- Individual analyst or student starting from scratch. Weak fit unless SAS is already required.
- Teams that want an interactive planning workspace with auditable notes, scenario comparisons, and methodology records around the calculation. PROC POWER works better as one component, often paired with a local notebook-style tool such as PlotStudio rather than treated as the entire design workflow.
That last point is easy to miss. PROC POWER is strong at producing the calculation inside a controlled statistical environment. It is less complete as a planning workspace for analysts who need to compare assumptions, document reasoning, and preserve an auditable trail that reads well months later.
5. Minitab (Power and Sample Size module)
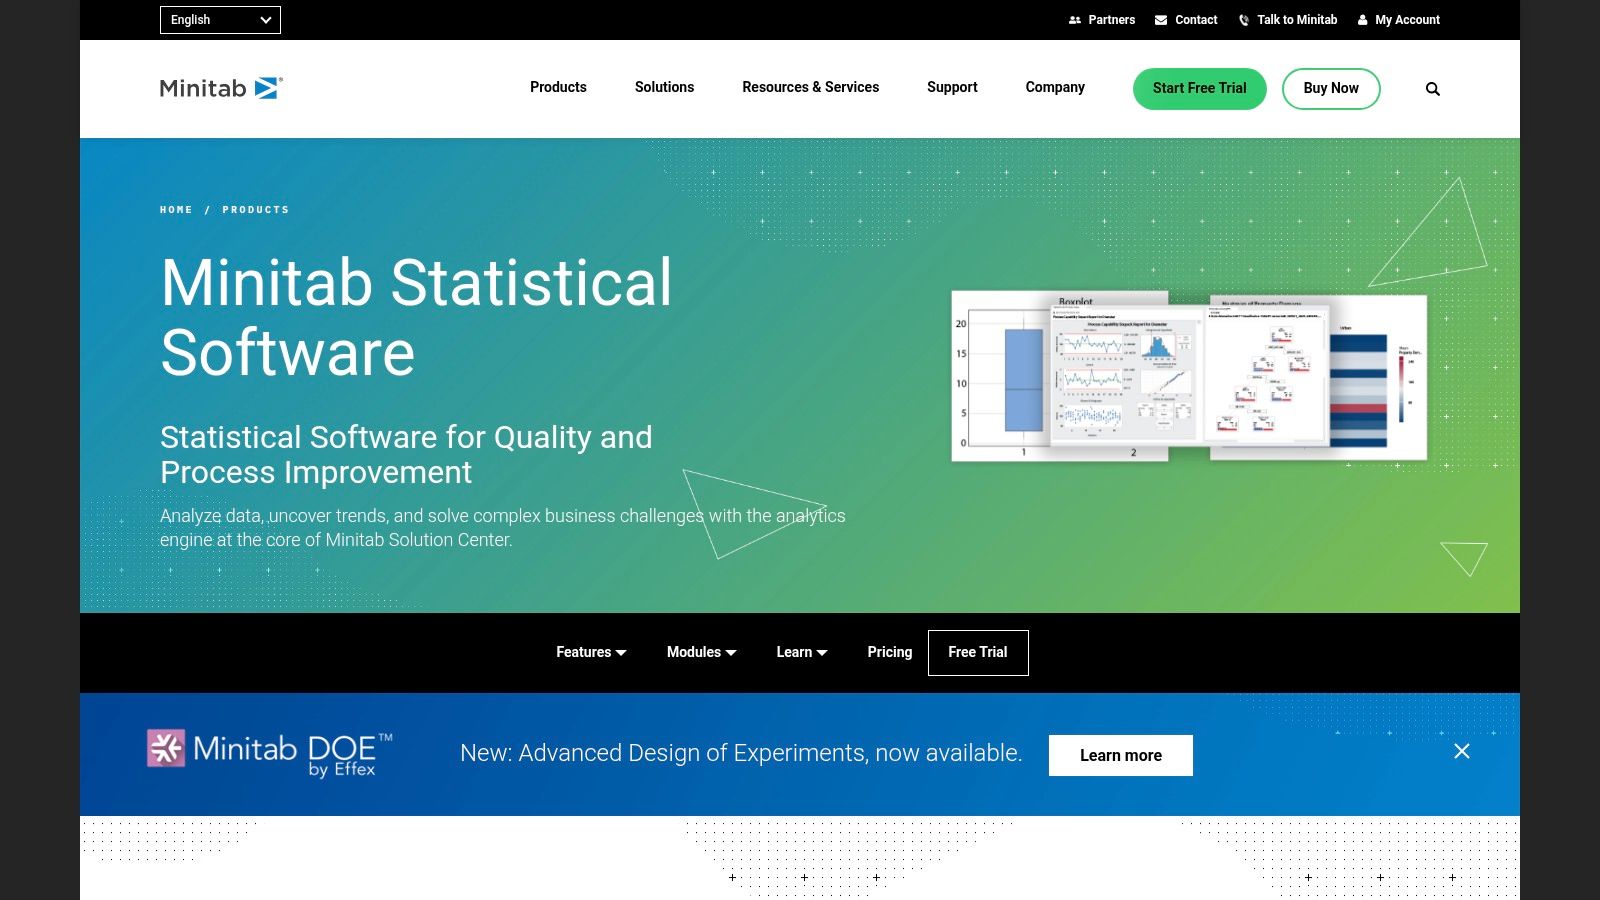
A lot of power analyses do not fail because the formula was wrong. They fail because the person planning the study picked the wrong setup, could not explain the assumptions later, or never got past a complicated interface. Minitab earns its place by reducing those failures in routine applied work.
That matters in factories, process improvement groups, supplier quality teams, and teaching labs. The user is often an engineer, quality analyst, or student who needs to size a study correctly without building a code workflow first. Minitab is good at that middle ground. It covers the standard designs these groups run, and the GUI makes the path from question to sample-size output fairly direct.
The trade-off shows up across the full workflow, not just the test menu. Minitab is easier to set up than code-first tools and easier to hand to occasional users than SAS or Stata. Reproducibility is weaker than a scriptable workflow because point-and-click work depends on screenshots, saved projects, and disciplined documentation habits. Exported output is usually serviceable for internal reporting, but it is not the same as having a fully auditable notebook that records assumption changes, rejected scenarios, and rationale in one place.
I would use Minitab in situations like these:
- A manufacturing team planning a two-sample comparison on defect rates or process means.
- A Six Sigma project where the analyst needs a defendable sample-size calculation and clear output for a review meeting.
- A classroom or training setting where method selection needs to stay visible rather than hidden in code.
- An operations group running standard DOE or equivalence-related planning without unusual design constraints.
Privacy is simple to reason about because the software is typically run locally inside an existing desktop environment. For some industrial teams, that matters more than people admit. Sending pre-study assumptions, process parameters, or quality targets into a browser tool is often harder to clear than using installed software.
Where Minitab starts to strain is the moment the study design stops being standard. Advanced clinical designs, specialized longitudinal structures, adaptive planning, and heavily regulated documentation needs usually push teams toward PASS, nQuery, SAS, or a code-based workflow with tighter auditability. In those settings, Minitab can still help with quick sensitivity checks, but it is rarely the final system of record.
PlotStudio fits beside Minitab rather than replacing it. Minitab handles the calculation quickly for common designs. PlotStudio is more useful when the job is planning the methodology, comparing assumption sets, keeping an auditable notebook, and preserving a local record of why the final setup was chosen. That combination makes sense for individual analysts and small teams that want Minitab's speed without treating a single calculator output as the whole workflow.
6. JMP (Sample Size and Power)
JMP earns its place in power planning for a reason that is easy to underestimate. A live visual explorer can expose shaky assumptions faster than a longer catalog of tests, especially in DOE, manufacturing, formulation, and product-development work where teams revise inputs in real time.
That changes the workflow, not just the interface.
In JMP, sample size and power planning often feels like part of design review rather than a separate statistical chore. Analysts can adjust variance assumptions, effect sizes, allocation choices, or design settings and immediately see the consequence. For cross-functional meetings, that matters. A process engineer, scientist, and statistician can argue about assumptions while looking at the same graph instead of passing around disconnected calculator outputs.
JMP is strongest when the question is, "How sensitive is this plan to what we are assuming?" It is less convincing when the question is, "Can this software serve as the fully auditable system of record for a regulated or highly customized study design?"
That trade-off defines where JMP fits:
- For engineering and industrial teams, the GUI is a strength because it speeds up collaborative planning and makes design choices easier to explain.
- For academic teaching and methods training, the visual feedback helps users understand power logic instead of memorizing menu paths.
- For clinical, highly specialized, or documentation-heavy workflows, the limits show up sooner. Teams often need broader design support, scriptable reruns, and outputs that plug more cleanly into validated reporting pipelines.
Reproducibility is the main practical caution. JMP can document results well enough for many internal decisions, but a point-and-click workflow is still harder to rerun, diff, and audit than code in Stata, SAS, or R. Privacy is simpler. Installed desktop software keeps pre-study assumptions local, which can matter for product specs, manufacturing targets, or internal R&D plans that teams do not want in a browser tool.
I would treat JMP as a planning workspace first and a final documentation environment second. That is not a criticism. It is a realistic description of how many teams use it well.
PlotStudio complements JMP from the other direction. JMP is useful for interactive assumption testing inside a visual environment. PlotStudio is more useful when an analyst wants to compare candidate methods, preserve the reasoning in an auditable local notebook, and keep a clear record of why one setup was chosen over another. For individual analysts and small teams, that pairing covers both sides of the workflow: fast visual exploration in JMP, and local, agentic methodology planning with exportable notes and code-adjacent traceability in PlotStudio.
7. G*Power
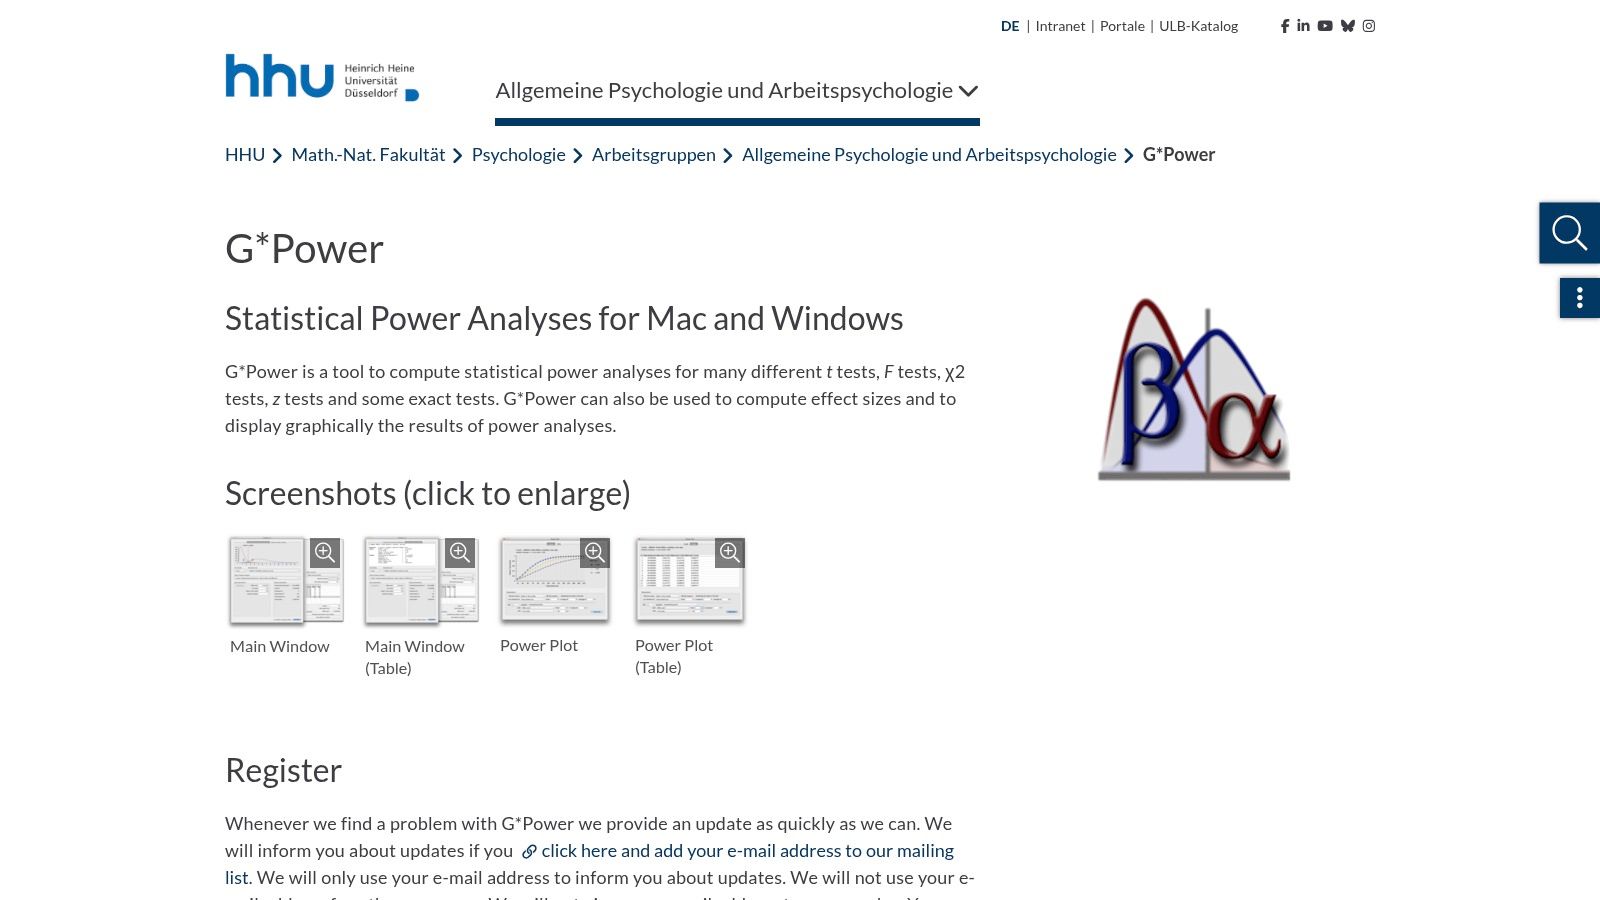
Free does not automatically mean lightweight. In practical academic planning, G*Power often covers the part of the workflow that many researchers need: choose a standard test, set an effect size, inspect the power curve, and document a defendable sample target without buying a larger platform.
G*Power remains one of the most common starting points in psychology, education, social science, and smaller biomedical studies because it keeps the setup burden low. For t-tests, ANOVA variants, correlations, chi-square procedures, and similar classical designs, that matters. A graduate student writing a preregistration, a PI planning a lab experiment, or an analyst checking whether a pilot can justify a larger follow-up study can get to an answer quickly.
The catch is that G*Power is a calculator first, not a full planning environment.
That distinction matters in real workflow comparisons. The GUI is fast and teachable, but reproducibility is manual. If a team needs to rerun assumptions across ten scenarios, diff revisions, or fold the calculations into a validated analysis record, G*Power starts to feel thin compared with code-first tools. Exportable outputs are limited, and the audit trail depends on what the analyst writes down outside the application. For an individual researcher, that may be acceptable. For a clinical group, regulated setting, or industrial team with approval gates, it often is not.
I find G*Power most defensible in three situations: early-stage study planning, methods teaching, and single-analysis workflows where the design is conventional and the documentation burden is modest. It is less comfortable for clustered designs, adaptive work, enterprise automation, or studies where sample-size justification has to survive close operational review.
A concrete example helps. If the question is "How many participants do we need for a two-sample t-test at 80 percent power under a plausible standardized effect?", G*Power is efficient. If the next question is "Can we preserve every assumption change, compare alternative models, attach rationale, and hand the full planning notebook to a collaborator or reviewer?", another layer is usually needed. That is also why analysts should spend more time on assumptions than on button clicks. A sample-size result is only as credible as the effect-size reasoning behind it, and this guide to interpreting effect sizes in context is a useful companion.
PlotStudio fits beside GPower rather than replacing it. GPower handles the single calculation well. PlotStudio is better suited to the broader workflow around that calculation: comparing candidate methods, keeping planning local for privacy, recording why one design was chosen over another, and preserving the reasoning in an auditable notebook. For individual analysts and research teams, that complement is often more realistic than expecting one desktop calculator to handle the whole job.
8. GLIMMPSE
GLIMMPSE is one of the few free tools I would reach for when a study stops looking like a textbook t test and starts looking like actual longitudinal or clustered data. Its strength is narrow but meaningful: general linear multivariate and mixed-model power problems under Gaussian assumptions, especially repeated-measures and multilevel settings that simpler calculators handle poorly.
That matters in planning workflows where the question is not just "what sample size do I get?" but "can this tool represent the design I am proposing?" For academic labs and clinical researchers working with repeated outcomes, GLIMMPSE often clears that bar better than lightweight web calculators.
A recent open-access review of power-analysis software describes that trade-off clearly. Commercial options such as PASS and SAS PROC POWER cover many preferred methods but come with license costs, while GLIMMPSE remains free, open-source, browser-based, and point-and-click (open-access review of power-analysis software).
The workflow implications are mixed. The GUI lowers implementation effort, which is useful for teaching, grant planning, and collaborations where not everyone wants to work in code. At the same time, being browser-based raises the usual questions about privacy, session persistence, and how cleanly assumptions can be exported into a record that another analyst can audit later. For some teams that is a minor concern. For regulated or highly reviewable work, it can be the deciding factor.
GLIMMPSE fits best when the model structure is more advanced than G*Power or PS can reasonably support, but the team still wants a guided interface instead of scripting everything in R, SAS, or Stata. It fits less well when the main task is comparing assumptions across many scenarios, preserving each revision, and producing notebook-style planning documentation. That is where a local, agentic complement such as PlotStudio has a different role. It helps analysts work through methodology choices, keep planning private, and leave an auditable trail, rather than serving as a single calculator.
So I would place GLIMMPSE in the specialized middle. Stronger design support than basic free calculators. Less end-to-end workflow control than code-first environments or local notebook tools. For Gaussian repeated-measures and clustered designs, that can be exactly the right compromise.
9. PS Power and Sample Size (Vanderbilt)
PS: Power and Sample Size from Vanderbilt earns its place for a narrower reason than many other tools on this list. It is a focused calculator for standard study designs, and that focus helps when the planning question is simple enough that extra platform machinery adds more friction than value.
I would use PS late in a planning conversation, not at the start. By the time it fits, the team has usually settled the endpoint, effect size logic, allocation, and core test family. Then the job is to produce a defensible sample size or power check without forcing everyone into SAS, Stata, or a commercial GUI.
When Simple Is Better
PS is strongest in small academic and clinical workflows where budget matters and the method is familiar. A student needs to size a two-group comparison. A clinician drafting a pilot protocol wants a quick sensitivity check. A collaborator needs a shared reference point that does not require installing software or writing code.
The trade-off is reproducibility.
PS is convenient, but it is still a calculator-oriented workflow. You get less help with versioning assumptions, comparing many scenarios side by side, or exporting a planning record that can be audited later. For a one-off estimate, that may be fine. For regulated studies, repeated review cycles, or teams that expect to revisit assumptions after interim design discussions, that limitation shows up quickly.
That also shapes where PS sits relative to PlotStudio. PS is useful for obtaining a number from a settled setup. PlotStudio serves a different part of the workflow. It helps analysts work through method choices locally, keep planning private, and preserve notebook-style reasoning that others can inspect later.
Best fit: teaching, pilot protocols, common comparative designs, and individual analysts who need a free, low-overhead tool.
Less suitable: adaptive designs, custom simulation-heavy work, and any setting where the power analysis needs the same audit trail as the main statistical plan.
10. WebPower (online and R package)
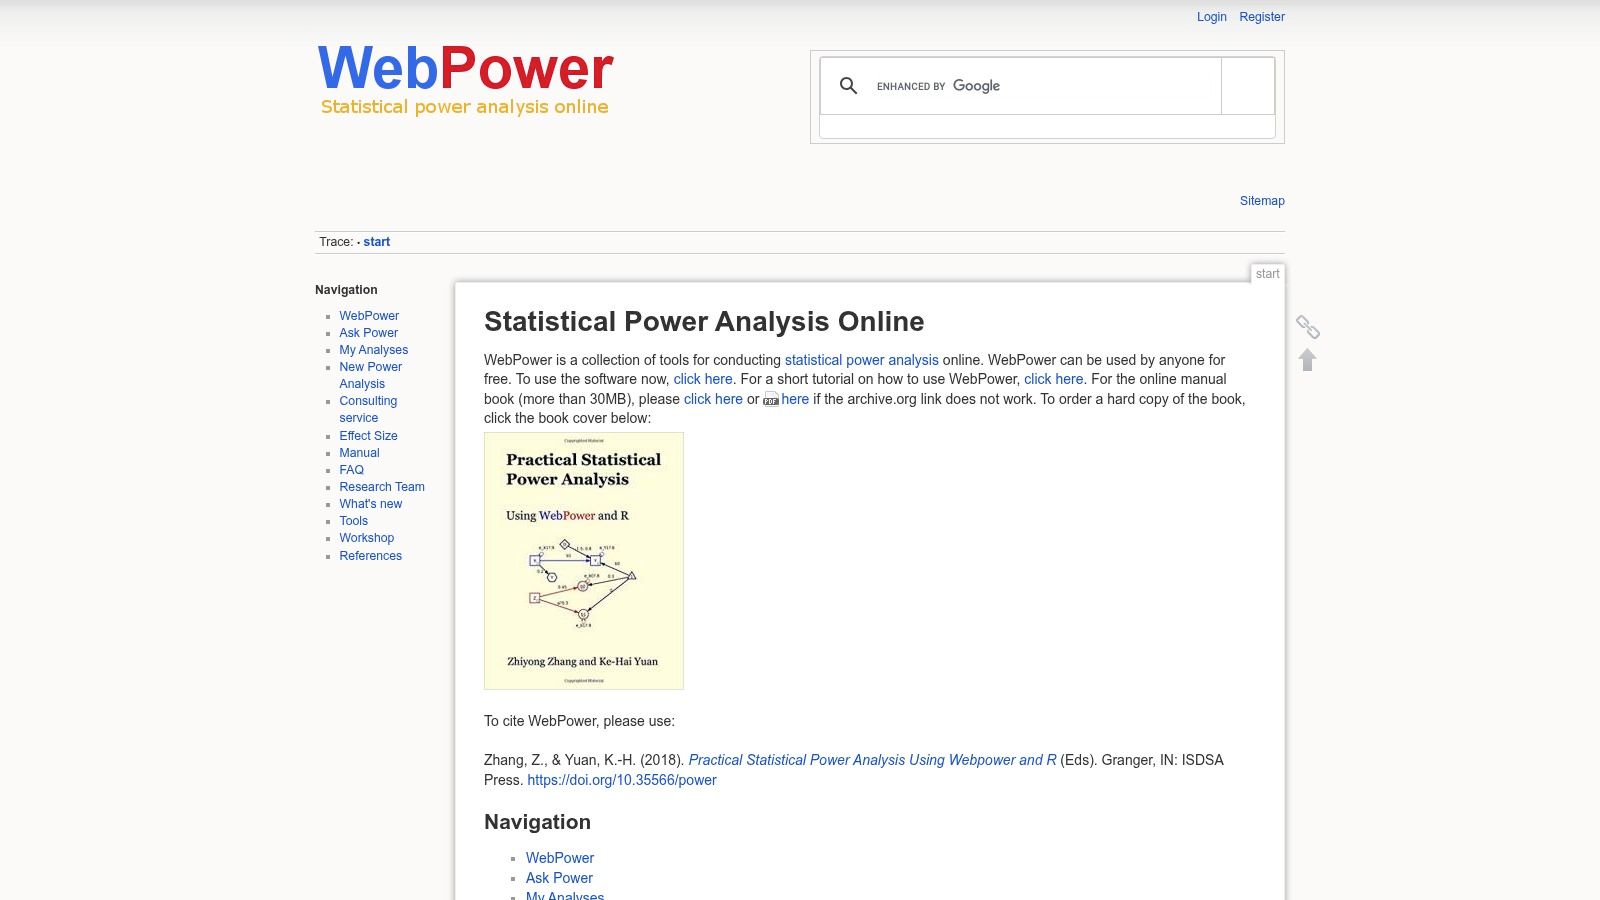
WebPower fills a gap that many power tools miss. It lets an analyst start with a browser interface, then move the same planning work into R when the study design stops being a classroom exercise and starts needing a record.
That matters in real workflows. A faculty team can use the web app during protocol discussions, settle on an effect-size range, and later script the final assumptions for a supplement or lab notebook. The online mode lowers setup effort. The R package improves reproducibility, batch scenario checking, and reuse across projects.
I see WebPower less as a destination product and more as a bridge in the workflow.
Its fit is strongest where statistical methods are reasonably standard, R is acceptable, and nobody needs enterprise governance or vendor-style reporting. That usually means behavioral science, education research, psychology, and smaller academic groups that want more than a one-page calculator result but do not need clinical-trial infrastructure.
The trade-offs are practical:
- The web interface is convenient, but browser use is still a lighter documentation path than a fully scripted notebook.
- The R package gives you versionable code, but it assumes enough fluency to validate assumptions rather than clicking through defaults.
- Output is useful for analysis planning, but it is not the same kind of polished, protocol-ready reporting you get from tools built for regulated review.
- Privacy is better with the package than the website, since local code avoids sending planning details through a browser workflow.
That last point is where WebPower and PlotStudio differ in a useful way. WebPower gives analysts a web-to-R route for established methods. PlotStudio is a local, agentic complement for analysts who need to work through method selection, preserve the reasoning in auditable notebooks, and keep planning private from the start.
Best fit: teaching labs, academic R users, social and behavioral research groups, and analysts who want a practical step up from calculator-only tools.
Less suitable: regulated studies, teams that need formal report outputs, and groups without R capacity to maintain a defensible scripted workflow.
Top 10 Power Analysis Software Comparison
| Tool | Core features | UX / Quality (★) | Value / Pricing (💰) | Target audience (👥) | Unique selling points (✨ / 🏆) |
|---|---|---|---|---|---|
| PASS (NCSS) | 1,200+ procedures for means, proportions, survival, regression, equivalence; reproducible protocol-ready reports | ★★★★★, desktop, audit-focused | 💰 Premium perpetual licenses; higher cost | 👥 Clinical biostatisticians, regulated studies | ✨ Regulator-ready reports & graphics; 🏆 broadest dedicated catalog |
| nQuery (Statsols) | Modules for fixed/Bayesian/adaptive/GSD, simulations, statement generators | ★★★★★, guided, enterprise-grade | 💰 Subscription; higher tiers cost more | 👥 Pharma/biotech trial designers, CROs | ✨ Adaptive & Bayesian trial tooling; 🏆 clinical-trial standard |
| Stata (power / sampsi) | Scriptable power/sampsi commands + GUI dialogs; simulations & tables | ★★★★☆, integrated & scriptable | 💰 Requires Stata license (varies by edition) | 👥 Analysts already in Stata, academic teams | ✨ Full-stack integration with do-files for reproducibility |
| SAS (PROC POWER) | Syntax-driven power with plotting; integrates into SAS/STAT pipelines | ★★★★☆, enterprise governance | 💰 Enterprise licensing; costly if standalone | 👥 Institutions standardized on SAS, regulated analytics | ✨ Seamless enterprise & governance integration |
| Minitab (Sample Size module) | Menu-driven power tools & templates for common tests and DOE | ★★★★, user-friendly | 💰 Subscription (mid-range, varies) | 👥 Quality engineers, applied practitioners, teaching | ✨ Task-focused templates; easy for non‑statisticians |
| JMP (Sample Size & Power) | Interactive explorers, dynamic graphs, DOE integration | ★★★★, highly visual & exploratory | 💰 Commercial subscription (variable) | 👥 Engineers, DOE teams, educators | ✨ Visual “what‑if” planning for scenario exploration |
| G*Power | A priori/post-hoc/sensitivity for t, ANOVA, regression, χ²; effect-size tools | ★★★★, simple GUI, well-documented | 💰 Free (academic) | 👥 Students, academic researchers, instructors | ✨ Free, transparent, teachable tool; widely cited |
| GLIMMPSE | Web-based GLM/GLMM power for repeated measures and multilevel designs | ★★★★, web UI, validated examples | 💰 Free, web-hosted | 👥 Biomedical & observational researchers using multilevel models | ✨ Handles clustered/repeated designs; open-source backend |
| PS: Power & Sample Size (Vanderbilt) | Web & Windows calculators for t, proportions, survival, etc. | ★★★☆☆, simple & credible | 💰 Free, academic provenance | 👥 Protocol writers, clinicians, students | ✨ Easy citation in protocols; long-standing academic source |
| WebPower (online & R pkg) | Online calculators + R functions for t, ANOVA, SEM/mediation (varies) | ★★★★, scriptable R + web UI | 💰 Free; reproducible R workflows | 👥 Behavioral/social scientists, R users, instructors | ✨ CRAN-backed engine enabling automated/reproducible analyses |
Choose the Workflow You Can Defend
The best power analysis software depends less on brand reputation than on the workflow you need to defend later.
For broad regulated catalogs, PASS is hard to ignore. It's the practical choice when you need a large method library, formal reporting, and confidence that a reviewer won't see the output as improvised. For adaptive or Bayesian clinical designs, nQuery is the stronger fit because the trial architecture, not just the final sample-size figure, is the central problem.
For teams already standardized on a platform, the answer is often simpler. Use Stata if your planning and final analysis already live in do-files and shared scripts. Use SAS if your institution relies on governed SAS pipelines and PROC-based reproducibility. The methodological purity of a standalone calculator doesn't outweigh operational continuity in those settings.
For visual DOE planning, JMP stands out because dynamic scenario exploration helps engineering and research teams reason through assumptions instead of treating the calculation as a static black box. For classical academic tests, GPower is still the easy recommendation. It became the best-known and most widely used package over a long software history, and its academic reach is hard to match. Independent indexing data also shows the 2007 GPower paper had 47,807 total citations, with 7,539 citations in 2025 alone, which underscores that it remains a methodological staple rather than a niche utility (OpenAIRE indexing for the 2007 G*Power article).
For multilevel Gaussian models, GLIMMPSE fills an important gap that standard point-and-click tools often miss. For free common-test calculators, Vanderbilt's PS remains a good minimalist option. For reproducible R workflows, WebPower is a smart bridge between teaching convenience and code-backed analysis.
How to Run and Document a Power Analysis
A defendable power analysis usually needs more than the computed output. Keep this checklist in the record:
- Research question: State the substantive question and primary estimand.
- Design choice: Identify the exact comparison or model family.
- Effect size assumption: Explain where it came from.
- Alpha and target power: Record the chosen thresholds.
- Allocation ratio: Note equal or unequal allocation.
- Attrition or clustering assumptions: Add them explicitly when relevant.
- Sensitivity analysis: Show how conclusions change under alternative assumptions.
- Exportable record: Save the full setup, code if used, and final outputs.
Traditional calculators often fall short. They compute, but they don't necessarily help you preserve the whole analytical chain. Reproducibility guidance treats retaining the code, data, and environment details as essential for verification. A durable workflow should let someone rerun and inspect what was done, not just read the final narrative.
That's also where PlotStudio fits as a complement rather than a replacement for specialist power tools. PlotStudio is agentic analytics for individual analysts and researchers. The system plans a multi-step analysis, writes and runs real Python locally on your machine, checks its own work, and saves a persistent Analysis Page with narrative, charts, code, and statistics. In practice, that means you can use a dedicated power package for the formal calculation, then use PlotStudio to structure assumptions, compare scenarios, document methodological choices, and export the result as a notebook or PDF instead of leaving the reasoning trapped in chat or memory.
That workflow distinction matters. Agentic analytics is defined as AI agents that autonomously plan, execute code-backed tasks, self-correct, and synthesize an inspectable result across the full data-to-insight chain (agentic analytics definition). Independent product explanations describe the agent as receiving a question, planning the steps, using tools like queries and visualization engines, checking its own results, and returning a completed analysis rather than a static answer (agentic analytics workflow explanation). That's much closer to how real methodological work happens than a one-shot “chat with your data” interaction.
Privacy matters too, especially for academic, medical, and policy datasets. Neutral guidance on privacy engineering supports the principle that local processing reduces unnecessary exposure by limiting where sensitive data is transmitted. That's why PlotStudio's local Python execution is meaningful, not cosmetic. Your dataset stays on your machine while the analysis runs.
The same goes for auditability. Saved Analysis Pages, inspectable Python, and Jupyter/PDF export align with what reproducibility guidance asks for: preserve the full analytical chain, not just the final conclusion.
That positioning is also consistent with independent practitioner feedback. Lorenzo Fiorio's in-depth review at The Effortless Academic evaluates PlotStudio as a purpose-built research analysis tool rather than a generic chatbot, emphasizing its fit for autonomous data work, figure generation, and data-quality-aware workflows.
Frequently Asked Questions
What does power analysis software do?
Power analysis software estimates sample size, power, or detectable effect size for a specified study design and assumption set. The best tools also help you document those assumptions clearly enough for protocols, methods sections, or audit review.
Is G Power enough for most researchers?
For many classical academic designs, yes. G*Power is often enough for t-tests, ANOVA-family work, chi-square analyses, and common correlation or regression planning. It's less suitable when you need adaptive trials, richer clustered structures, or scripting-heavy reproducibility.
Should I use GUI or code for power analysis?
Use a GUI when the design is standard and the team needs speed, learnability, or teaching clarity. Use code when reproducibility, version control, simulation, or institutional scripting matters. Many strong workflows use both: GUI for scenario discovery, code for the final recorded specification.
How do I make a power analysis reproducible?
Save the assumptions, the exact method, any code used, and the output in an exportable record. Reproducibility isn't just the final sample-size number. It's the ability to rerun the analytical chain and inspect what changed.
Does privacy matter for power analysis workflows?
Yes, especially when assumptions depend on sensitive pilot data, internal benchmarks, or confidential health or policy datasets. Tools that run locally reduce unnecessary data exposure. That's one reason local, desktop-style workflows remain attractive even as more analytics tools move to browser-first experiences.
If you want a workflow that helps you plan, inspect, and document your methodology instead of just producing a single calculator output, PlotStudio offers a useful complement. Researchers can try it through the PlotStudio research partner program with 1,000 free credits for researchers.
If your power analysis workflow currently ends with a screenshot and a vague note in the methods draft, PlotStudio AI gives you a stronger finish. It helps you turn assumptions, supporting analysis, and methodological decisions into saved, auditable analysis pages with local Python execution and notebook-ready exports. See how that fits your research process at PlotStudio AI.