The popular flowchart for statistical test selection is useful only until your data stop being simple. For repeated measurements, missing observations, covariates, or clustered subjects, the better question isn't “Which test matches my variable?” It's “What dependence structure and scientific comparison does my study require?” PlotStudio AI can help organize that investigation, but the defensible decision remains a matter of design, assumptions, and judgment.
Why Traditional Decision Trees Fail Modern Research
The familiar decision tree starts with sensible questions. Is the outcome continuous or categorical? Are there two groups or more? Are observations independent or paired? Method guides consistently emphasize these features because study design and level of measurement do drive test selection (PMC guidance on statistical test choice).
The problem is that many researchers are taught to stop there. A checkbox leads directly to “t-test,” “ANOVA,” or a non-parametric counterpart, even when the dataset contains several layers of dependence. That shortcut works for a narrowly defined comparison. It becomes unreliable when the research question concerns trajectories, within-subject correlation, site effects, or partially observed outcomes.
The checkbox problem
A patient measured at baseline and follow-up isn't represented by two independent rows. A student belongs to a classroom. A plant genotype may be evaluated across locations or blocks. A social science survey may include respondents sampled within districts. The outcome type hasn't changed, but the information structure has.
Standard guidance often covers repeated or paired data at a basic level, yet rarely tells researchers when missing repeated observations, covariates, or clustering require a model-based approach. That leaves a common question under-answered: when should a researcher move beyond a basic t-test or ANOVA template and use mixed effects, fixed effects, or survival methods?
Practical rule: If the scientific question concerns how observations depend on one another, variable type is only the starting point.
The distinction matters because a basic test may answer the wrong question while producing an apparently clean output. Treating all rows as independent can understate uncertainty. Ignoring a covariate can obscure the comparison you care about. Dropping incomplete subjects can change the population represented by the analysis.
A modeling mindset
A stronger approach begins with the design and asks what variation must be represented explicitly. You may need a random effect for participant, classroom, site, or block. You may need fixed effects for treatment, period, genotype, or policy exposure. You may need a time-to-event model when the outcome is not whether an event occurred, but when it occurred.
This doesn't mean every dataset requires a complex model. It means complexity should be assessed before the software menu dictates the method. A simple test remains appropriate when the design supports it, the estimand is clear, and its assumptions are credible. The mistake is treating simplicity as a virtue when it conceals dependence.
Mapping Variable Types and Study Design
Before choosing a test, write down the scientific comparison in one sentence. “Do treated patients improve more than controls over follow-up?” requires a different analysis from “Do two independent groups differ at one visit?” The wording exposes whether the study involves a change score, a group contrast, an interaction, or a time-to-event outcome.
Classify the outcome
Start with the outcome, but don't reduce classification to continuous versus categorical.
- Continuous outcomes include measurements such as blood pressure, yield, or a psychological scale treated as quantitative. Consider the distribution, meaningful scale, and whether the mean is the target of inference.
- Binary outcomes record two states, such as disease status or response. A contingency-table method may be suitable for a simple comparison, while regression may be needed for adjustment.
- Ordinal outcomes have ordered categories but unequal distances may not be defensible. Treating them as continuous can impose assumptions that the measurement scale doesn't support.
- Counts represent events or units, and their variance may not behave like that of a continuous measurement.
- Time-to-event outcomes contain both event timing and potentially incomplete follow-up. A binary endpoint can discard that timing information.
The predictor also matters. A treatment indicator, genotype, dose, age, site, or repeated time point carries different design implications. A covariate isn't merely another column. It can change the estimand and the method required to estimate it.
Identify the observation structure
Ask whether rows are independent, paired, or nested. The standard independent-samples t-test assumes a continuous outcome, independent observations, approximate normality, and equal variances (CASRAI's t-test guide). If measurements come in pairs, the paired t-test operates on within-pair differences rather than treating the raw observations as unrelated.
For longitudinal patient data, identify the participant first, then the visit structure, missing visits, and treatment assignment. For a genotype trial, identify genotype, environment, block, and plot. A result averaged across locations may answer a different question from a model that estimates genotype performance while accounting for environmental variation.
Let design determine the path
A useful mapping exercise is:
- Define the target comparison.
- Identify the experimental or sampling unit.
- Mark repeated, paired, or nested observations.
- Record covariates and major sources of confounding.
- Note missingness and whether follow-up differs across units.
- Choose a candidate analysis that reflects those features.
For a simple independent comparison, a t-test may be reasonable. For two independent categorical variables, a chi-square test for research data may fit the question. For repeated measurements or clustered observations, the design often points toward a mixed model or another approach that represents dependence directly.
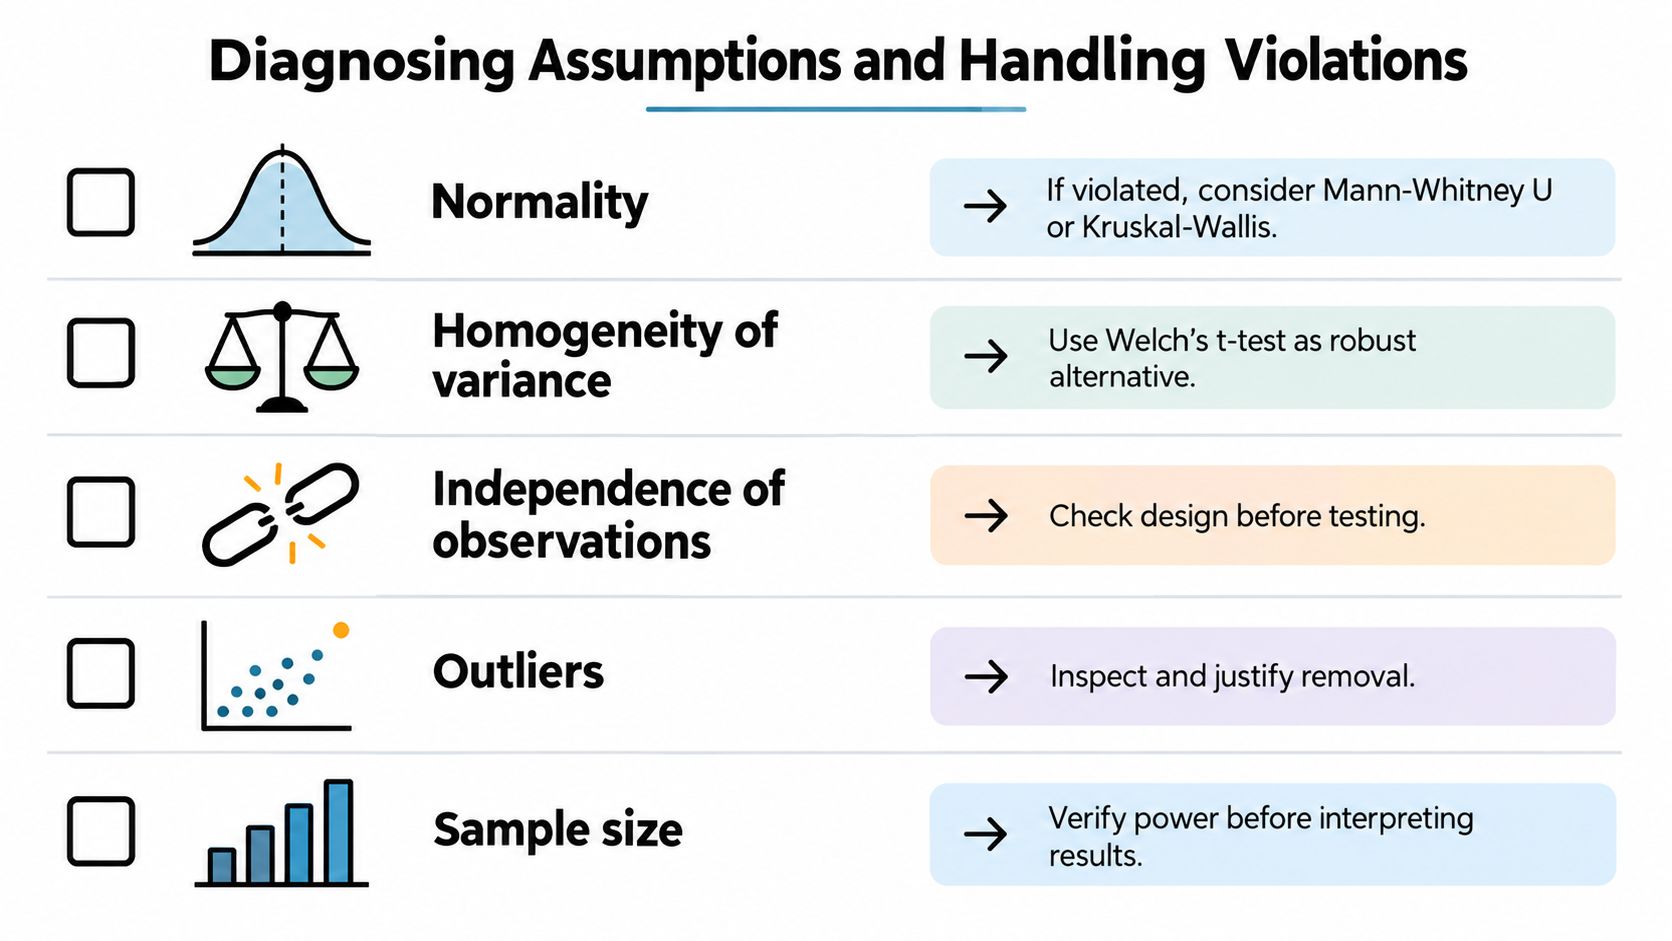
The following video offers a visual treatment of assumption diagnosis and practical remedies. It shouldn't replace a design review, but it can help researchers recognize the questions a decision tree leaves out.
Diagnosing Assumptions and Handling Violations
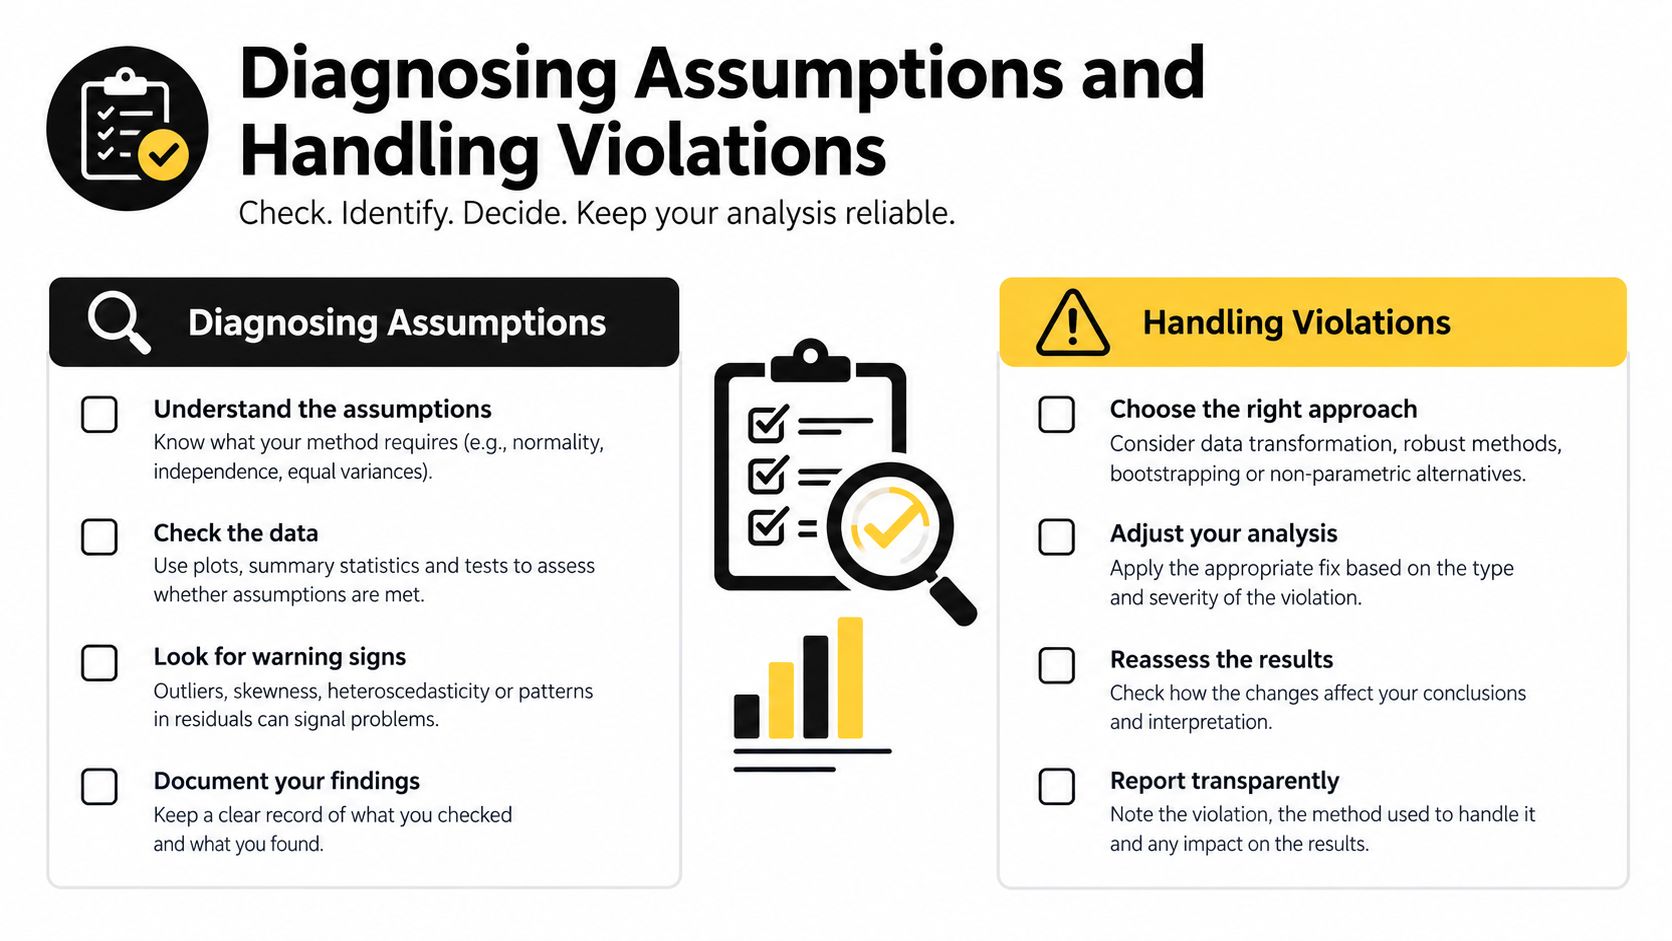
Assumption checking isn't a pass-or-fail ritual. A normality test can reject a model in a large dataset for a deviation that has little practical consequence, while a small sample can make the same diagnostic uninformative. The decision should combine design knowledge, plots, residual behavior, group balance, scientific scale, and the consequences of a wrong inference.
Check the assumptions that matter
For one-way ANOVA, the core assumptions are normality, homogeneity of variance, and independence. The residuals within each group should be approximately normal, the population variance is assumed to be common across groups, and observations should be independent (ANOVA assumptions explained by Learning Statistics with R). Homogeneity refers to the common population variance assumed across groups, even when the null hypothesis is false, because ANOVA pools variance information to estimate that common quantity.
The independent-samples t-test has a closely related assumption set. If the samples aren't independent, switching to a paired test isn't automatically correct. Pairing must come from the design, such as two measurements from the same subject or deliberately matched units. The paired t-test assumes the distribution of within-pair differences is approximately appropriate, while subjects or matched pairs remain independent (JMP's paired t-test guidance).
Diagnose, then stress-test
Use residual plots, group-wise summaries, and design diagrams before relying on a formal assumption test. Inspect outliers in their scientific context. An extreme value may be a data error, a legitimate biological response, or evidence that the chosen mean-based model is poorly suited to the outcome.
A defensible response to uncertainty can include:
- Variance concerns: Use a variance-robust comparison or a model with appropriate variance structure rather than defaulting to a transformation without justification.
- Distributional concerns: Compare the primary analysis with a rank-based or resampling-based sensitivity analysis.
- Outliers: Verify provenance, document any correction, and report how conclusions change when influential observations are handled differently.
- Dependence: Return to the sampling and measurement design. No residual plot can repair pseudoreplication created at data collection.
- Small samples: Treat diagnostics cautiously and emphasize effect estimates, uncertainty, and transparent limitations.
A non-parametric test isn't a universal escape hatch. It changes the question, the assumptions, or both.
Recent statistical guidance increasingly treats assumption uncertainty as a decision problem involving sensitivity analysis, bootstrap confidence intervals, power, and reproducibility rather than a single binary normality gate (statistical test selection guidance). The right choice is the one whose assumptions you can defend for the data and estimand, not the one selected by the shortest flowchart.
For a practical overview of equal variance and its consequences, see this guide to what homoscedasticity means in statistical analysis.
Moving Beyond Basic Tests to Model-Based Approaches
A basic test becomes inadequate when it cannot represent the structure that generated the data. Repeated clinical measurements, students within classrooms, and genotype observations across environments all create dependence that a single group comparison may ignore.
Repeated and clustered observations
Mixed-effects models are often the natural bridge between a simple comparison and a fully structured analysis. A fixed effect can represent the treatment or time contrast you want to estimate. A random effect can represent subject-specific, classroom-specific, site-specific, or block-specific variation when observations within those units are correlated.
Consider students nested in classrooms. Comparing all student scores as if each were independent gives the classroom structure no analytical role. A mixed model can separate the treatment contrast from variation associated with classrooms, provided the model and design support that interpretation.
Repeated clinical measurements create a related issue. If one participant contributes several observations, those measurements share subject-level characteristics. A model can estimate treatment, time, and treatment-by-time patterns while accounting for within-subject dependence and accommodating an analysis plan suited to incomplete follow-up.
Covariates and fixed effects
Covariates belong in the model when they are scientifically justified, measured reliably, and relevant to the estimand. Baseline severity, age, location, season, or pre-treatment yield may explain variation or reduce confounding. Adding every available variable isn't adjustment. It can create instability, obscure interpretation, or introduce bias when a variable lies on the causal pathway.
Fixed-effects approaches are useful when the research question concerns controlled contrasts across observed units such as locations, years, firms, or individuals. The choice between fixed and random effects should follow the target of inference and the sampling or experimental structure, not a preference for a particular software package.
Time-to-event questions
Survival methods are appropriate when timing matters and some observations may be censored. A question such as “Does treatment delay relapse?” isn't equivalent to asking whether relapse occurred by a selected date. A Cox proportional hazards model, for example, addresses a time-to-event formulation and can incorporate covariates, but it also requires its own diagnostics and interpretation.
This is the point at which statistical test selection becomes model selection. Researchers need to specify the estimand, dependence structure, covariates, missing-data strategy, and validation plan. An AI workflow can help execute those steps, but it can't decide whether the scientific question is causal, descriptive, exploratory, or confirmatory. For an accessible example of model-based binary outcomes, see this explanation of logistic regression.
Managing Sample Size, Power, and Multiple Comparisons
A method can be mathematically appropriate and still produce an unhelpful study if the design cannot estimate the target effect with useful precision. Sample size should be considered before data collection where possible, using a prespecified effect of scientific importance, a plausible variance or event pattern, the intended model, and the decision threshold.
Power analysis isn't a guarantee that a study will find an effect. It formalizes assumptions about what the study can detect. Those assumptions should be challenged with sensitivity analyses, especially when attrition, missing follow-up, clustering, or unequal group sizes is plausible. A method that looks powerful under independence may offer less information once the actual dependence structure is represented.
Report magnitude, not only evidence against a null
The primary result should include an effect estimate and confidence interval, alongside the test statistic or p-value where appropriate. A p-value doesn't tell readers whether the effect is scientifically important, and a wide interval signals uncertainty even when a threshold-based decision appears decisive.
For small or fragile studies, emphasize the direction and plausible range of effects. Don't interpret a non-significant result as proof of no effect, particularly when the study has limited information or substantial missingness. A careful report distinguishes absence of evidence from evidence supporting a practically negligible effect.
Control the comparison burden
Every additional hypothesis creates another opportunity for a chance finding. Decide which outcome is primary, identify secondary analyses, and label exploratory work clearly. If several hypotheses matter, use a correction aligned with the inferential goal rather than selecting a method after seeing the results.
| Method | Strictness | Best use case |
|---|---|---|
| Bonferroni | Strict | A small, prespecified family of hypotheses where strong control of any false positive is important |
| Holm-Bonferroni | Less conservative than standard Bonferroni | Confirmatory families requiring family-wise error control with improved efficiency |
| Benjamini-Hochberg | Controls the false-discovery proportion | Exploratory or high-dimensional analyses where discovering plausible signals matters |
These methods don't rescue an unfocused research question. They make the multiplicity decision visible. The analysis plan should state which comparisons are confirmatory, which are exploratory, and how effect sizes and intervals will be interpreted.
Researchers planning a study can use a power analysis workflow for statistical research to make assumptions explicit before choosing the final test or model.
Automating Rigorous Analysis with Agentic Analytics
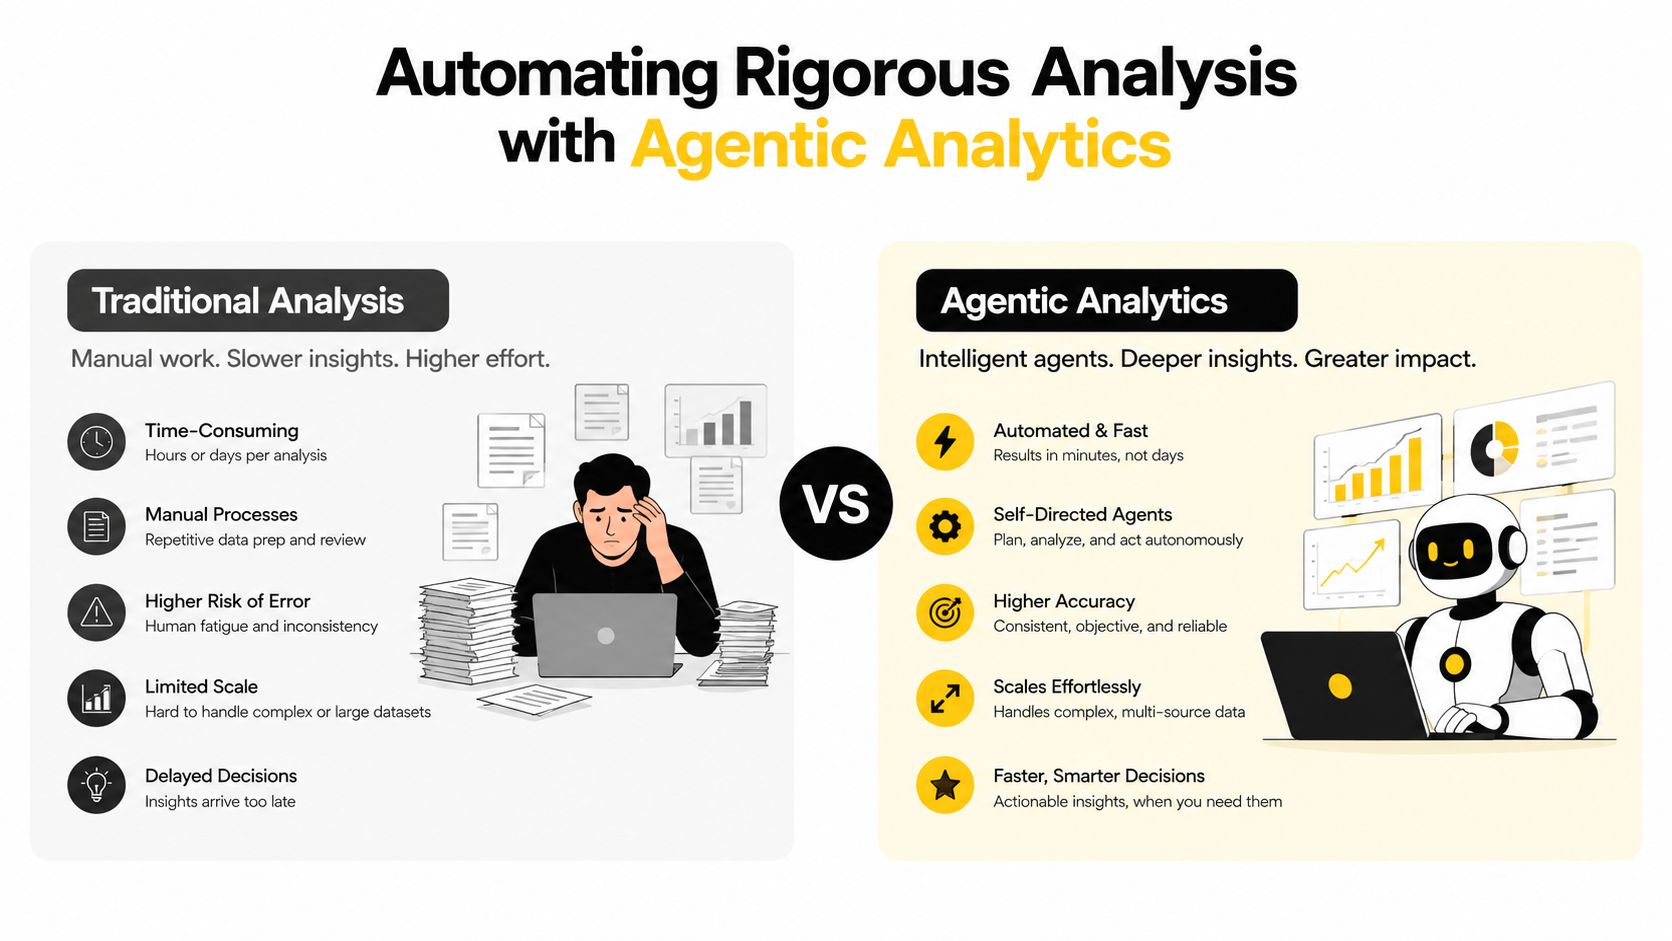
Manual analysis often fails through sequence errors rather than a lack of statistical formulas. A researcher may inspect the outcome, run a test, notice a problem, revise the method, and then forget to update the figures, assumptions, or written interpretation. Reproducibility suffers when those decisions remain scattered across notebooks and chat messages.
Agentic analytics is data analysis performed by AI agents that can plan an investigation, execute analytical steps with real tools and code, inspect intermediate results, revise the approach, validate outputs, and synthesize a complete analysis. The distinction is practical. An answer is an output. An analysis is an investigation.
Manual work compared with agentic workflows
| Workflow dimension | Manual coding | Agentic analytics with PlotStudio AI |
|---|---|---|
| Initial profiling | Researcher writes or assembles checks | The system can inspect the dataset and surface data-quality issues |
| Method planning | Decisions are distributed across notes and scripts | A structured plan can be reviewed before execution |
| Computation | Researcher runs Python or another tool step by step | Python runs locally through the analysis workflow |
| Revision | The researcher identifies failures and updates code | Agents can inspect intermediate outputs and adjust the approach |
| Reproducibility | Depends on disciplined notebook practice | Analysis Pages preserve methodology, code, outputs, and interpretation |
| Human judgment | Direct and central | Still required for design, estimand, assumptions, and scientific meaning |
PlotStudio AI is an AI tool for researchers who need to investigate data, not merely chat with it. A user provides data and an objective, then the workflow can profile the dataset, propose a plan, execute Python locally, inspect results, create charts and statistics, and save the work as a reproducible Analysis Page. Researchers can review the plan, inspect generated code, and export a Jupyter notebook or PDF rather than accepting an opaque summary.
That makes it reasonable to consider PlotStudio AI as a Julius AI alternative when the priority is multi-step analysis, local Python execution, methodology visibility, and reproducibility. It isn't a substitute for a biostatistician's judgment. It can reduce mechanical work while leaving the researcher responsible for the question, design, interpretation, and validation. The same principle applies in other evidence workflows, including earnings calls and SEC filings signals, where analysts need to trace conclusions back to inspectable source material rather than rely on a compressed answer.
For more context on AI-powered analytics for research data, focus on whether the tool exposes its plan, code, assumptions, and intermediate outputs. Those artifacts make review possible.
Frequently Asked Questions
How do I choose a statistical test?
Start with the research question, outcome scale, number of groups or measurements, and whether observations are independent, paired, or nested. Then evaluate assumptions, covariates, missingness, and the estimand before selecting a test or model.
When should I use a mixed-effects model instead of ANOVA?
Use a mixed-effects model when repeated or clustered observations create dependence, or when you need to represent subject, classroom, site, or block variation. Standard ANOVA may be suitable only when its design and independence assumptions match the data.
Is a non-parametric test better when data aren't normal?
Not automatically. Examine the severity and source of the deviation, the sample structure, outliers, and the target estimand. A model, resampling analysis, transformation, or sensitivity analysis may be more informative than switching mechanically to a rank-based test.
What should I report besides a p-value?
Report the effect estimate, confidence interval, analysis population, assumptions, missing-data handling, and any multiplicity adjustments. Explain whether the analysis was confirmatory or exploratory and whether conclusions change under reasonable sensitivity analyses.
Can AI choose the right statistical test?
AI can profile data, propose methods, execute code, and compare diagnostics, but it can't replace scientific judgment. The researcher must verify the design, estimand, assumptions, causal interpretation, and suitability of the final model.
The durable lesson in statistical test selection is simple: don't let a variable-type checklist stand in for study design. Basic tests remain useful when the observations and assumptions support them. Once repeated measures, missingness, clustering, covariates, or event timing become central, the defensible choice is usually a model that represents those features directly.
If you'd like to test this workflow on your own research data, download and try PlotStudio AI. Researchers can also check the current academic offering and the available 1,000 free credits for researchers before starting.