Cross-validation is a resampling method that repeatedly divides data into training and validation sets to estimate how a model will perform on unseen cases. If you fit a regression on patient data, cross-validation helps reveal whether the model learned a transferable relationship or merely benefited from one convenient split.
A single holdout can make a model look safe when the split happens to be easy. The harder problem is that even cross-validation can mislead you if future observations, preprocessing decisions, selected features, or tuned hyperparameters leak across the boundary. Reliable validation starts with understanding what the boundary is supposed to represent.
Why Researchers Use Cross Validation in the First Place
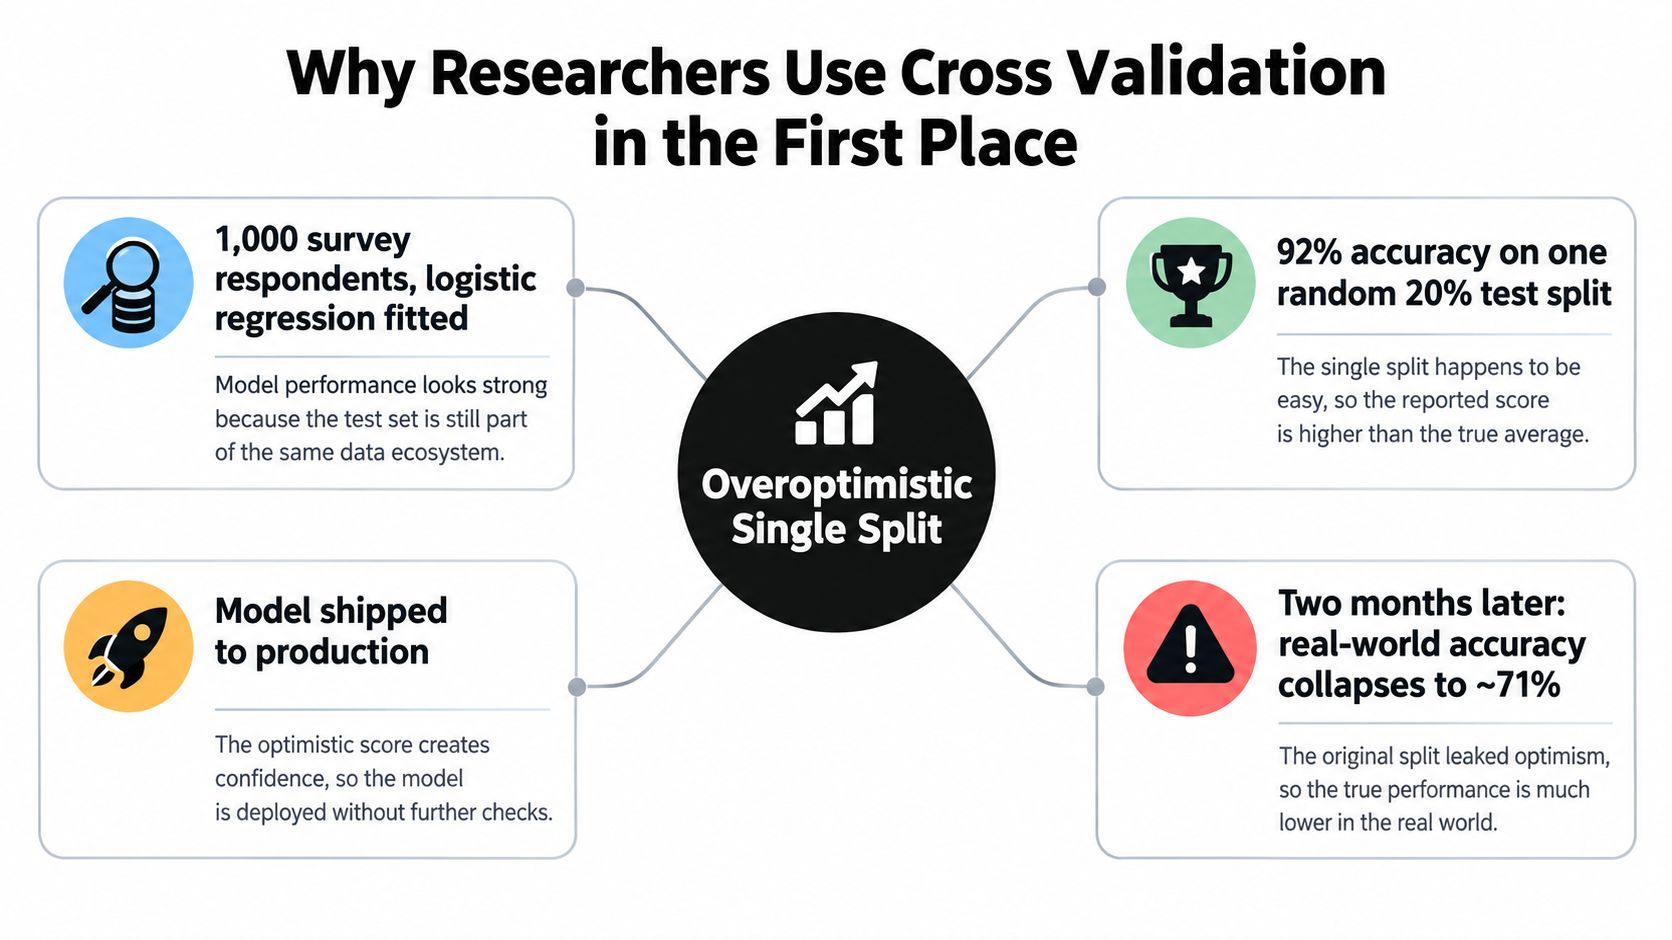
A junior analyst fits a logistic regression to survey data, reports an excellent accuracy score from one random train-test split, and ships the model. Later, performance drops when new respondents arrive. The model may not have failed because logistic regression was inappropriate. The evaluation may have measured only the luck of one split rather than the model's expected performance on new cases.
Cross-validation repeatedly resamples data into training and validation splits to estimate generalization on unseen cases. Instead of trusting one partition, you fit and evaluate the model several times, changing which observations are held out.
What changes compared with a holdout
A fixed holdout answers a narrow question: how did this fitted model perform on this particular collection of held-out rows? That can be useful, especially when you have abundant data and a final untouched test set, but the result depends heavily on how representative that split is.
Cross-validation gives you several related views:
- A distribution of scores: You see whether performance is consistent or whether one fold is unusually easy or difficult.
- A mean and a spread: The average summarizes typical performance, while variation across folds signals instability.
- More efficient use of observations: Each row contributes to validation once in ordinary k-fold cross-validation and contributes to training in the other folds.
The method has a long history. Sample-splitting ideas appeared before modern machine learning, with historical references reaching back to the 1930s and early predictive cross-validation work appearing in the 1960s. The modern statistical milestone came with Stone's paper published in 1974, followed by independent development by Geisser in 1975, as described in the historical review of cross-validation by Hastie and colleagues.
Practical rule: Cross-validation doesn't make a weak dataset representative. It gives you a more informative estimate of performance under the splitting rule you chose.
By the end of a sound validation workflow, you should be able to choose a fold count, identify leakage, handle temporal and grouped data, and report a result you can defend. For researchers working on generalizability, the distinction between a score and a defensible estimate is central to generalizability in research.
How K-Fold Cross Validation Actually Works
K-fold cross-validation extends the ordinary holdout idea. You divide the development data into k folds, train on all but one fold, evaluate on the remaining fold, and rotate the validation fold until every observation has been held out.
Suppose you choose 5-fold cross-validation for a dataset. After a suitable shuffle, the observations are divided into five parts. The first run trains on folds 2 through 5 and validates on fold 1. The second run trains on folds 1, 3, 4, and 5 and validates on fold 2. The process continues until each fold has served as validation data once.
You then calculate the chosen metric for each run and average the results. That average is a cross-validation estimate, not a guarantee. The individual fold scores matter because they show whether the average hides instability.
What k controls
The value of k controls both the size of each validation fold and how much data the model sees during each fit.
- k = 5 usually gives a reasonable computational cost and a slightly smaller training set in each run.
- k = 10 is a common practical choice when the dataset is not enormous and the extra fits are affordable.
- Leave-one-out cross-validation, or LOOCV, sets k equal to the sample size. Each observation becomes its own validation fold.
The statistical trade-off is more subtle than “larger k is better.” With larger k, each model trains on more of the available data, which can reduce bias in the estimated error. However, the training sets overlap heavily, so the fold estimates can be strongly correlated and the overall estimate may be variable. LOOCV often looks attractive because it uses almost all observations for training, but it can be computationally expensive and sensitive to individual observations.
The modern clinical-statistics review of cross-validation describes 5 or 10 folds as common choices and places leave-one-out at the extreme where each observation is held out once.
K-fold variants at a glance
| Variant | Training fraction per fold | Bias | Variance | Runtime | Best for |
|---|---|---|---|---|---|
| 5-fold | About four fifths | Somewhat higher | Often manageable | Five model fits | Fast comparisons and ordinary tabular data |
| 10-fold | About nine tenths | Often lower | Can be more variable | Ten model fits | A practical default when compute allows |
| Leave-one-out | Almost all observations | Low | Often high | One fit per observation | Very small datasets and simple models |
A useful rule is to start with 5 or 10 folds, then change the choice only when the data structure, model cost, or research objective gives you a reason.
Common Cross Validation Variants and When to Use Each
The right cross-validation variant follows the way observations were generated. A classification dataset, a patient registry, and a forecasting table don't share the same independence assumptions, so they shouldn't automatically share the same splitter.
| Variant | Best for | Default use case | Watch out for |
|---|---|---|---|
| Stratified k-fold | Classification | Preserve class proportions across folds | Rare classes may still be too sparse |
| Repeated k-fold | Model comparison | Check whether a ranking persists across reshuffles | Repetition increases runtime |
| Leave-one-out | Very small samples | Use nearly all observations for training | High variance and many fits |
| Leave-one-group-out | Grouped observations | Hold out complete patients, users, hospitals, or sessions | Groups must be identified correctly |
| Time-series or rolling-origin CV | Forecasting | Train on earlier data and validate on later data | Random shuffling breaks chronology |
Four decisions that prevent common mistakes
For ordinary tabular classification, stratified k-fold is usually the right default. It keeps the target-class composition approximately similar across folds, which makes metrics such as recall and macro-F1 more interpretable when classes are uneven.
Use repeated k-fold when you're comparing models and want to know whether the difference survives different assignments of observations to folds. Repetition doesn't repair leakage or a bad splitting rule, but it can reveal whether a small apparent advantage is unstable.
Use leave-one-group-out when rows belong to patients, users, sessions, hospitals, farms, or other meaningful units. A model that trains on one row from a patient and validates on another row from the same patient has an easier task than the deployment problem if deployment involves new patients.
For forecasting, use rolling-origin or blocked time-series validation. The training window must precede the validation window. Whether the window expands or rolls depends on whether older observations should remain relevant.
Rule of thumb: Before choosing k, ask what must be unseen at deployment. Put that unit, whether it's a row, group, or future period, on the validation side.
Researchers who want a more detailed model-selection workflow can consult this guide to machine learning model selection, but the principle is simple: the split must imitate the claim you want to make.
Data Leakage and Why Your CV Score Is Probably Too High
Data leakage is information crossing from validation data into model fitting or model selection. It's the most common reason a cross-validation score looks impressive and then fails under a clean evaluation.
Three forms deserve immediate attention:
| Leakage type | What goes wrong | Fix inside CV |
|---|---|---|
| Preprocessing leakage | Scaling, imputation, or PCA uses statistics from validation rows | Fit each transformer on the training fold only |
| Feature-selection leakage | Features are selected using the full feature matrix and target | Select features separately inside each training fold |
| Target leakage | A feature contains a transformed target or information created after the outcome | Remove the feature or recreate it using information available at prediction time |
A typical mistake is to standardize the complete dataset, run feature selection on the complete matrix, and only then call a cross-validation function. The validation rows have already influenced the transformation or selection, even though they weren't passed directly to the estimator.
The same issue arises with imputation, principal component analysis, down-sampling, and SMOTE. If the operation is estimated from data, it belongs inside the training fold. A StandardScaler should be fitted on the current training portion, then applied to that fold's validation portion. A selector such as SelectKBest should make its decision without seeing validation outcomes.
A safer pipeline pattern
A leakage-prone workflow might conceptually do this:
X_scaled = scaler.fit_transform(X)X_selected = selector.fit_transform(X_scaled, y)cross_val_score(model, X_selected, y, cv=cv)
The problem is that scaler and selector saw all rows before the folds were created.
A safer scikit-learn pattern places every learned transformation in a Pipeline, with column-specific operations handled by a ColumnTransformer:
pipeline = Pipeline([("preprocess", ColumnTransformer([...], remainder="drop")), ("select", SelectKBest(...)), ("model", LogisticRegression(...))])
cross_val_score(pipeline, X, y, cv=cv, scoring="accuracy")
The exact estimator and preprocessing steps depend on the research question, but the structural rule doesn't change. The cross-validation function receives the raw predictors, and the pipeline fits its transformations anew inside each training fold.
A methodological warning in How Cross-Validation Can Go Wrong and What to Do About It explains why preprocessing, feature selection, hyperparameter tuning, and class balancing must be handled within the folds. It also cautions that even nested or repeated procedures can be biased or variable if their design doesn't match the intended evaluation.
If a CV score is dramatically better than a clean holdout from the same deployment scenario, inspect leakage before celebrating. Leakage is often a data-preparation problem, not a modeling breakthrough.
Time Series and Grouped Data Need a Different Rule
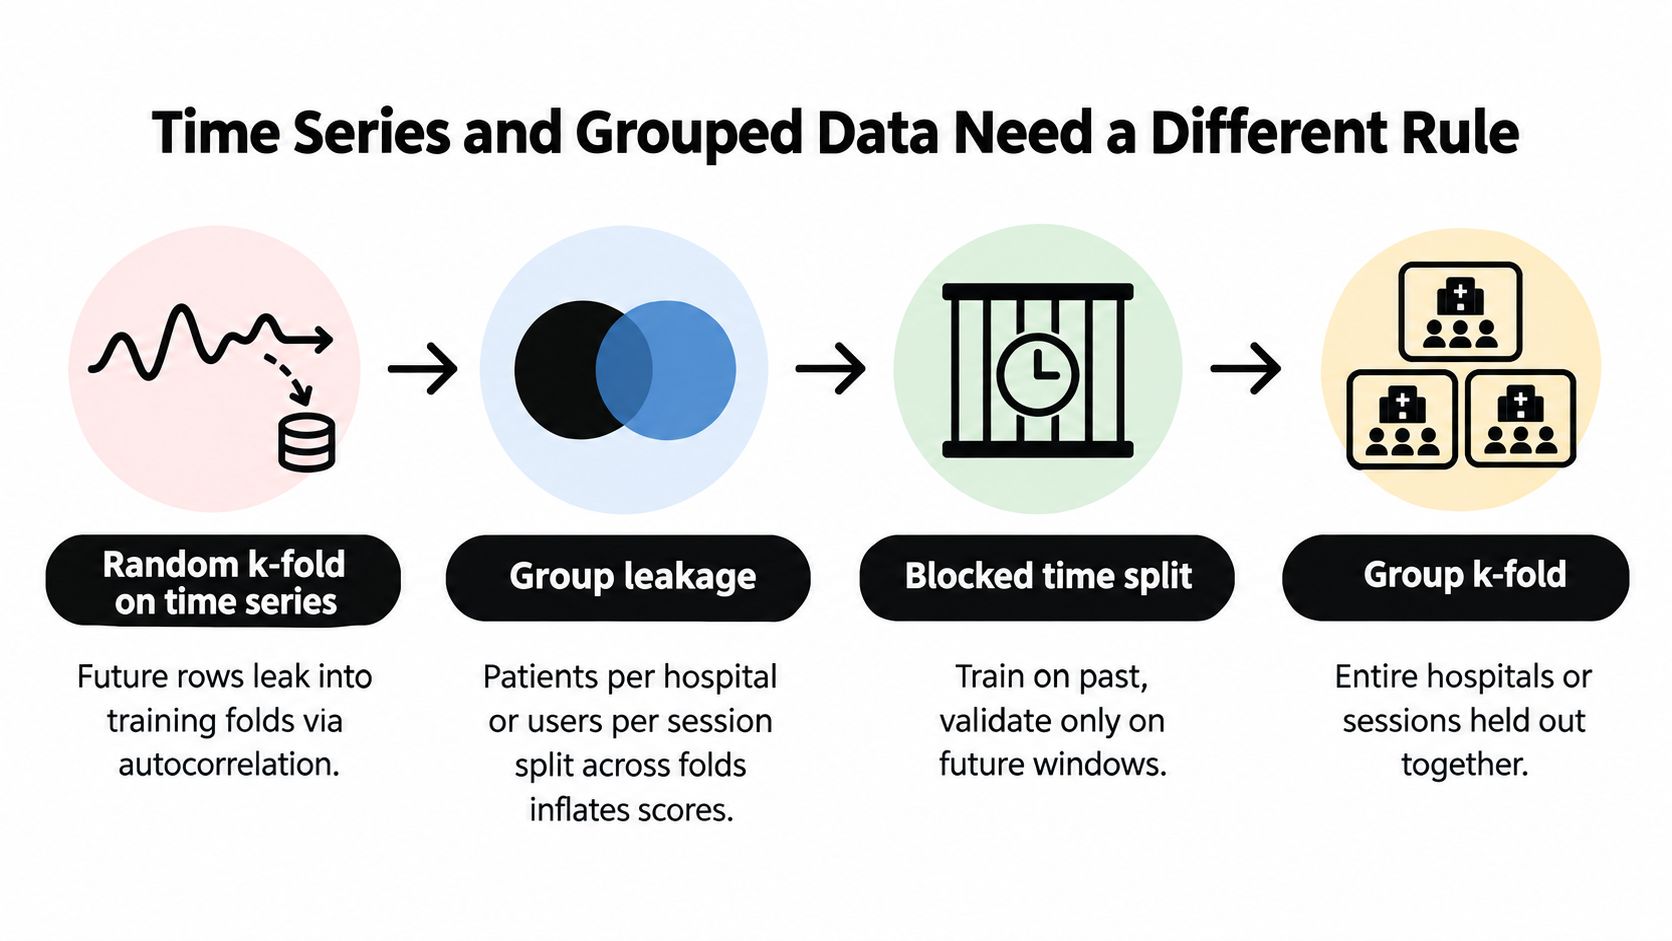
Random k-fold assumes that observations can be exchanged without changing the meaning of the evaluation. That assumption breaks when rows are linked by time or membership.
In a time series, nearby observations can share temporal patterns. A random fold may train on a later observation while validating on an earlier one. In grouped data, rows from the same patient, hospital, user, or session may share persistent signals. Splitting those rows across folds lets the model recognize the group rather than generalize to a new group.
Forecasting requires chronology
For forecasting, use an expanding or rolling window. The logic looks like this:
- Train on the earliest available period.
- Validate on the next period.
- Move the boundary forward.
- Add new observations to training if using an expanding window.
- Repeat until several future windows have been evaluated.
This evaluates the actual direction of prediction, past to future. It also exposes concept drift, where the relationship between predictors and outcomes changes over time.
A recent time-series leakage study reported that standard 10-fold cross-validation produced RMSE gains of up to 20.5% under some lag settings, while simpler 2-way and 3-way splits stayed below 5% gain. Those gains are a warning sign, not evidence that shuffled cross-validation improved forecasting. They show how temporal leakage can make an evaluation look materially better than a chronology-respecting alternative, as documented in the time-series leakage study.
For a practical overview of forecasting workflows, see these time-series analysis methods.
Groups must stay intact
Use GroupKFold or LeaveOneGroupOut when the deployment question concerns new groups. For example, a clinical model intended for new patients should not validate on records from patients whose other records appeared in training. An agricultural model intended for new fields may need to hold out entire fields rather than individual plot measurements.
The same principle applies to repeated measures. If one participant contributes multiple observations, the participant is usually the splitting unit. Otherwise, the model may learn participant-specific characteristics and report an error that doesn't represent performance for a new participant.
Choosing K, Metrics, and Nested or Repeated CV
Choosing k is only one part of validation. A stable estimate with the wrong metric can still answer the wrong question.
For many ordinary datasets, 5 or 10 folds are practical starting points. Use the smaller value when model fitting is expensive or the dataset is large enough to support it. Use the larger value when the sample is limited and the additional computation is acceptable. Reserve leave-one-out for settings where its use is justified by the sample size and model behavior, not because it sounds maximally data-efficient.
Match the metric to the consequence
- RMSE penalizes larger continuous prediction errors more heavily.
- MAE gives a more direct average error scale and is less dominated by extreme errors.
- Accuracy can be adequate for balanced classification, but it can hide poor minority-class performance.
- Macro-F1 gives each class equal influence and is useful when class-level performance matters.
- Log-loss evaluates the quality of predicted probabilities.
- PR-AUC is often more informative than accuracy when the positive class is uncommon.
- Quantile or pinball loss is useful when the research question concerns conditional tails rather than the conditional mean.
Choose one primary metric before comparing models. Add a secondary metric as a diagnostic, not as an opportunity to report whichever result looks most favorable. For classification diagnostics, a careful ROC curve interpretation guide can help clarify what the chosen threshold and metric do and don't tell you.
| Data profile | Suggested k | Metric family | CV structure |
|---|---|---|---|
| Ordinary regression | 5 or 10 | RMSE or MAE | K-fold, with preprocessing inside folds |
| Balanced classification | 5 or 10 | Accuracy or macro-F1 | Stratified k-fold |
| Imbalanced classification | 5 or 10 | Log-loss, macro-F1, or PR-AUC | Stratified k-fold |
| Small sample with tuning | 5 or 10 | Metric aligned to the outcome | Nested CV or a separate untouched test set |
| Ordered observations | 5 or 10 evaluation windows where feasible | Forecasting loss | Rolling-origin or blocked splits |
Tuning and evaluation are different jobs
If you use CV to select hyperparameters and then report the same CV score as though the model had never been tuned, the score can be optimistic. The validation results influenced your choice.
Nested cross-validation separates the jobs:
- The inner loop tunes hyperparameters, selects features, and makes other training decisions.
- The outer loop evaluates the complete tuning procedure on data that the inner loop never used.
- The outer-fold scores summarize how the whole selection process generalizes.
Repeated CV answers a different question. It examines how much the result changes across repeated fold assignments. It can improve your understanding of stability, but it doesn't automatically produce an unbiased estimate after extensive tuning. Keep the distinction clear.
Computational Trade-offs and Practical Recommendations
Cross-validation is a statistical procedure with a computational bill. A model fitted with k-fold CV is trained once per fold. A 5-fold run requires five fits, a 10-fold run requires ten fits, and leave-one-out requires one fit per observation. Repeating the procedure multiplies those fits again.
That matters when you compare many models, tune several hyperparameters, or use an estimator with expensive optimization. A 10-fold run isn't merely a more careful version of a 5-fold run. It can take roughly twice as many model fits before accounting for differences in training-set size.
| Strategy | Fits per run | Relative cost vs 5-fold | When it pays off |
|---|---|---|---|
| 5-fold | 5 | Baseline | Routine model comparison |
| 10-fold | 10 | Higher | Limited data and affordable training |
| 5-fold repeated 2 times | 10 | Similar to 10-fold per overall run | More stable comparison without extreme cost |
| 5-fold repeated 3 times | 15 | Higher | Noisy model rankings and manageable compute |
| Leave-one-out | Number of observations | Potentially much higher | Very small samples and cheap estimators |
Repeated 10-fold cross-validation can be excessive for a model that already takes hours to fit. The additional estimates may not change the practical decision enough to justify the cost. For a day-long experiment, repeated 5-fold CV may be a more defensible compromise than repeatedly fitting the most expensive configuration.
On the other hand, leave-one-out can be reasonable for a small dataset when each fit is cheap. Large datasets may not need elaborate resampling because a well-designed holdout can contain many representative cases. Deep-learning workflows often use a single holdout or a small number of folds because repeated full training is costly.
Senior-reviewer recommendation: Start with 5 or 10 folds. If the ranking between models matters, repeat 5-fold cross-validation with different seeds, inspect the spread, and stop increasing compute when the decision is already stable.
Report the mean and standard deviation across folds, the splitting strategy, the metric, the randomization procedure, and whether tuning occurred inside an inner loop. A score without that context isn't reproducible enough for a research report.
A Researcher Checklist Before You Trust Any CV Number
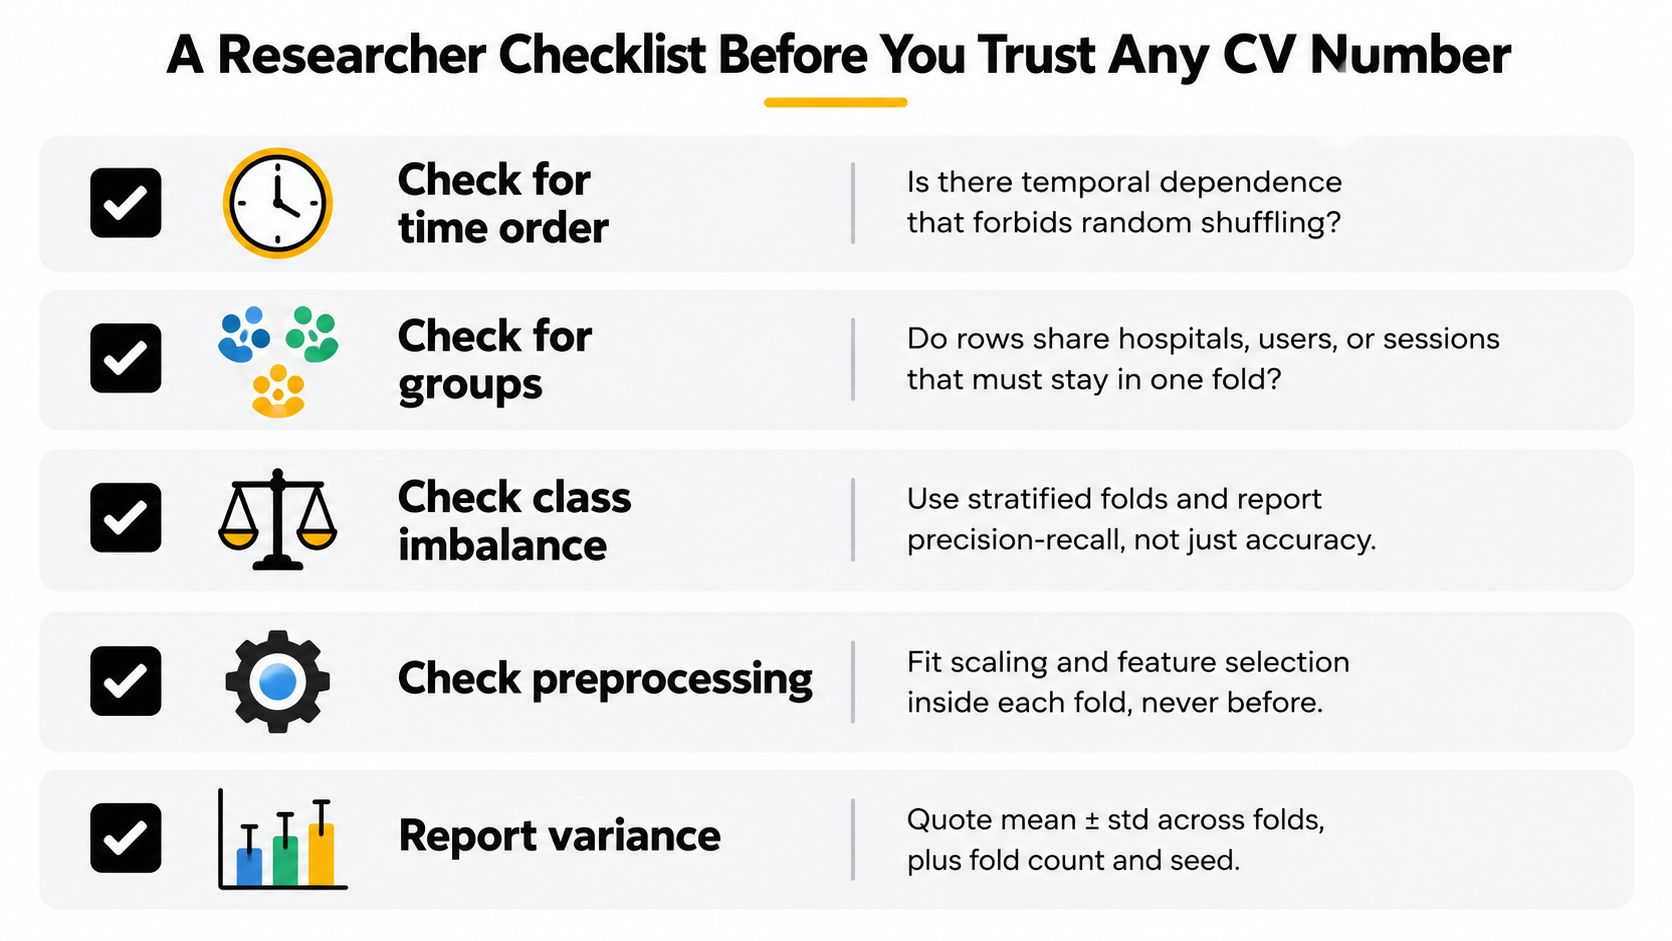
A cross-validation result becomes defensible when the procedure reflects the data-generating process and the deployment claim. Run this checklist before reporting a score.
- Profile the observations. Check time order, repeated measurements, group identifiers, class imbalance, duplicate rows, and records that may represent the same underlying case.
- Choose the splitting unit. Use rows only when rows are plausibly independent. Otherwise split by time, patient, user, site, field, session, or another meaningful group.
- Keep learned operations inside the fold. Scaling, imputation, feature selection, dimensionality reduction, resampling, and hyperparameter search must be fitted using training data only.
- Declare the primary metric. Match it to the cost of errors and add a secondary metric for a sanity check.
- Separate selection from evaluation. Use nested CV or a completely untouched test set when the same data will drive extensive model tuning.
- Report variation. Give the mean, standard deviation, fold count, split method, random seed where relevant, and the range of per-fold scores.
A clean validation report should also describe what the score does not establish. Cross-validation doesn't prove causal validity, remove confounding, guarantee calibration, or replace domain review. It estimates performance for a defined prediction task under a defined splitting rule.
For reproducible work, preserve the code, preprocessing decisions, fold assignments, metrics, and model-selection procedure. A workflow built around research reproducibility makes it easier for another researcher to audit how the reported number was produced.
Frequently Asked Questions
What is cross validation in machine learning?
Cross-validation is a repeated train-validation procedure used to estimate how a model may perform on unseen observations. The data is divided according to a chosen strategy, the model is fitted on one portion, evaluated on another, and the results are summarized across splits.
Is 10-fold cross-validation always the best choice?
No. Ten-fold cross-validation is a common practical default, but it isn't appropriate for every dataset. Time-dependent data usually needs chronological validation, grouped data needs group-aware splits, and expensive models may justify fewer folds.
What is the difference between cross-validation and a train-test split?
A train-test split evaluates a model on one held-out partition. Cross-validation evaluates several train-validation partitions and summarizes their results. A final untouched test set can still be useful after cross-validation and tuning.
Why does preprocessing need to happen inside each fold?
Preprocessing steps such as scaling, imputation, PCA, and feature selection can learn information from the data. If they are fitted before splitting, validation rows influence the model-development process and the resulting score can be too optimistic.
When should I use nested cross-validation?
Use nested cross-validation when you need to tune a model and estimate the performance of that tuning process on unseen data. The inner loop selects settings, while the outer loop evaluates the complete selection procedure.
Conclusion
Cross-validation is not a magic accuracy booster. It is a measurement design: you decide what should be unseen, reproduce that boundary across folds, fit every learned transformation inside the training data, and report both central performance and variation.
For ordinary independent tabular data, 5-fold or 10-fold validation is a sensible starting point. For imbalanced classification, stratify. For patients, users, and sessions, hold out groups. For forecasting, preserve time. When tuning is substantial, separate tuning from evaluation with nested validation or a final untouched test set.
If you want to operationalize this process in an auditable research workflow, try PlotStudio AI, which supports inspectable analytical steps and reproducible outputs for researchers.