You're at the point in a trial where the data are cleaned enough to trust, but not yet trusted enough to report. The key questions are already in front of you, which estimand are you answering, what happens after discontinuation or rescue therapy, which outputs can survive regulator scrutiny, and how will someone else reproduce the result without guessing at your choices? That's the practical heart of clinical trial data analysis.
Clinical trial data analysis starts with a prespecified question, not a late-stage test. The most defensible workflows tie the protocol, the statistical analysis plan, the estimand, the handling of intercurrent events, and the reporting structure together before unblinding, so the final inference matches the clinical question and can be reviewed, repeated, and defended.
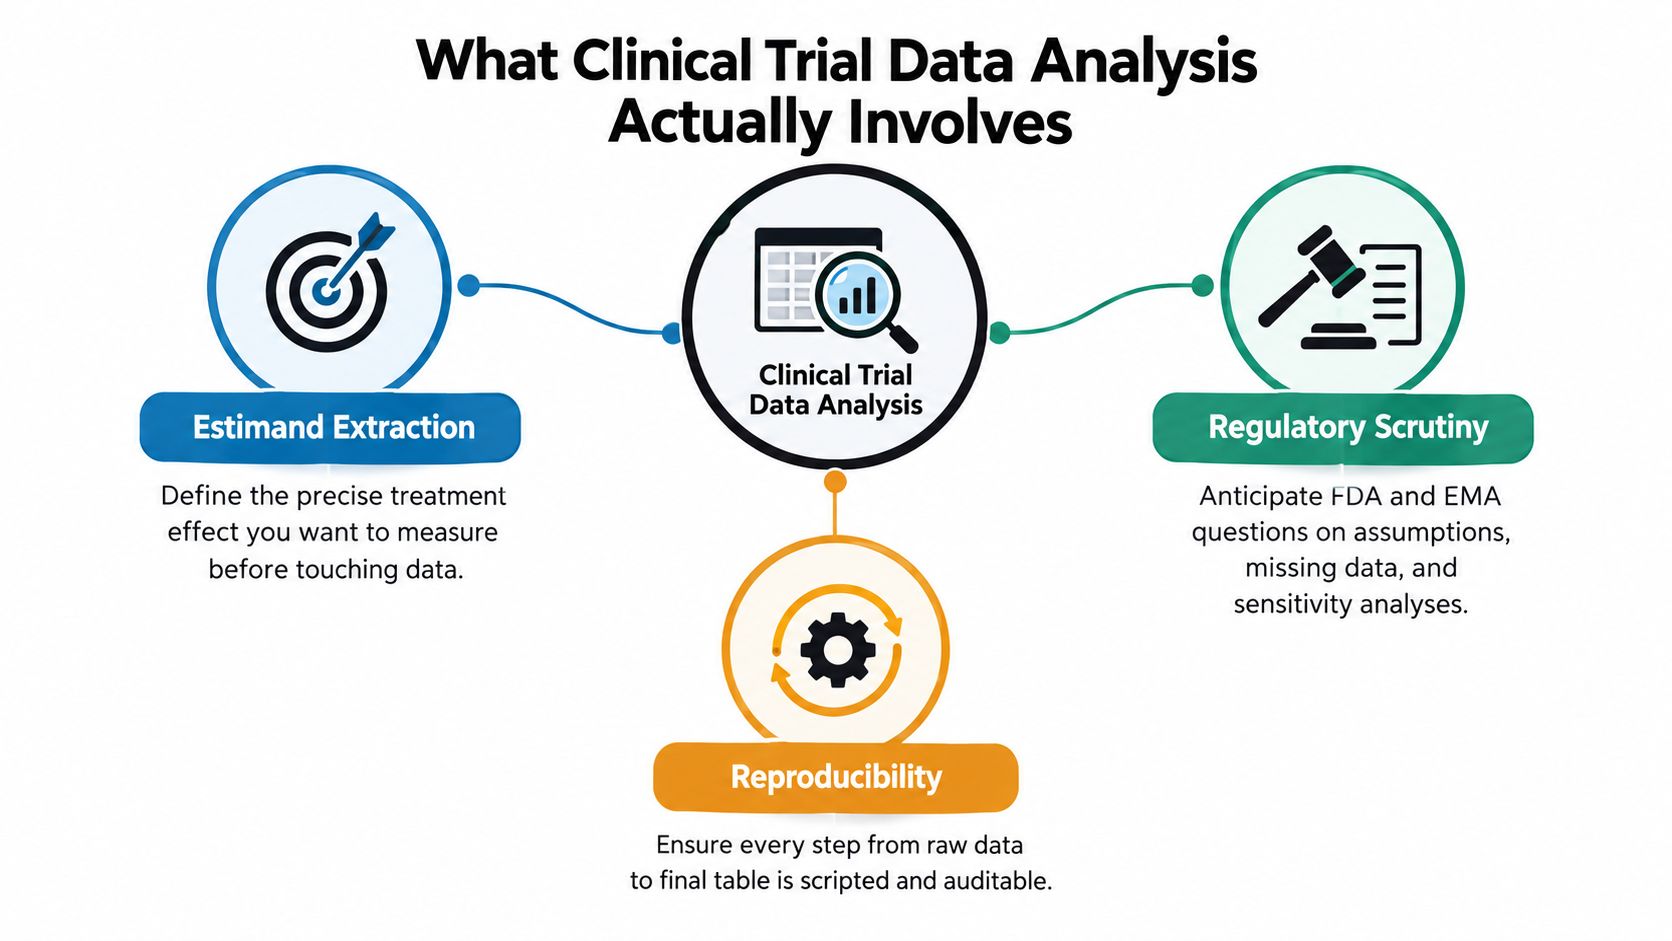
What Clinical Trial Data Analysis Involves
A trial analyst's day usually starts with a practical puzzle, not a statistical one. Which endpoint matters most, what should happen to participants who switched treatment, and which table will a reviewer open first if the results are challenged? The work is less about running a test and more about turning a protocol into an auditable answer.
The question comes before the code
ICH E9 makes the sequence clear. The sample size, primary objective, estimand, endpoint, analysis population, and statistical methods should be set before treatment comparisons are unblinded, and the sample must be large enough to answer the primary objective reliably ICH E9 guideline. That is why a defensible analysis starts with prespecification, not improvisation after the dataset is open.
Practical rule: if a decision would change the interpretation of the treatment effect, it belongs in the protocol or statistical analysis plan, not in a post hoc note.
A useful reference point is browse healthcare IT analyst positions. Job descriptions for healthcare data analysts increasingly list SAP and TLF production duties, which shows how much of the role is operational as well as statistical.
The common misunderstanding is to treat clinical trial analysis as generic data science with stricter formatting. The trial's credibility depends on what was fixed before unblinding, because that limits selective reporting and supports reproducibility across sponsors, regulators, and independent researchers.
If you are choosing software support for the workflow, a structured guide to clinical data analysis software is useful, especially when the output needs to remain reviewable from raw data to final table.
Estimands and Intercurrent Events as the Starting Point
A trial analysis gets clearer once the question comes first. Instead of asking which test to run, ask what treatment effect the study is meant to estimate. ICH E9(R1) frames that question through the estimand, which sets the population, endpoint variable, treatment condition, and the way intercurrent events are handled [ICH E9(R1)].
The estimand defines the question
The intercurrent-event strategy is the part many primers skim past. It tells analysts what to do when a participant stops treatment, takes rescue medication, switches arms, or dies before the endpoint is observed.
A treatment-policy strategy asks for the effect regardless of what happens after the event. A hypothetical strategy asks what the effect would have been if the event had not happened. A while-on-treatment strategy limits attention to outcomes up to the event. A composite strategy folds the event into the endpoint itself. These labels are not interchangeable, because each one answers a different clinical question.
A single dataset can support several legitimate claims, but those claims are not the same. If one participant stops therapy because of toxicity and another switches because of lack of response, the observed outcome may speak to tolerability under one estimand and efficacy under another.
An observed value after discontinuation can still be measurable, but it may no longer answer the same clinical question.
That is why the estimator has to follow the estimand. A mixed model, a survival model, or an inverse-probability-weighted estimator only makes sense after the question is fixed. The analyst's task is to keep the target effect and the method aligned, then check the key assumptions with sensitivity analyses, as set out in the same guideline.
Common Statistical Methods and When Each One Fits
The right model depends on the endpoint structure, not on habit. In chronic-disease trials with repeated post-baseline visits, mixed models for repeated measures are common because they use the longitudinal pattern instead of collapsing the follow-up into a single comparison. For time-to-event endpoints, Cox proportional hazards remains a standard choice when proportional hazards is plausible, while accelerated failure-time models can be better when the question is about speeding up or delaying the event rather than the hazard ratio itself.
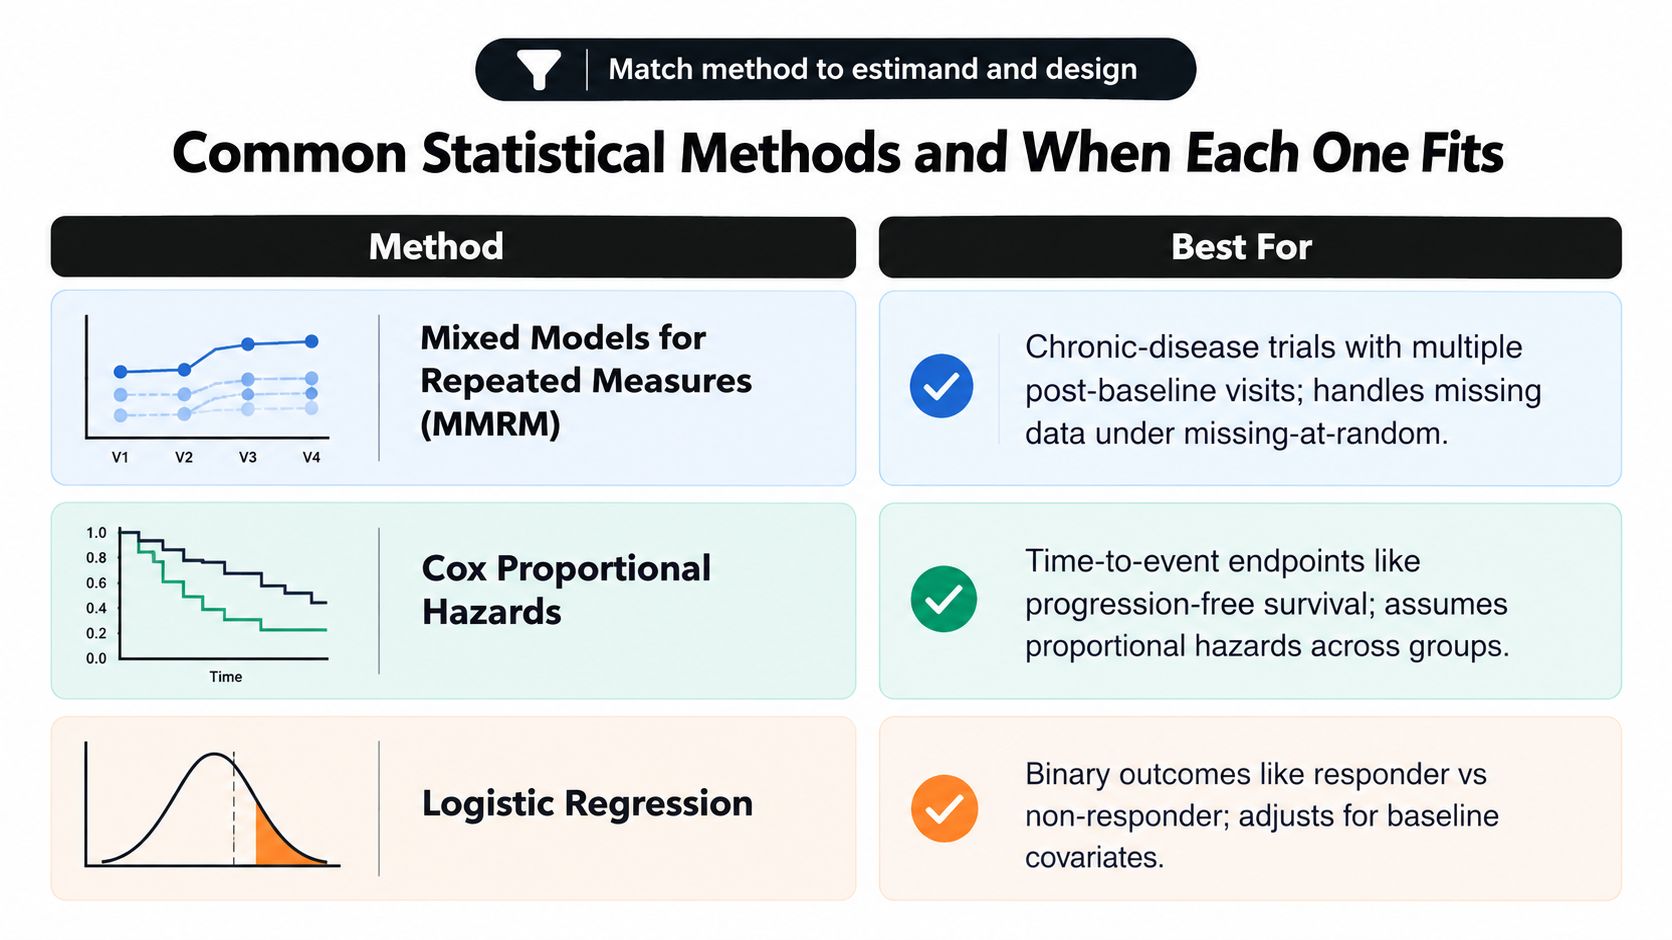
The key is to match the method to the data structure and the estimand. If participants are measured over time and their responses are correlated within person, generalized estimating equations can handle clustered longitudinal data. If the endpoint is binary, such as responder versus non-responder, logistic regression with baseline covariates is often the cleanest randomized comparison.
Assumptions deserve explicit checks
Every method carries assumptions, and a good analysis makes them visible. Proportional hazards should be assessed when using Cox models. Residual behavior matters for linear models. Conditional independence matters for clustered data. If those assumptions are hard to defend, the model may still fit numerically while failing inferentially.
That's where flexibility helps and where it can also confuse. A flexible baseline-hazard model may be appropriate if it improves fit without hiding the assumption check, but a black-box alternative can make it harder to explain why the result supports the estimand. Regulators usually want to see a clear rationale, not just a technically advanced fit.
A simple selection checklist helps keep the choice disciplined:
- Endpoint type: time-to-event, continuous, binary, or repeated measure.
- Correlation structure: independent, longitudinal, or clustered.
- Estimand alignment: does the method answer the prespecified question?
- Assumption visibility: can you explain what must be true for inference to hold?
- Sensitivity options: can you show what happens if assumptions are relaxed?
When the answer to any of those is unclear, the method is probably being chosen too early. If you want a practical companion for selecting tests, statistical test selection guidance is most useful when it forces the analyst to justify the model from the endpoint backward.
Multiplicity, Subgroups, and the Credibility of Secondary Claims
A trial can look persuasive on paper and still overstate what it found. That risk rises fast once analysts test several endpoints, time points, doses, or populations. The fix starts before the first p-value is calculated, with a testing strategy designed prospectively FDA multiple-endpoints guidance.
Hierarchies beat improvisation
Confirmatory claims need the overall Type I error rate controlled at 2.5% or below, with the analytical dimensions specified in the protocol or statistical analysis plan, as set out in the FDA guidance cited above. Hierarchical testing, gatekeeping procedures, graphical methods, and alpha allocation all serve the same purpose, which is to make the order of claims explicit instead of leaving it to post hoc choice.
Co-primary endpoints need special care because every endpoint must succeed. That guards against cherry-picking, but it can also raise Type II error if the design asks too much from one study. The right choice depends on whether the claims are joint by design or whether one endpoint is primary and the others are supportive.
Subgroup analysis creates a similar hazard. A prespecified interaction test asks a different question from a search for an interesting responder group after the fact. Flexible subgroup models can help when they are planned in advance, but they can also magnify unstable estimates and support “works here but not there” stories when subgroup size, multiplicity, and clinical plausibility are ignored.
Rule of thumb: if a subgroup result was not mapped to a prespecified hypothesis, treat it as exploratory, not confirmatory.
A credible report keeps the testing hierarchy visible and shows the allocated alpha, endpoint definition, analysis population, and decision rule for each claim, per the FDA guidance cited above. For a practical explanation of how correction choices affect interpretation, multiple testing correction guidance is most useful when it keeps the evidence hierarchy visible.
Missing Data and Intercurrent Events Handled Together
Missing data is not a cleanup problem. It's a clinical interpretation problem. The first question is whether the data are missing because the value was never collected, or because an intercurrent event changed the meaning of the outcome itself.
| Event | Treat as | Strategy | Method class |
|---|---|---|---|
| Missed visit | Missing data | Depends on mechanism | Mixed models, multiple imputation, or sensitivity analysis |
| Lost to follow-up | Missing data | Depends on mechanism | Pattern analysis, delta adjustment, tipping-point analysis |
| Rescue medication | Intercurrent event | Treatment-policy, hypothetical, or composite | Model aligned to the estimand |
| Treatment discontinuation | Intercurrent event | Treatment-policy, hypothetical, or while-on-treatment | Mixed model, inverse-probability weighting, or related approach |
| Death before endpoint | Intercurrent event | Often composite or hypothetical, depending on question | Survival model or composite analysis |
Mechanism matters, but assumptions must be tested
The hardest mistake is to treat missing at random as if it were a fact rather than an assumption. You can't observe it directly in the dataset, so the responsible move is to challenge it with pattern analyses, tipping-point analyses, and delta adjustments. That gives the reader a sense of how fragile the conclusion is when the assumption shifts.
Data collection has to support that work. Record the timing and reason for withdrawal, treatment changes, and rescue therapy so the analysis can separate intercurrent events from uncollected observations. Without that detail, the estimand-aligned analysis may be impossible to defend later.
A useful way to document this is with a sensitivity-analysis matrix. List the primary analysis, the missingness mechanism you are assuming, the alternative assumptions you can defend, and the direction in which each scenario pushes the conclusion. That turns missing data from a hidden weakness into a visible part of the evidence package.
For a concise reminder of how to think through the mechanics, handling missing data helps only if it stays tied to the clinical question and not just to the imputation method.
Reproducible Workflows From Dataset to Analysis Page
A reproducible analysis workflow starts before modeling and ends only when the logic is visible to another analyst. The practical sequence is straightforward, but each step has to be explicit: data quality screening, estimation, verification, and packaging.
From cleaning to verification
First comes data profiling. Analysts should inspect per-variable missingness, out-of-range values, outlier flags, and protocol-deviation logs so that the dataset is understood before any model is fitted. Then comes estimation, where the fitted model, residuals, and diagnostics are recorded alongside the result.
After that, verification matters as much as the primary output. Sensitivity analyses, alternative models, and validation tables show whether the conclusion survives plausible changes in assumptions. Finally, the work should be packaged in a reviewable format, whether that's a notebook, a PDF report, or an Analysis Page that keeps narrative, code, and figures together.
| Operating model | Methodology visibility | Reproducibility | Local execution | Plan approval | Exportability |
|---|---|---|---|---|---|
| Manual notebook | Variable | Moderate if disciplined | Yes, if set up locally | Informal | Often yes |
| Scripted pipeline | High | High | Yes | Strong if versioned | Yes |
| Agentic-analytics workspace | High when designed well | High when outputs are saved | Yes, in a local engine | Reviewable plan first | PDF and Jupyter exports |
The difference between a notebook and a multi-step investigation is that the latter can inspect intermediate results, revise the approach, and preserve the path from question to conclusion. That's where an AI tool for researchers can help if it behaves like an analyst and not just a chat interface.
If you're comparing workflow options, research reproducibility guidance is most useful when it treats the saved analysis as part of the scientific record. For a related operations lens, HPLC options from Celonyx Labs is a good reminder that structured review workflows matter in other regulated analysis settings too.
Common Pitfalls, Regulatory Anchors, and a Short Checklist
A trial analysis can look polished and still be weak if the workflow is wrong. The usual failures are familiar. Analysts choose a model before the estimand is clear, present subgroup results as if they were confirmatory, treat missing data as a cleanup task, and skip sensitivity analyses because the primary result already looks favorable. Each choice makes the final claim harder to defend.
The regulatory logic is simpler than many teams expect. Define the treatment question first, then choose the method that answers it, then check how the conclusion changes when assumptions change. That sequence is consistent with the intent of ICH E9 and ICH E9(R1), and FDA's multiplicity guidance reinforces the need to keep the testing hierarchy fixed rather than rebuilt after the fact. The same discipline of documented, staged release applies outside trials, see the Herbilabs Labware quality release overview for how batch release is controlled in regulated labs.
A short checklist keeps the analysis credible:
- Estimand first, method second. State the treatment effect before selecting the model.
- Multiplicity pre-specified. Document the testing hierarchy and alpha allocation before any look at results.
- Missingness and intercurrent events separated. Do not mix data that were not collected with events that changed the treatment path.
- Sensitivity analyses reported. Show whether the conclusion changes under reasonable alternative assumptions.
- Reproducible output saved. Keep code, figures, and narrative together in an auditable analysis record.
For teams that want an AI data analyst to support that workflow, clinical researchers can treat PlotStudio AI as a Julius AI alternative when they want multi-step investigation, local Python execution, methodology visibility, and a reproducible analysis page instead of a one-off answer.
Research teams can also review the academic option at plotstudio.ai/academic.