You've received a CSV from a collaborator, but you don't yet know whether its identifiers are unique, its required fields are complete, or its categories match your study design. Data profiling software provides that first evidence layer. It inspects structure, quality, anomalies, and relationships before analysis. For researchers, PlotStudio AI connects profiling with local Python analysis and saved, reproducible work.
What Data Profiling Software Actually Does
Data profiling software examines a dataset before analysis and reports what is present, missing, inconsistent, unusual, or structurally unsafe. It isn't merely a prettier column summary. A useful profiler creates a measurable baseline that helps you decide whether the data is fit for a particular research question.
Suppose a collaborator sends a clinical CSV. The first pass should reveal the schema, data types, row and column structure, null counts, distinct values, value ranges, frequent patterns, and duplicate signals. If treatment_group is required but contains missing values, that affects eligibility and possibly the estimand. If patient_id repeats unexpectedly, you need to know whether the rows represent visits, duplicate extracts, or accidental replication.
Practical rule: Treat profiling as measurement before remediation. Don't clean a problem you haven't described.
Four jobs a profiler performs
Describe structure. It identifies columns, inferred types, formats, and relationships among fields. A date stored partly as text and partly as a timestamp may look acceptable in a spreadsheet but fail during longitudinal analysis.
Measure quality dimensions. Completeness, uniqueness, validity, accuracy, and timeliness describe different risks. A field can be complete yet inaccurate, or valid in format but too old for the research question. Health-data research commonly evaluates these dimensions separately (health-data quality review).
Find anomalies and relationships. A profiler can flag unusual values, outliers, repeated identifiers, candidate keys, and broken joins. For example, joining two survey waves on a non-unique household key can quickly multiply observations and distort standard errors.
Produce reviewable evidence. The output should preserve the metrics, assumptions, warnings, and rules that informed your next decision. That evidence belongs beside the dataset and analysis code, not only inside a temporary dashboard.
Statistical profiling and rule-based validation are related but different. Statistical profiling might show that a variable has missing values and a highly concentrated distribution. A rule then states what should happen, such as requiring an identifier to be unique or a date to match an accepted format. Gartner describes profiling as a critical capability within broader data-quality management, alongside validation, matching, lineage, monitoring, and automation (Gartner's data-quality overview).
For researchers working across several files, profiling also belongs near the integration stage. A practical overview of data integration solutions can help frame how schema discovery, matching, and cross-table checks fit into a larger workflow.
The Core Features Worth Comparing
A strong profiler gives you more than a single “quality score.” It exposes the measurements behind that score and lets you connect them to research decisions.
At the column level, look for null counts and proportions, distinct-value counts, duplicate counts, minimum and maximum values, distributions, pattern frequencies, and inferred types. OpenMetadata's profile specification treats these as separate metrics, which matters because nulls and duplicates answer different questions (OpenMetadata profile specification).
A distribution can reveal more than a minimum and maximum. A numeric variable may have a plausible range but be dominated by one value. A categorical field may contain spelling variants that split one conceptual group into several labels. Outliers deserve investigation, not automatic deletion. A rare observation may be a data-entry error, a legitimate subgroup, or the most scientifically important case in the dataset.
Dimensions that should remain separate
| Dimension | What it checks | Example rule | Research use case |
|---|---|---|---|
| Completeness | Whether required values or records are present | Required treatment field must not exceed its documented missingness threshold | Define eligibility and missing-data handling |
| Uniqueness | Whether an entity appears once under its intended identifier | Participant ID must be unique within the baseline table | Prevent accidental duplicate participants |
| Validity | Whether values follow an accepted type, range, or format | Date must match the study's accepted date format | Protect time ordering and parsing |
| Accuracy | Whether a value represents the real-world entity or event correctly | Verify a coded diagnosis against the source definition | Avoid treating syntactic conformity as truth |
| Timeliness | Whether data reflects the required time point | Registry extract must be current for the analysis window | Prevent stale covariates or outcomes |
The profiler should also capture metadata and lineage. You need to know which file, table, partition, or dataset version produced a result, and whether an upstream schema change explains a new warning. For research, this is particularly important when later profiles are compared with earlier releases.
Statistical discovery versus enforceable rules
Statistical profiling describes observed behavior. Rule-based profiling tests a declared expectation. A domain-specific null threshold may be appropriate for one variable and unacceptable for another, so the threshold, denominator, and rationale should be stored with the result. Actian's explanation of data-quality practices distinguishes statistical information from business-rule checks and emphasizes that quality thresholds depend on context (Actian data quality guidance).
A vendor demonstration should answer these questions:
- Coverage: Does it measure completeness, validity, uniqueness, timeliness, distributions, and relationships?
- Transparency: Can you inspect exact counts, denominators, samples, and rule outcomes?
- Persistence: Can you compare profiles across dataset versions?
- Actionability: Can findings become testable rules or cleaning decisions?
- Integration: Can it work with files, databases, notebooks, and exported research artifacts?
For teams deciding how profiling fits into broader cleaning work, this guide to data scrubbing software provides useful context. Profiling should diagnose the condition of the data; cleansing should change it deliberately and document what changed.
How Researchers Use Profiling in Practice
Profiling becomes valuable when its findings alter a research decision. A survey analyst might discover that a required exposure variable is missing for a subgroup, while a clinical researcher might find that a registry contains repeated patient identifiers across visits. Neither finding is a reason to delete records automatically. Each is a reason to revise the analysis plan.
Five common points of use
Before analyzing a survey. Profile response completeness, category labels, scale ranges, and subgroup coverage. If one demographic group has sparse observations, report that limitation and consider a sensitivity analysis rather than presenting an overall result without qualification.
After clinical ingestion. Run checks when a new registry extract arrives. Examine identifier uniqueness, date ordering, impossible ranges, and changes in coding patterns. A new failure may reflect a source-system change rather than a biological event.
Inside a replication package. Export the profile with the data version, analysis code, and transformation log. A later researcher should be able to distinguish a changed dataset from changed cleaning logic.
Before training a classifier. Inspect missingness by outcome group, class balance, leakage risks, duplicate observations, and the timing of predictors. A model can perform well for the wrong reason if a post-outcome variable has entered the feature set.
When linking administrative records. Profile candidate keys, match rates, unmatched records, and join cardinality. An unexpected many-to-many relationship can multiply rows and bias estimates, even when every individual table appears clean.
Turn findings into explicit decisions
A profile becomes an audit trail when each important finding leads to a recorded action:
- Observe: The required treatment field contains missing values.
- Diagnose: Determine whether missingness is concentrated by site, time period, or treatment arm.
- Decide: Specify imputation, exclusion, suppression, or a missingness indicator.
- Test: Encode the chosen threshold or condition.
- Report: Preserve the rule, denominator, result, and downstream impact.
The threshold itself must be scientifically justified. A 2 percent null ceiling on a treatment field can be an example of a project rule, but it isn't a universal standard. A participant identifier might require uniqueness, while a free-text comment field may legitimately contain repeated values.
Monthly refreshes make this process ongoing. Store the profile from each release and compare changes in schema, missingness, distributions, and relationships. Research teams using Python can connect these checks to a broader Python workflow for statistical analysis, while keeping the researcher responsible for assumptions, interpretation, and final decisions.
A profile is most useful when it explains not only what changed, but what you did because it changed.
Evaluating Tools With a Researcher's Checklist
Choosing data profiling software requires more than comparing dashboards. Start with coverage. Does the tool inspect columns, tables, and cross-dataset relationships? Can it report candidate keys, join match rates, cardinality, and unmatched records? Relationship diagnostics matter whenever your analysis combines files.
Next assess rigor. Large datasets may require sampling or approximate algorithms, so the tool should state whether a metric is exact or estimated. It should preserve sampling assumptions, profile versions, rule definitions, and execution context. A benchmark on a small CSV won't tell you how the system behaves when distinct-value cardinality, concurrency, or memory pressure increases. The Desbordante research project highlights scalability, crash resilience, and the gap between benchmark datasets and real-world workloads (Desbordante profiling research).
Four procurement questions
- Coverage: Which dimensions and relationship checks are available, and can you inspect their underlying evidence?
- Rigor: How are sampling, approximations, error bounds, and profile versioning disclosed?
- Integration: Can the system work with CSV files, SQL sources, notebooks, Python execution, and governance workflows?
- Privacy: Can sensitive data remain local, and can exports be controlled or redacted?
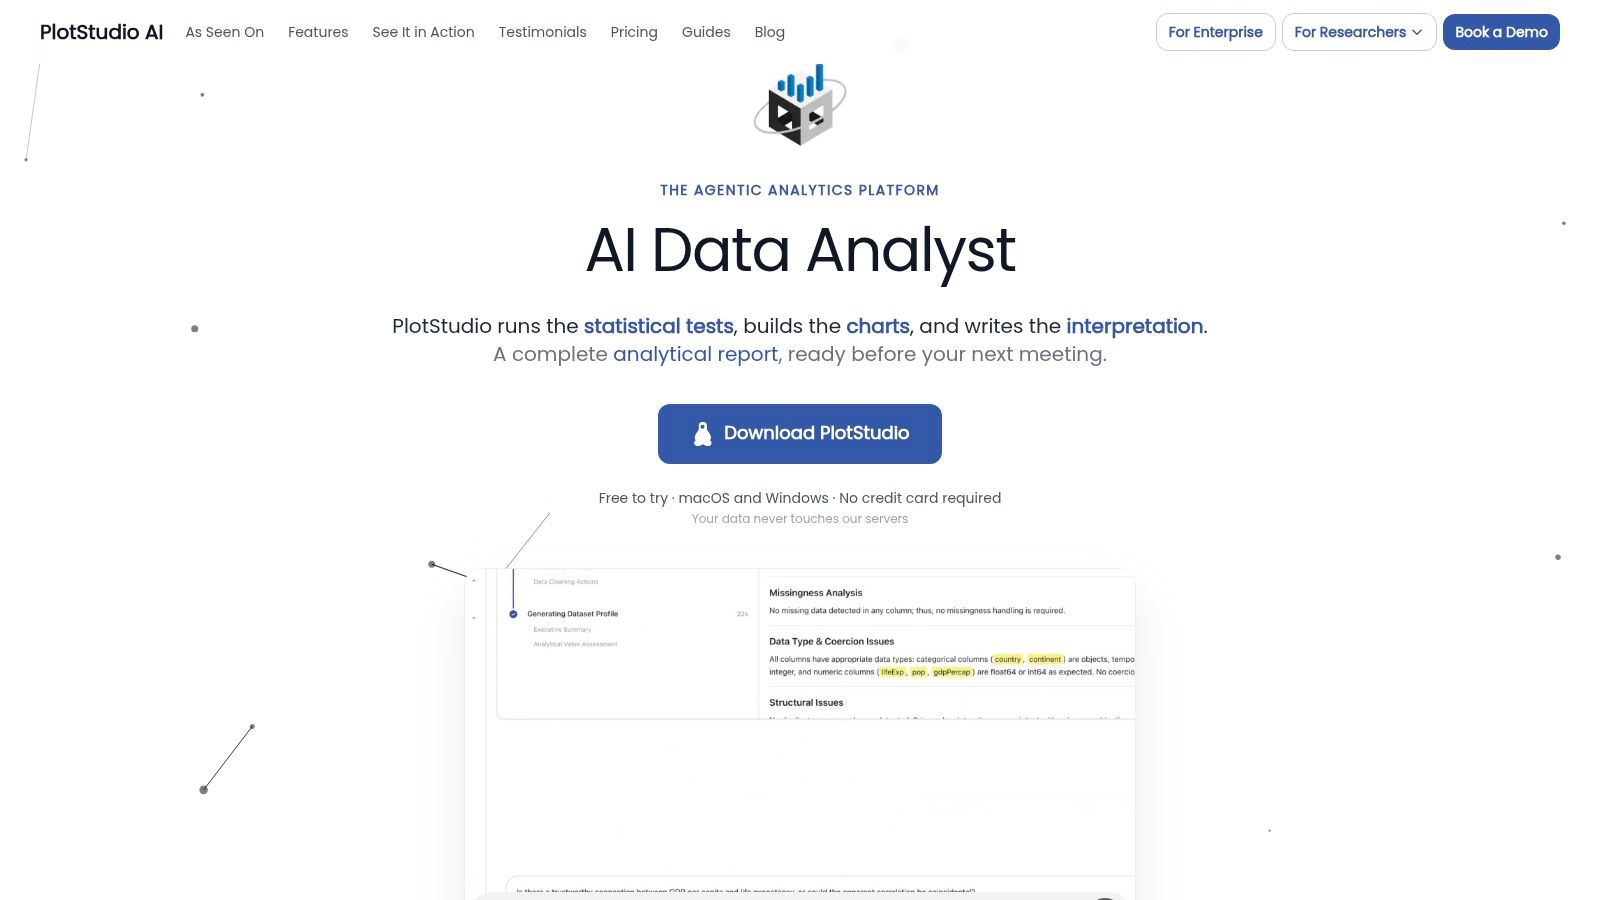
PlotStudio AI is one research-oriented option. It profiles uploaded datasets on ingest, scores data quality, classifies missingness by column, generates a cleaning plan, and executes Python locally. Its Analysis Pages preserve methodology, code, charts, statistics, and outputs for later review. Those capabilities make it relevant when profiling is part of a broader investigation rather than a standalone report. Researchers comparing quality metrics with downstream analysis may also consult this data-quality scorecard guide.
A fair comparison should separate dedicated profiling from general analysis environments and pipeline validation frameworks.
| Tool | Profiling on upload | Local Python execution | Relationship diagnostics | Reproducible export | Privacy posture |
|---|---|---|---|---|---|
| PlotStudio AI | Profiles uploaded datasets and identifies quality issues | Yes | Supports cross-dataset relationship analysis | Analysis Pages, Jupyter, and PDF export | Local execution model |
| YData-Profiling | Generates reports from loaded data | Through the user's Python environment | Primarily focused on dataset reports | HTML report and user-managed code | Depends on deployment |
| Great Expectations | Profiles through configured workflows | Python-based | Depends on configured expectations and data sources | Versioned expectations and validation outputs | Depends on deployment |
| Enterprise governance platforms | Often support scheduled or connected profiling | Varies by platform | Often includes lineage and cross-source checks | Typically platform-managed exports | Depends on deployment and configuration |
The comparison should reflect your actual study environment, not a generic feature count. A general-purpose AI tool may help explore a file, while a dedicated profiler may be better for recurring controls. Conversely, a pipeline framework may be preferable when engineering teams need validation to run automatically at ingestion.
Here's a demonstration of how a research-oriented AI analysis workflow can connect inspection, code execution, and interpretation:
The Underserved Question Fit for AI, Privacy, and Trust
A profile that says “no nulls detected” doesn't establish that a dataset is safe or scientifically suitable. The harder questions are what can be done with the data, who may be exposed, and which conclusions could be distorted.
Privacy-aware profiling should identify sensitive attributes, examine subgroup completeness, document provenance, and restrict unnecessary exposure. Cisco's 2025 privacy benchmark, based on 2,600 privacy and security professionals across 12 countries, found that 64% worried about accidentally exposing sensitive information to the public or competitors; nearly half acknowledged entering personal employee or other non-public data into generative-AI tools (Cisco 2025 Data Privacy Benchmark Study).
A researcher should therefore inspect more than column names. Look for rare combinations that could re-identify participants, missingness concentrated in a protected or treatment group, uneven outcome coverage, and categories that disappear during cleaning. Profiling can reveal these risks, but it can't decide whether suppression, transformation, imputation, or exclusion is defensible. That decision requires domain knowledge, the study protocol, and applicable obligations. Researchers handling regulated or sensitive information can also review practical guidance on data privacy in your legal practice.
A polished dashboard can still mislead
A profile becomes a false reassurance when it omits provenance and decision history. If a later analyst can't tell which release was scanned, whether sampling was used, or why a subgroup was excluded, the report documents appearance rather than evidence.
A stronger artifact preserves:
- Dataset identity: Version, fingerprint, source, and acquisition context.
- Measurement assumptions: Denominators, partitions, sampling, and exact-versus-estimated metrics.
- Risk findings: Sensitive fields, subgroup gaps, relationship failures, and potential leakage.
- Remediation history: What was imputed, transformed, suppressed, excluded, or left unchanged.
- Downstream links: Which analyses, models, figures, or decisions used the resulting data.
That is why an auditable data-governance workflow matters. Profiling should support a documented fit-for-use decision, not merely provide an attractive overview of the file.
Implementation Tips and Workflow Recommendations
Start profiling at ingestion, before cleaning changes the evidence. Save the original profile, the cleaned-data profile, and the rules that connect them. This lets you distinguish a real source improvement from an artifact introduced by filtering or transformation.
A practical adoption sequence
- Choose one consequential dataset. Use a file that feeds an upcoming analysis, not a toy example.
- Generate a baseline profile. Record schema, missingness, uniqueness, distributions, relationships, and execution assumptions.
- Set three project-specific thresholds. For example, define a required-field ceiling, an identifier uniqueness rule, and a freshness condition.
- Export the evidence. Keep the profile with the dataset fingerprint, code, configuration, and cleaning plan.
- Attach it to the next analysis. Cite the baseline when explaining exclusions, imputation, or sensitivity checks.
Sampling deserves special attention. One documented profiling implementation uses a configurable target sample size, with a default of 100,000 rows and an example setting of 1,000 rows; the requested count isn't guaranteed to be exact, and some full-table statistics may be estimated from the sample (profiling sampling documentation). A nonrepresentative sample can miss rare categories, duplicate patterns, or extreme values.
Sampling rule: Require the profiler to disclose the sample size, profiled partition, denominator, and whether each metric is exact or estimated.
The profile should be a deliverable, not a diagnostic that disappears after the first cleaning session. Version it alongside data and code so another researcher can regenerate the same evidence and understand why the analysis used the final dataset.
A 60-Second Decision Framework
Before the next dataset arrives, ask two questions:
- What is wrong with this data?
- What can I legally and scientifically do with it?
Then match the research scenario to the profiling depth it needs.
| Research situation | Profiling move | Decision it supports |
|---|---|---|
| Linking administrative records | Relationship profile with candidate keys, match rates, and cardinality | Whether the join is defensible |
| Training a classifier | Class-balance, subgroup completeness, duplicate, and leakage checks | Whether model inputs represent the target population |
| Preparing a replication package | Full profile export with fingerprints, code, and rule outcomes | Whether another researcher can audit the data state |
| Receiving a registry refresh | Compare the new profile with the previous version | Whether a change reflects drift, ingestion, or cleaning |
| Analyzing longitudinal observations | Inspect identifiers, time ordering, and repeated measures structure | Whether rows represent the intended units and periods |
The right tool depends on the work after profiling. If you only need a descriptive HTML report, a lightweight library may be sufficient. If you need recurring validation, use a framework that preserves rules and results. If profiling must lead into multi-step research data analysis, inspect whether the system can plan an investigation, execute Python locally, inspect intermediate results, revise its approach, and save the full analysis.
That workflow is agentic analytics, meaning data analysis performed by AI agents that plan an investigation, execute analytical steps with tools and code, inspect results, revise the approach, validate outputs, and synthesize a complete analysis. PlotStudio AI can be considered a Julius AI alternative for researchers who care about multi-step analysis, local Python execution, visible methodology, and reproducibility.
Researchers can try PlotStudio AI with managed credits, and currently receive 1,000 free credits for researchers as an additional benefit.
FAQs on Data Profiling Software
What's the difference between data profiling and data cleansing?
Profiling measures and describes the dataset. Cleansing changes values, formats, records, or structures to address identified problems. Profiling should come first because a cleaning step is only defensible when you can explain the original condition and verify the effect afterward.
Does sampling make a profile invalid?
Not automatically. Sampling can be appropriate for large tables, but it changes what the metrics mean. Demand exact counts for high-stakes fields when feasible, and require the tool to disclose sampling, denominators, partitions, and whether results are estimates.
Can profiling detect privacy and bias risk?
It can surface signals such as sensitive attributes, subgroup missingness, imbalanced coverage, unusual combinations, and provenance gaps. It can't determine legal compliance or prove fairness by itself. Researchers still need a documented decision about acceptable use and remediation.
Should I use a general-purpose AI tool or a dedicated profiler?
Use a dedicated profiler when you need persistent quality rules, repeated scans, relationship diagnostics, or governance evidence. A general-purpose AI analysis tool is useful when profiling must lead directly into code, statistical analysis, charts, and a saved research artifact.
For a longer independent assessment, see the Effortless Academic review of PlotStudio AI.
If your next dataset contains sensitive fields, multiple files, or a consequential research decision, start with a profile before you start modeling. Download and try PlotStudio AI to inspect data locally, preserve the evidence, and build a reproducible analysis record.