Python for statistical analysis is not easy, and treating it as a drop-in replacement for R or SPSS can create methodological problems. The practical approach is to separate data preparation, exploratory testing, model estimation, diagnostics, and reporting. Agentic analytics platforms such as PlotStudio AI can automate parts of that workflow, but researchers still need to review assumptions, missingness, and scientific interpretation.
Python works well for research when it's treated as an analytical ecosystem rather than a single statistics package. The hard part isn't writing a t-test. It's choosing a defensible test, preserving the reasoning behind the choice, and producing an analysis that another researcher can inspect and rerun.
The Hidden Traps in Python Statistical Workflows
The most popular advice about Python for statistical analysis often begins with a reassuring promise: load a DataFrame, call a function, read the p-value, and write up the result. That workflow is convenient, but it teaches syntax before judgment. Researchers working with clinical measurements, longitudinal observations, surveys, or genotype trials quickly encounter non-normality, unequal variance, dependent observations, missing values, and influential outliers.
Python doesn't protect you from those problems. A library function will usually execute exactly as requested, even when the assumptions behind the test are weak. A classic independent-samples t-test may be inappropriate when group variances differ, while a simple regression can become misleading when residuals show structure or observations aren't independent.
Practical rule: A successful function call proves that code ran. It doesn't prove that the analysis was valid.
The danger is greatest when tutorials present hypothesis testing as a mechanical pipeline. A researcher may define a null hypothesis, calculate a p-value, compare it with a significance level, and stop there. The conventional cutoff of 0.05 is commonly used in applied Python statistics guidance, but a threshold doesn't replace effect sizes, confidence intervals, diagnostics, or subject-matter reasoning. The decision rule is described in Python's hypothesis-testing guidance, but researchers still need to decide whether the selected test answers the scientific question.
Why default tests fail on real data
The classic t-test and ANOVA workflow assumes more than many introductory examples acknowledge. Unequal group variance can distort inference. Small samples can make distributional checks inconclusive. Repeated measurements violate independence if they're analyzed as separate observations. Missing values can change the population represented by the analysis.
That's why method selection should begin with the data-generating process, not with the shortest available code. Exploratory analysis can identify unusual values and distributional patterns, while confirmatory analysis should preserve a pre-specified rationale for the model, exclusions, and contrasts.
Researchers also need to distinguish model criticism from model rejection. A non-normal variable doesn't automatically invalidate every parametric method, and a significant normality test doesn't automatically mandate a nonparametric alternative. The relevant question is whether the assumption materially affects the estimate or inference, given the design and scientific objective.
A useful way to formalize that discipline is through cross-validation for research analysis, particularly when the task involves prediction or model comparison. Validation can expose overfitting, but it can't repair confounding, poor measurement, or a badly defined outcome. Python is flexible enough to support rigorous workflows, but that flexibility shifts responsibility to the analyst.
Evolution of the Python Data Science Ecosystem
Python wasn't launched as a complete statistical-analysis environment. It was first released in 1991, and its modern scientific stack emerged gradually through libraries that solved different technical problems. Nature Methods' account of the scientific Python ecosystem identifies SciPy's emergence in 2001 and NumPy 1.0's release in October 2006 as important milestones in that development.
NumPy supplied the array-oriented numerical foundation that scientific computing needed. SciPy added specialized scientific routines, including probability distributions and statistical procedures. This explains why Python's statistical capabilities can feel fragmented compared with software built around a single integrated modeling environment. The fragmentation is architectural, not accidental. Each package owns a different layer of the workflow.
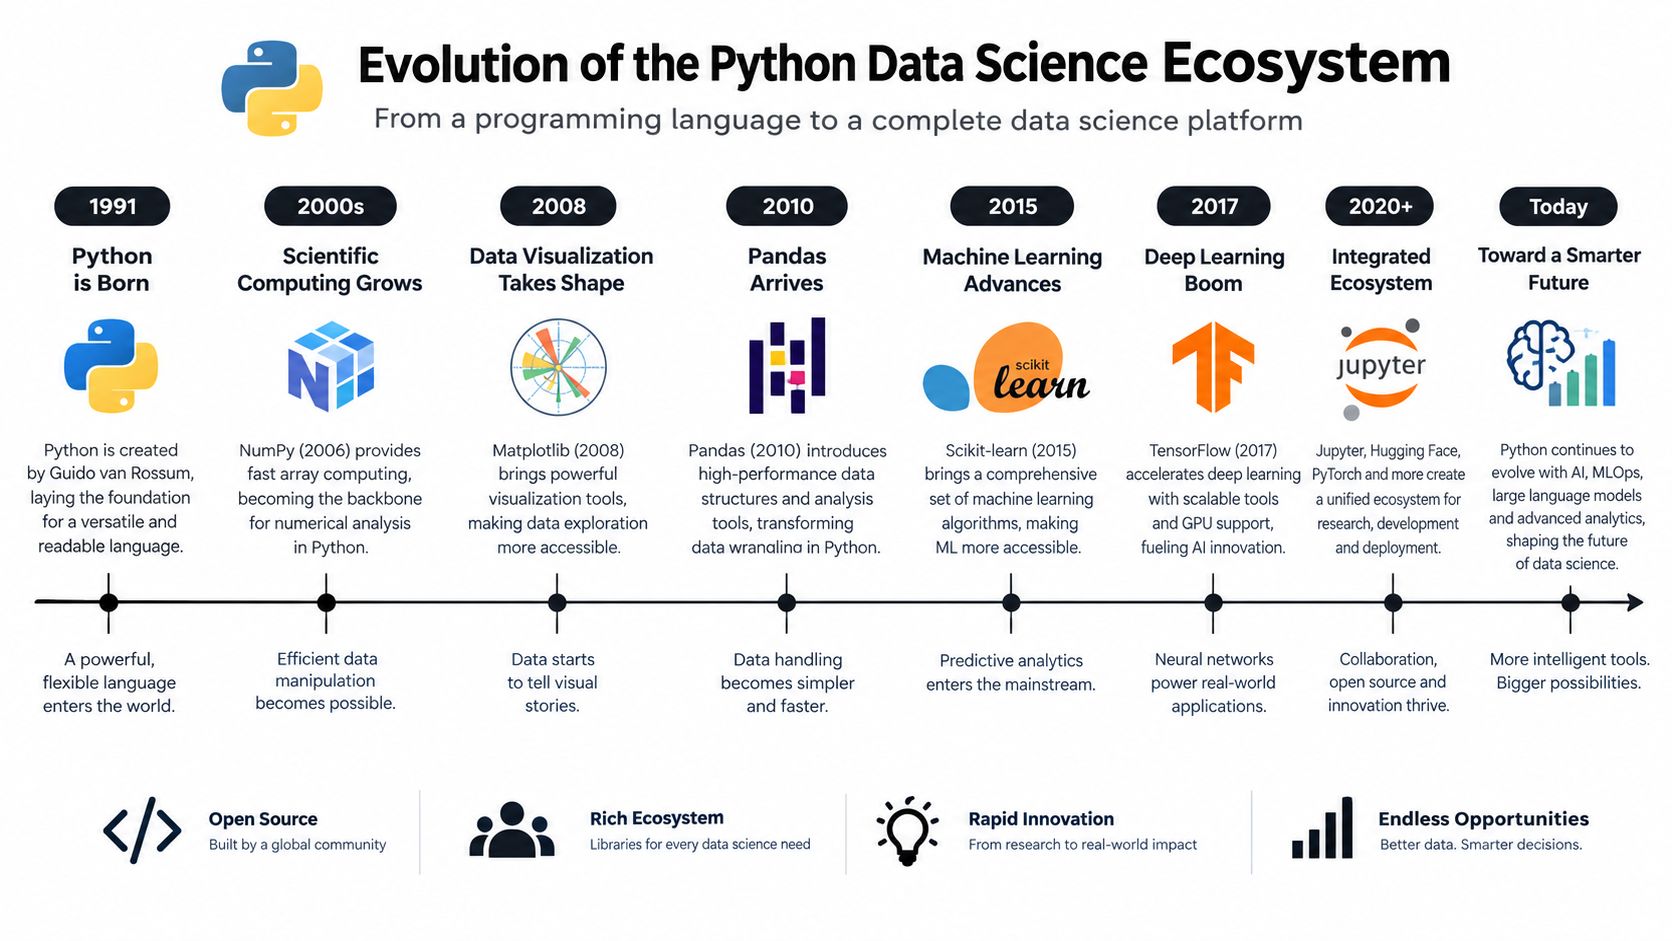
SciPy became a de facto standard in scientific Python, with more than 600 unique code contributors, thousands of dependent packages, over 100,000 dependent repositories, and millions of downloads per year, according to the Nature Methods source. NumPy 2.0.0 was highlighted as the first major NumPy release since 2006 in June 2024. Those milestones matter because they show that Python's credibility in research came from sustained ecosystem development and downstream adoption, not from statistical functionality built into the language itself.
pandas made tabular analysis practical
The next bottleneck was data handling. Analysts needed a reliable way to represent labelled columns, missing values, grouped data, joins, and summaries without rebuilding those operations for every project. pandas filled that role. pandas 0.2 was released on May 18, 2010, followed by pandas 0.3.0 on February 20, 2011, as documented in the pandas package history.
That timing helps explain pandas' importance. NumPy arrays are powerful numerical structures, but research datasets usually arrive as tables with column names, mixed types, identifiers, and incomplete records. pandas became the bridge between raw files and statistical modeling. Its DataFrames let researchers clean and reshape data before handing it to SciPy, statsmodels, visualization libraries, or specialized packages.
The ecosystem continues to evolve. pandas 2.2.2 added compatibility with NumPy 2.0 in April 2024, while pandas 3.0.6 remained compatible with Python 3.15 in September 2026, according to the package timeline. Researchers should therefore pin environments and document versions rather than assume that an analysis will behave identically after every upgrade.
The practical mental model is straightforward:
- NumPy handles numerical arrays and core computation.
- pandas handles labelled tabular data and transformations.
- SciPy handles distributions, summary statistics, correlations, and hypothesis tests.
- statsmodels handles interpretable statistical models and inference.
- Visualization libraries help researchers inspect distributions, relationships, residuals, and uncertainty.
Understanding those boundaries makes library selection less confusing. It also makes reproducibility more realistic, because the analysis record can show which package performed each transformation or estimation step.
Choosing Between SciPy and Statsmodels
SciPy and statsmodels overlap just enough to confuse new Python researchers. Both can support statistical analysis, but they serve different phases of the research workflow. The decision shouldn't be based on which library has the shorter example. It should depend on whether you're exploring a statistical property or estimating and interpreting a model.
The SciPy statistics reference describes scipy.stats as covering probability distributions, summary and frequency statistics, correlation functions, and hypothesis tests. That makes it a strong starting point for focused procedures such as a one-sample test, a correlation calculation, or a distributional calculation.
Use SciPy for focused statistical procedures
SciPy is usually the faster choice when the question is narrow:
- Does a sample mean differ from a specified value?
- Are two variables correlated?
- Which distribution describes a measurement?
- Does a group comparison require a standard hypothesis test?
- What are the relevant summary or frequency statistics?
For example, scipy.stats.ttest_1samp() tests whether a sample mean differs from a specified population mean and returns a t statistic and a p-value. The distinction between a z-test and a t-test matters here. Scientific Python's statistics material notes that ztest() is appropriate when the population standard deviation is known, while ttest_1samp() is used when that standard deviation is unknown.
That function-level distinction is easy to miss because both tests can look interchangeable in a short script. They aren't interchangeable if the population standard deviation is treated differently. The test should reflect what is known about the population and the sampling process.
Use statsmodels for estimable, inspectable models
Move to statsmodels when the analysis needs coefficients, standard errors, residual diagnostics, formula syntax, or a structured results object. The statsmodels documentation positions the package for regression, linear models, time series, and inferential extensions beyond scipy.stats.
Its workflow is deliberately explicit:
- Define the model class. Choose a model that matches the outcome, predictors, dependence structure, and research design.
- Fit the model. Estimate parameters using the selected data and specification.
- Inspect the results. Review the summary, parameter estimates, standard errors, diagnostics, and relevant tests.
The statsmodels getting-started guide also shows how pandas DataFrames and CSV input fit into that workflow. A DataFrame provides labelled, potentially heterogeneous data, while read_csv converts a CSV file into that structured representation.
A practical decision rule
Use SciPy when you need a contained calculation or exploratory test. Use statsmodels when you need an inferential model that another researcher can interpret and audit. For a treatment comparison with a clearly defined design, SciPy may be sufficient for an initial test. For an adjusted outcome model involving covariates, interactions, repeated observations, or diagnostic reporting, statsmodels is usually the more appropriate layer.
Neither library chooses the research question for you. A model can be technically well fitted and still answer the wrong question. Researchers should document why the outcome, predictors, contrasts, covariance assumptions, and missing-data strategy were selected.
Manual Notebooks Versus Agentic Analytics Platforms
A Jupyter notebook can expose every command and support fast exploratory work. It can also conceal the decisions that produced the final result. Cells run out of order, intermediate objects get overwritten, and a chart may depend on a transformation located far from the code that generated it. The notebook records keystrokes more reliably than it records reasoning.
Agentic analytics uses AI agents to plan an investigation, execute analytical steps with real tools and code, inspect intermediate results, revise the approach, validate outputs, and assemble the findings. The distinction matters in statistical work. A result is an output. An analysis is a traceable investigation with a defined question, visible methods, intermediate checks, and preserved artifacts.
Manual notebooks give researchers direct control over each operation. They also make the researcher responsible for orchestration, sequencing, error handling, documentation, and export. An agentic workflow can handle mechanical tasks such as profiling columns, checking missingness, proposing an analysis sequence, running Python, inspecting outputs, and saving the resulting artifacts. Methodological judgment remains with the researcher.
| Feature | Manual Jupyter Workflow | Agentic Analytics (PlotStudio AI) |
|---|---|---|
| Multi-step investigation | The researcher designs and runs each step | Agents can plan and execute a sequence of analytical steps |
| Python execution | The researcher writes and runs notebook code | Python is generated and executed locally, with outputs inspected during the workflow |
| Methodology visibility | Visible when the researcher documents it carefully | Plans, code, methods, charts, and statistics can be saved with the analysis |
| Error correction | Depends on manual debugging and review | The workflow can inspect failures and adjust its approach |
| Reproducibility | Requires disciplined versioning, ordered cells, and exports | Analysis Pages can preserve narrative, code, outputs, and charts |
| Human control | Direct control over every command | Researchers can review plans and retain judgment over methods |
| Persistence | Knowledge can remain scattered across notebooks | Saved analyses can be revisited and synthesized across a workspace |
The right choice follows the investigation. A plain chatbot can explain syntax, while a researcher evaluating a Julius AI alternative may need multi-step execution, local Python runs, visible methodology, and durable outputs. Conversational convenience does not replace an audit trail.
Where delegation helps
Delegation works well for repetitive tasks whose outputs can be inspected. An agent can profile column types, identify missing values, suggest visualizations, draft a cleaning plan, and run diagnostic calculations in sequence. Each step still needs review. An identifier treated as a numeric predictor can distort the model, and missingness related to the outcome can make an apparently orderly workflow misleading.
Researchers should retain control over inclusion criteria, causal assumptions, outcome definitions, clinically meaningful contrasts, and uncertainty interpretation. Plan Mode and editable analytical plans support that division of responsibility by putting methodological review before execution, while changes are still easy to examine.
The practical standard is auditability. A saved chart is weak evidence if its filtering, transformations, and model settings cannot be reconstructed. A saved analysis that preserves the plan, code, outputs, and narrative gives collaborators a clearer basis for review and later reuse.
Human judgment remains the control layer. Automation should reduce boilerplate and expose the work clearly, while responsibility for study design and interpretation stays with the researcher.
Data Quality and Robust Hypothesis Testing
A statistical test can't rescue a poorly understood dataset. Before selecting a test, inspect the unit of observation, duplicate records, variable types, measurement ranges, missingness patterns, and relationship between rows. A patient-level table, a visit-level table, and a treatment-level table require different interpretations even when they contain similarly named columns.
Missingness deserves explicit classification. MCAR means missingness is unrelated to observed and unobserved values. MAR means missingness can be explained by observed information. MNAR means missingness may depend on unobserved values or the missing value itself. Those are assumptions about the data-generating process, not labels that a library can determine automatically.
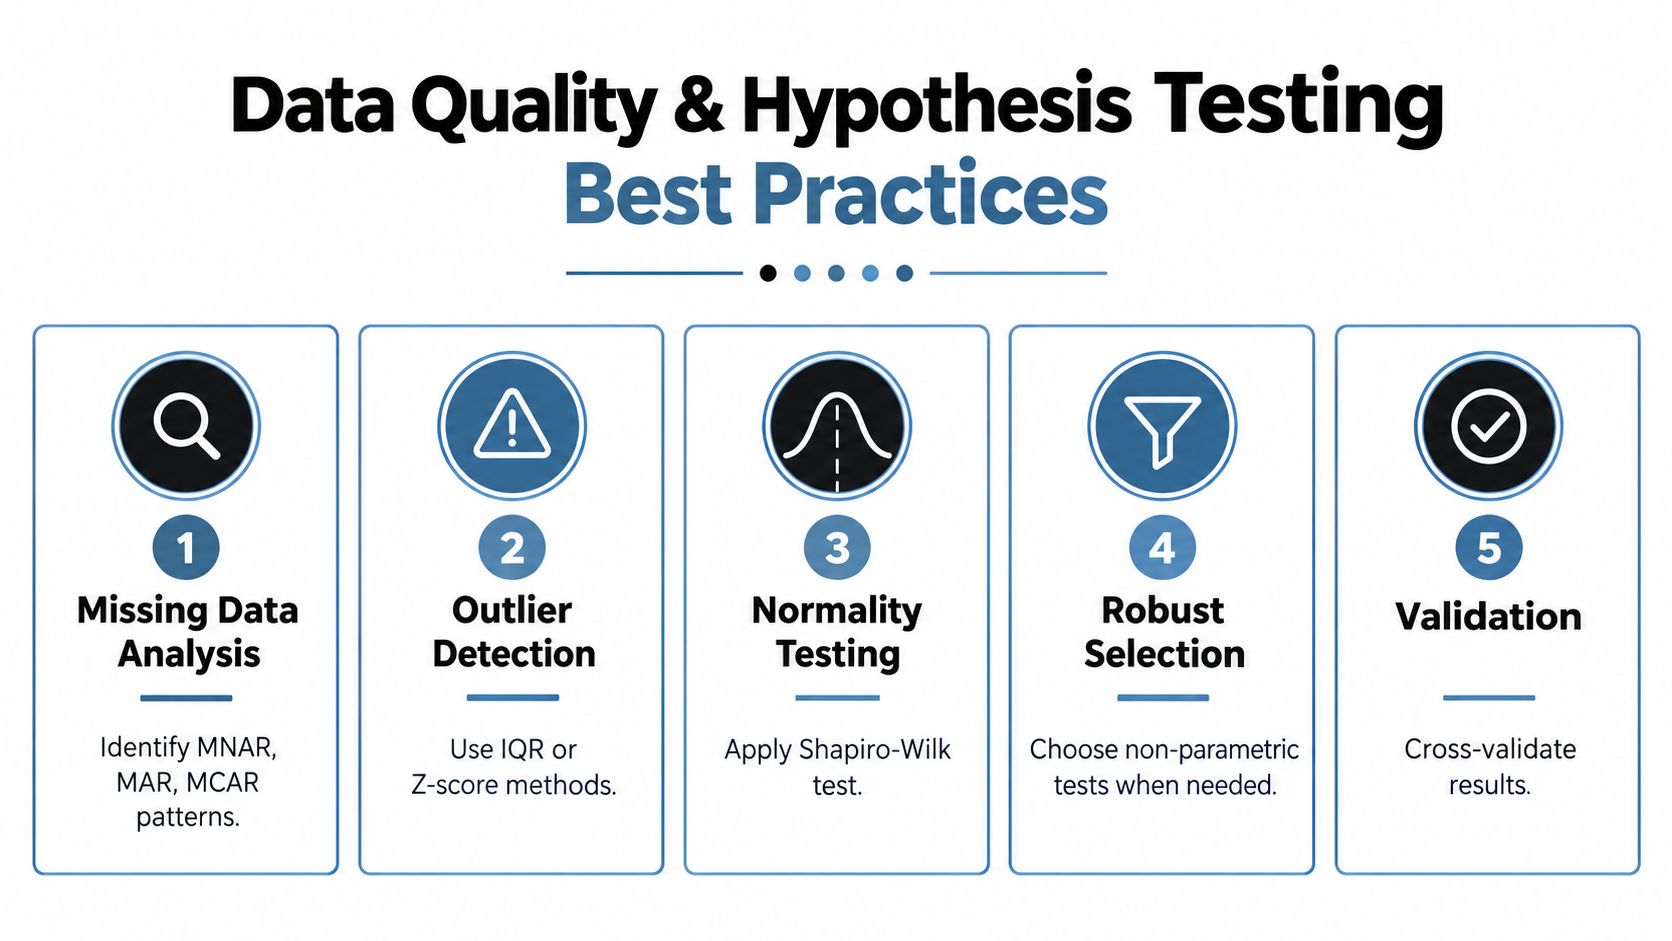
A defensible pre-modeling routine should include:
- Missing Data Analysis: Identify whether missingness appears compatible with MCAR, MAR, or MNAR assumptions, and document exclusions or imputation decisions.
- Outlier Detection: Investigate unusual observations using domain knowledge alongside methods such as IQR or z-score screening. An outlier may be a data error, a valid extreme case, or evidence that the model is incomplete.
- Normality Assessment: Examine plots and diagnostics rather than relying on a single automated test. The relevant issue is how distributional behavior affects the intended estimate.
- Selection Methods: Consider Welch's t-test when group variances may differ, bootstrapped confidence intervals when analytic assumptions are fragile, and nonparametric alternatives when the design and estimand support them.
- Validation: Compare conclusions across plausible specifications and report sensitivity analyses rather than presenting one convenient result as uniquely correct.
Better defaults than the textbook pipeline
Many beginner tutorials show the classic t-test or ANOVA pipeline as if equal variance and well-behaved residuals were automatic. Recent instructional coverage identifies Welch's t-test as a safer default in situations with unequal variances, while also highlighting the gap between basic tutorials and decisions involving non-normal, heteroskedastic, or small-sample data. That discussion appears in practical guidance on statistics for Python.
A careful workflow asks what quantity should be estimated. A mean difference, median difference, rank-based contrast, and model-adjusted effect aren't interchangeable. Report the effect size and confidence interval where appropriate, not only whether a p-value crosses a threshold. If several outcomes or subgroup comparisons are tested, account for multiple testing in the analysis plan and interpretation.
The statistical test selection guide can support the decision process, but no automated recommendation replaces knowledge of the study design. The strongest Python workflows make assumptions visible before the model runs.
Advanced Modeling for Time Series and Survival Data
Time series and survival data expose weaknesses in ordinary regression because the observations carry structure that a simple independent-outcome model may ignore. Time series observations can exhibit autocorrelation, changing variance, trend, or seasonality. Survival data include censoring and often require attention to the timing of events rather than only whether an event occurred.
Start with the data structure. For time series, preserve the time index, check ordering, inspect gaps, and separate training and evaluation periods chronologically. Randomly shuffling observations can leak future information into the model. For financial or operational measurements with changing volatility, ARCH or GARCH models may be relevant, but fitting the model is only the beginning. Inspect residual behavior and evaluate whether the volatility specification captures the structure that motivated it.
Researchers working with large or distributed temporal datasets may also benefit from understanding data-engineering patterns, such as this practical overview of time series data with Snowflake. Storage and computation choices don't determine the statistical method, but they can affect how reliably the analytical dataset is assembled.
Survival analysis needs design-aware checks
For clinical, public-health, and longitudinal research, Cox proportional hazards regression is a common starting point when the outcome is time to event. The model's usefulness depends on more than obtaining hazard ratios. Researchers should define the event and censoring rules, establish the time origin, handle tied event times appropriately, and evaluate whether the proportional hazards assumption is credible.
A practical Python workflow can include:
- Construct the analysis table. Include follow-up time, event status, covariates, and identifiers that allow records to be traced back to source data.
- Describe censoring. Report who was censored, when follow-up ended, and whether censoring could be informative.
- Fit the Cox model. Include covariates justified by the research design rather than selecting variables only because they produce convenient p-values.
- Check proportional hazards. Examine time-varying effects or diagnostic patterns that indicate the hazard ratio may not be constant.
- Assess sensitivity. Compare reasonable specifications and explain how conclusions change under alternative assumptions.
The Cox regression and survival-analysis guide provides a focused reference for this model family. If the proportional hazards assumption fails, consider stratification, time-varying effects, or another survival model. Don't describe a hazard ratio as a universal risk multiplier without explaining its time scale, covariates, censoring, and uncertainty.
Building Reproducible and Auditable Research Assets
A notebook is not automatically reproducible because it contains code. Reproduction also depends on the input data, package versions, execution order, random seeds where relevant, transformations, exclusions, model specification, and output interpretation. A PDF report is not automatically auditable either if it preserves only the final figures and prose.
The durable unit of research should be an analytical asset that connects the question to the data transformation, method, result, and limitation. That asset should let a collaborator understand what happened without reconstructing the entire investigation from memory.
Preserve the chain of evidence
A sound reporting package usually includes:
- The objective: State the research question, outcome, population, and comparison.
- The data record: Preserve source files or a controlled reference to them, along with cleaning decisions.
- The method record: Document assumptions, model choices, exclusions, and sensitivity analyses.
- The execution record: Preserve Python code, package context, and ordered transformations.
- The result record: Save tables, plots, diagnostics, effect estimates, confidence intervals, and caveats.
- The review record: Identify which decisions require domain or statistical approval before publication.
Exporting to a Jupyter notebook and PDF can make review easier, particularly when code and narrative remain connected. Persistent workspaces add another useful layer. Instead of allowing analyses to disappear into separate folders or chat sessions, researchers can preserve prior investigations, compare them, and reuse validated transformations.
Research reproducibility guidance is most useful when treated as a workflow requirement rather than a final formatting step. Build the audit trail while investigating, not after the manuscript has been drafted.
Agentic analytics fits this model when it exposes the plan, generated code, intermediate outputs, methodology, and final synthesis. It can handle mechanical execution and produce a structured analysis page, but researchers should still inspect the code, verify the data interpretation, and challenge the model assumptions. Automation is valuable precisely because it leaves more time for those higher-level judgments.
Frequently Asked Questions
Is Python good for statistical analysis?
Yes, Python is well suited to statistical analysis when its ecosystem is used deliberately. pandas supports tabular preparation, SciPy supports focused statistical procedures, and statsmodels supports interpretable inference and diagnostics. Python's flexibility is an advantage for integrated research workflows, but it doesn't eliminate the need to check assumptions or document decisions.
Should I use SciPy or statsmodels?
Use SciPy for focused procedures such as distributions, correlations, summary statistics, and hypothesis tests. Use statsmodels when you need regression, formula-based modeling, parameter estimates, standard errors, residual diagnostics, and a structured results object. Many research workflows use both.
What is the safest default t-test in Python?
Welch's t-test is often a safer default than the equal-variance version when group variances may differ. The right choice still depends on the design, estimand, sample size, dependence structure, and scientific question. Researchers should inspect the data and report the rationale rather than select a test by habit.
Can AI perform statistical analysis in Python?
AI can plan and execute parts of a Python analysis, inspect intermediate outputs, revise failed steps, and produce a structured report. It can't replace scientific judgment about measurement, confounding, missingness, causal interpretation, or whether a result is meaningful. Generated code and methodology should remain inspectable.
How do I make Python analysis reproducible?
Preserve the input data or a controlled data reference, transformations, package versions, code, model assumptions, diagnostics, outputs, and narrative interpretation. Exporting a notebook or PDF helps, but reproducibility also requires a clear execution order and enough methodological context for another researcher to audit the work.
Conclusion
Python for statistical analysis works best when researchers stop treating it as a collection of convenient test functions and start treating it as a layered research system. The important decisions happen before and after model fitting: define the estimand, inspect the data, classify missingness, choose reliable methods, test assumptions, compare specifications, and preserve the reasoning.
Manual notebooks remain useful for exploration and direct control. Agentic analytics adds value when it coordinates multi-step investigations, executes Python, inspects outputs, and saves a durable record without hiding the methodology. The researcher should delegate repetitive coding, not the responsibility for scientific judgment.
Researchers can download and try the analysis platform, review discounted academic pricing, and check whether 1,000 free credits for researchers are currently available. Use it on a real dataset, inspect the generated Python and methodology, and keep only the conclusions that survive your own domain and statistical review.