You've inherited a spreadsheet with inconsistent category labels, silent missingness, and a column that changed meaning mid-study. Data quality assessment tools help answer different questions: profiling reveals problems, cleanup tools repair representations, validation suites enforce rules, and monitoring detects change. PlotStudio AI adds upload-time profiling and scoring to research data analysis, before modeling begins.
The immediate temptation is to clean everything that looks unusual. That can make the dataset less defensible. A rare observation might be scientifically important, while a perfectly formatted column might contain measurements collected under incompatible definitions.
The Government Data Quality Framework distinguishes completeness, whether required information is present, from accuracy, whether values reflect reality. A filled spreadsheet isn't necessarily an accurate one.
Practical rule: Choose the tool by the question you need answered, not by how impressive its quality dashboard looks.
For a single inherited file, start with inspection and documented cleanup. For recurring study extracts, add explicit validation rules. For institutional pipelines, consider monitoring and ownership workflows.
The tools below serve those different jobs. Their most important difference isn't whether they find missing values. It's whether their outputs help you explain what failed, what changed, and why the resulting dataset is suitable for your intended analysis.
1. PlotStudio AI
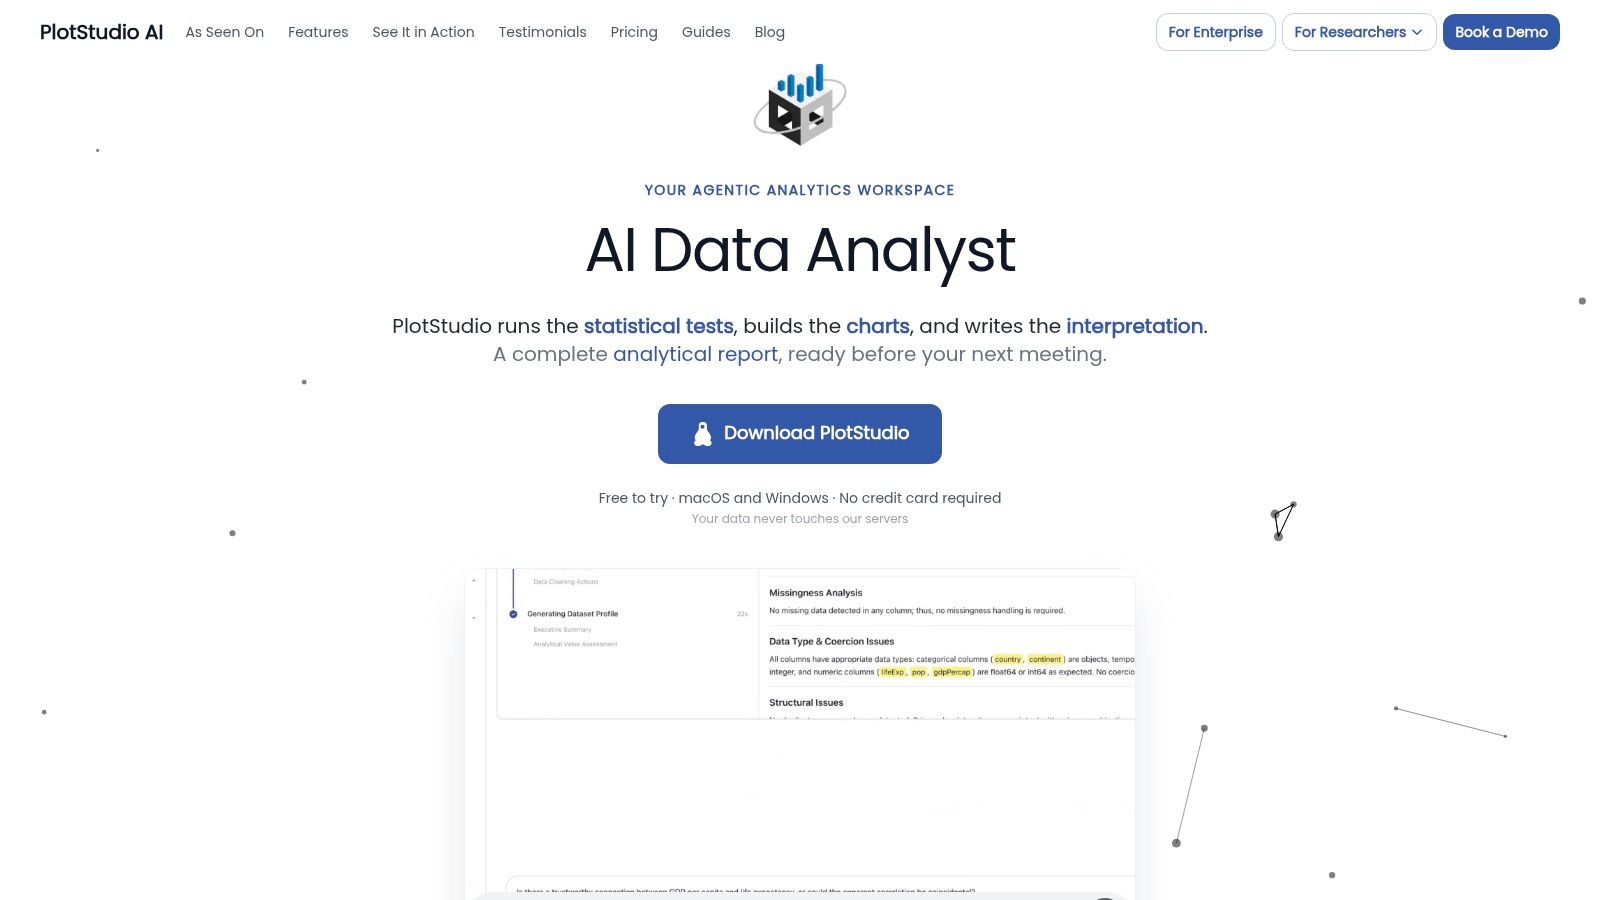
Question answered: Is this file usable, and what investigation should follow?
Our desktop workspace profiles uploaded data across schema, types, missingness, and distributions. It assigns Clean, Usable, or Needs Cleaning, then proposes a cleaning plan when it finds issues such as missing values or inconsistent notation.
The useful distinction is what happens next. You provide an objective, review the methodology in Plan Mode, and let specialized agents write and execute Python locally, inspect outputs, and revise the analysis. An answer is an output; an analysis is an investigation.
From a quality flag to an auditable analysis
Agentic analytics is data analysis performed by AI agents that can plan an investigation, execute analytical steps with real tools and code, inspect intermediate results, revise the approach, validate outputs, and synthesize a complete analysis.
For a longitudinal clinical dataset, that means moving beyond a missing-value count toward examining missingness by visit and treatment group before choosing an analytical approach.
- Audit artifacts: Analysis Pages retain methodology, tables, charts, statistical tests, interpretation, and inspectable Python.
- Documented cleanup: Transformation records include dropped rows, imputations, and recodings.
- Reproducible handoff: Jupyter and PDF exports support review outside the workspace.
The trade-off is delegated execution versus review responsibility. Generated methods and interpretations still need scientific scrutiny. Local Python execution also doesn't mean AI requests are offline, so institutional approval remains necessary.
It's the wrong choice if your primary need is enterprise-wide pipeline alerting. It's a relevant Julius AI alternative when you want research-oriented, multi-step investigation with visible methodology rather than only conversational answers.
2. YData Profiling
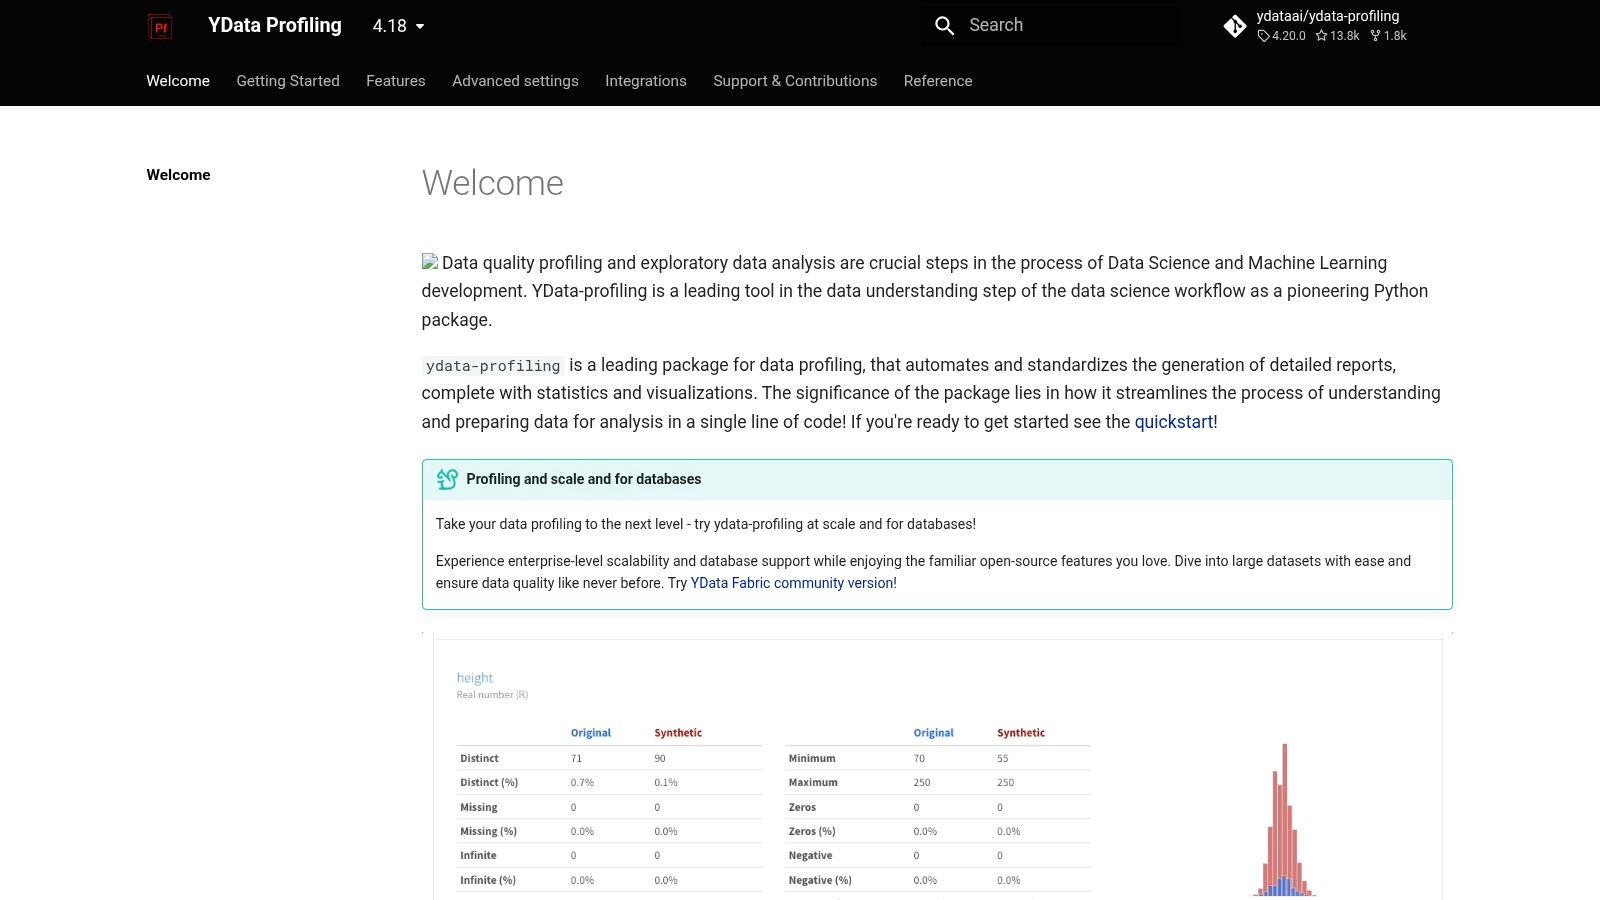
A collaborator sends a dataframe without a reliable codebook. Before fitting anything, you need to inspect variable types, missingness, distributions, and duplicate records.
YData Profiling generates exploratory reports from dataframes, with HTML and notebook outputs. It fits naturally into a Python workflow and supports pandas and Spark, dataset comparisons, and time-series profiling.
Best for understanding an unfamiliar dataset
Its strength is broad inspection before you know which rules to write. A report can expose a near-constant predictor, suspicious category cardinality, or a numerical column imported as text.
The systematic review of data-quality frameworks identifies accuracy, completeness, consistency, timeliness, and relevance as prominent dimensions. Profiling addresses parts of that picture, but a distribution alone can't establish whether a measurement matches reality.
The trade-off is breadth versus interpretation. An outlier warning doesn't tell you whether to exclude an observation. Large datasets may also require configuration changes or a Spark environment.
For auditability, retain the report alongside the input version, configuration, and generating code. The report documents what you inspected, not why you approved the dataset.
It's the wrong choice when you need enforced release gates or nontechnical cleanup. Our guide to data profiling software explains that distinction in more depth.
3. OpenRefine
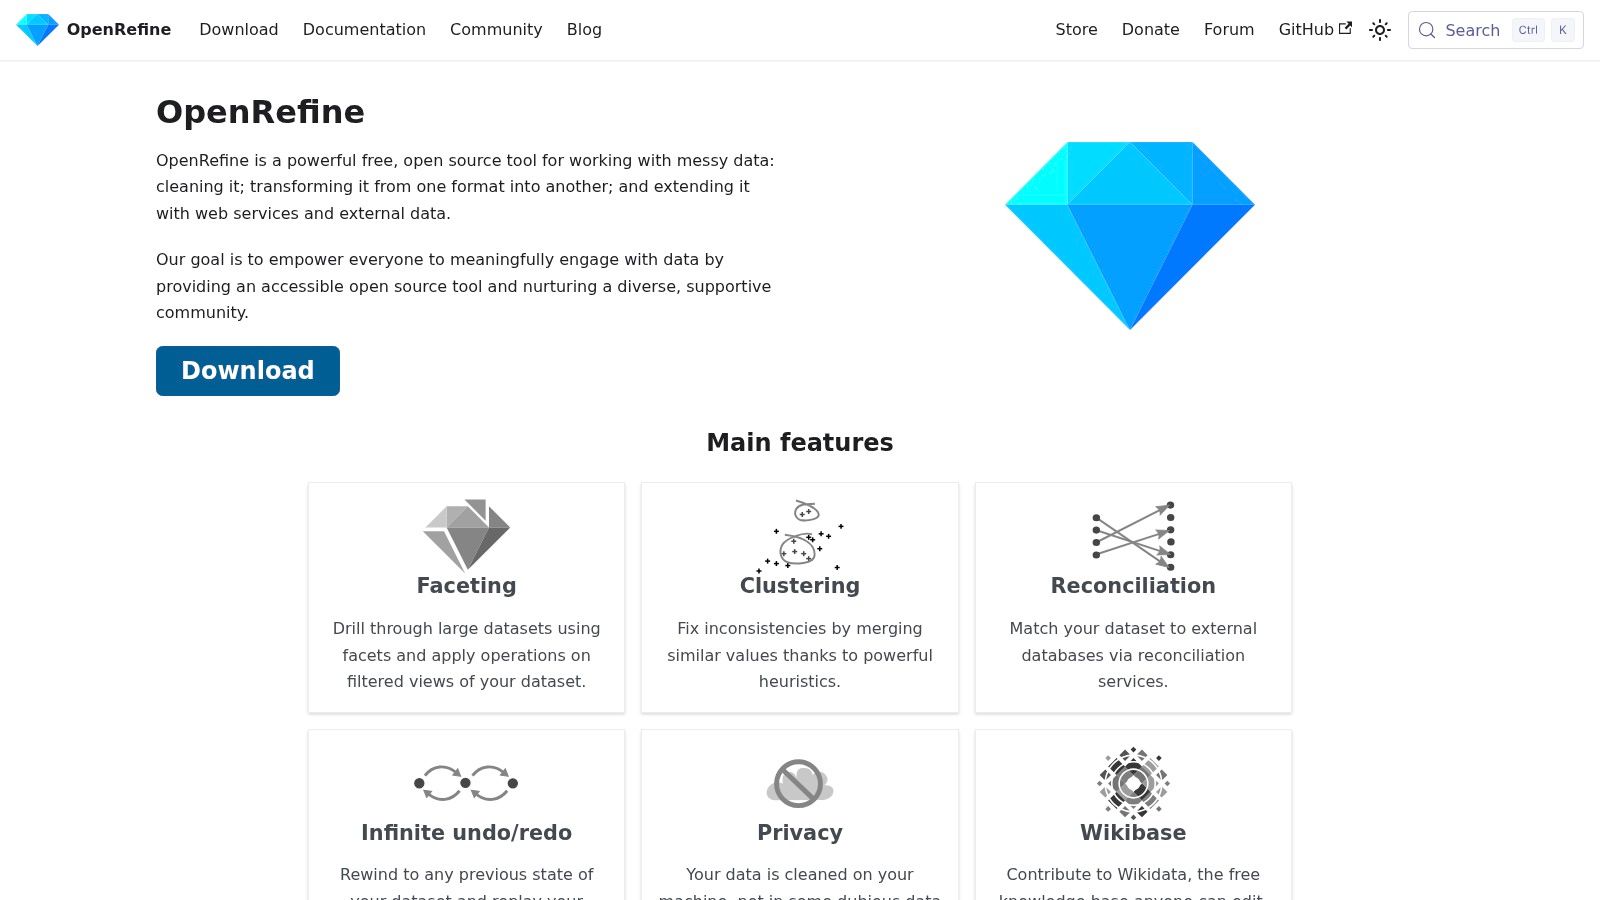
Question answered: Which labels and representations need correcting?
OpenRefine is a free, open-source desktop application for inspecting and transforming messy tabular data. Its facets let you isolate records by value, while clustering suggests similar strings that might represent the same category.
Say a field contains Control, control, and Control group. Those might be safe to harmonize. Similar-looking hospital names, however, might identify distinct sites.
Merge representations only after confirming that they refer to the same scientific concept.
OpenRefine works well when you need to examine those decisions interactively without writing a cleaning script from scratch. It preserves the original source file and saves work within a project.
- Useful output: A cleaned export plus an operation history that can be replayed on similar data.
- Audit requirement: Preserve the project and explain consequential merges, rather than retaining only the final CSV.
- Privacy boundary: Optional reconciliation and web-service features can involve external services.
The trade-off is accessible cleanup versus automated enforcement. Its operation history helps reconstruct transformations, but it doesn't prove that your recoding was scientifically correct.
It's the wrong choice for ongoing pipeline monitoring or statistical investigation. Understanding what it means to clean data matters more than accepting every suggested cluster.
4. Great Expectations (GX Core)
Your study receives refreshed extracts, and the same assumptions must hold each time. Participant identifiers must be present, visit labels must follow the protocol, and dates must satisfy documented constraints.
Great Expectations provides GX Core, a Python library for defining reusable Expectations, organizing suites, and validating supported data sources. Data Docs and validation results make those checks easier to inspect.
Best for repeatable study gates
Unlike a profiling report, a validation suite expresses what you require before analysis proceeds. This follows the emphasis on computer-checkable requirements in ISO 8000's master-data-quality standard.
Useful research checks include identifier uniqueness at the correct observational level, permitted treatment codes, and required outcome fields. Be careful with repeated measures: participant identifiers should repeat across visits, while the participant-and-visit combination may need to be unique.
The trade-off is explicit control versus maintenance effort. Someone must write, version, and update the rules as the study evolves.
For auditability, retain the suite, input version, validation result, and approved exceptions together. A data quality scorecard can summarize those results without concealing failed rules.
GX Core is the wrong choice if you need immediate, no-code inspection of an unfamiliar file. Passing a suite means the specified expectations passed, not that every relevant defect was tested.
5. Soda
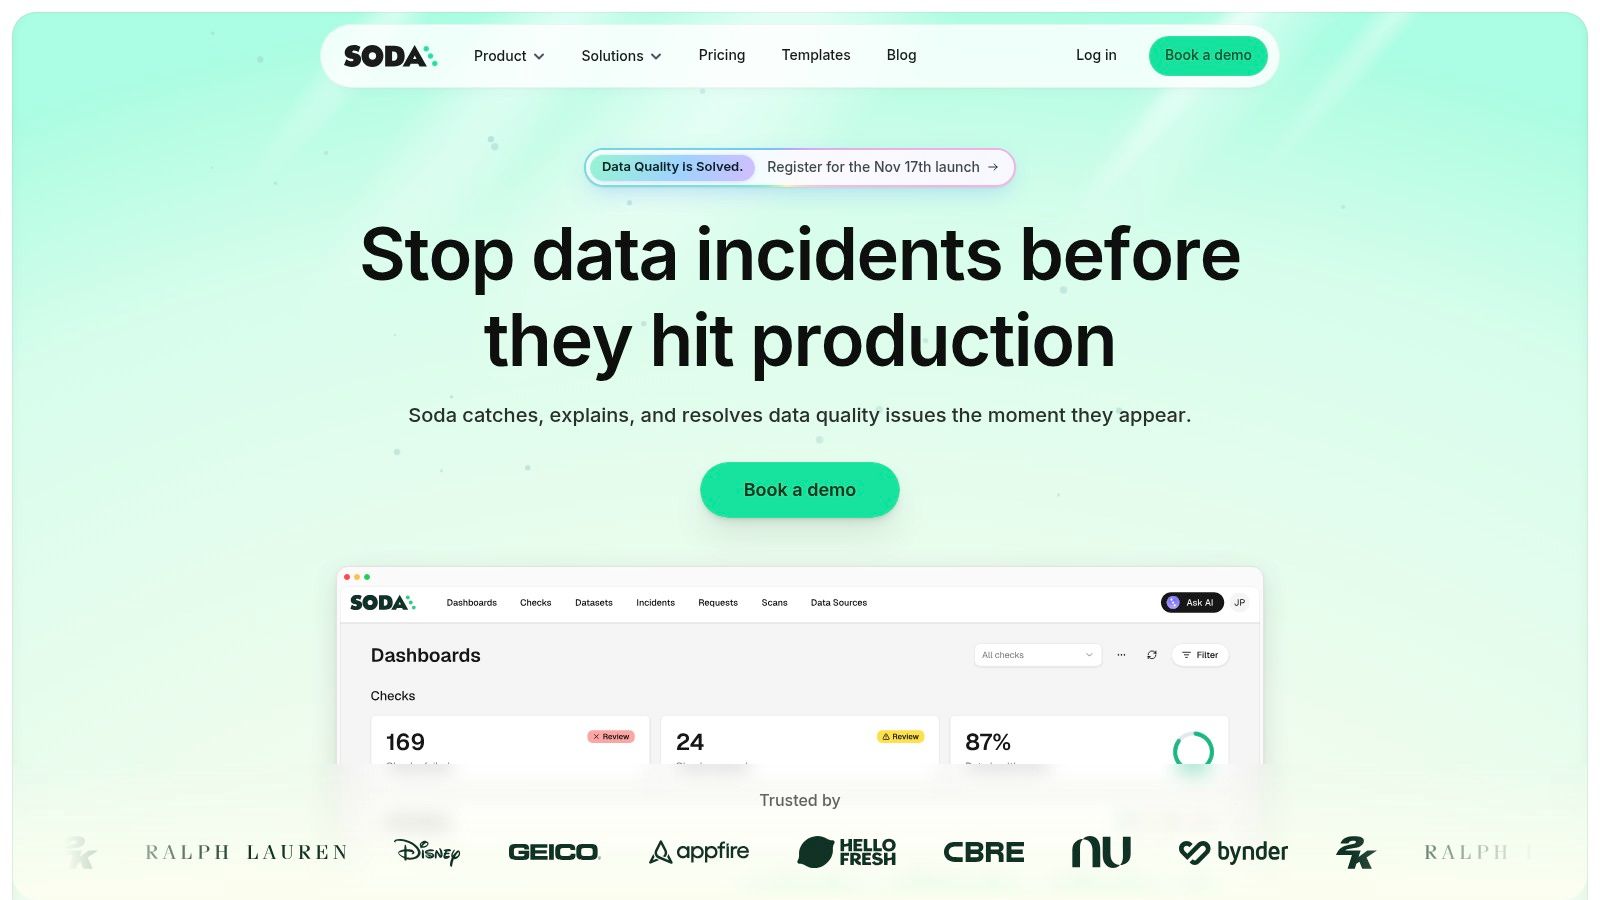
Question answered: Will the next delivery still meet our agreement?
Soda combines quality checks, data contracts, and monitoring for teams operating data pipelines. It's more relevant to a shared research data service than to a researcher inspecting an isolated spreadsheet.
A data contract can document the schema, expected fields, and quality requirements that a producing team agrees to maintain. That's useful when a clinical informatics team supplies extracts to several research groups.
Best for producer-consumer accountability
The Health IT Data Quality Assessment framework recommends establishing targets and thresholds for quality dimensions. The practical lesson is to define acceptable behavior before a delivery fails, rather than negotiate it during an incident.
- Checks: Encode known requirements for pipeline outputs.
- Monitoring: Track changing metrics and unexpected patterns.
- Operational follow-through: Connect failures to alerts, tickets, and responsible teams.
The trade-off is operational discipline versus infrastructure overhead. Soda offers free and paid plans, but dataset limits and deployment requirements need evaluation against your workload.
For auditability, preserve contract versions, scan results, and incident resolutions. A dashboard screenshot isn't enough to establish which rule applied to a historical extract.
It's the wrong choice when nobody will maintain checks or respond to alerts. Sensitive data also requires review of the actual hosted and locally installed components.
6. Ataccama ONE
A university data office needs to assess governed assets across departments, not just clean a laboratory workbook. In that situation, catalog context and stewardship can matter as much as the checks themselves.
Ataccama ONE combines profiling, rule-based assessment, quality reporting, observability, and remediation capabilities. Cloud, on-premises, and hybrid options support different institutional architectures.
Best for institution-wide quality management
Profiling can expose missingness, distributions, and unusual patterns. Rules and thresholds then turn selected findings into recurring assessments, while stewardship workflows help assign responsibility for correction.
The trade-off is organizational coverage versus implementation burden. Connecting sources is only part of the work. Institutions must also agree on definitions, ownership, permissions, and escalation procedures.
For a multicenter registry, the central question might be whether an apparent inconsistency reflects a mapping failure or a legitimate local collection practice. A shared platform can organize that investigation, but a subject-matter owner still has to resolve the meaning.
- Audit strength: Connect quality findings to cataloged assets and remediation responsibilities.
- Audit caveat: Preserve historical rule definitions and resolutions, not merely current scores.
- Commercial consideration: Pricing requires a sales discussion rather than a simple self-service purchase.
Ataccama ONE is the wrong choice for an individual researcher who needs a local, file-based workflow. Its governance scope is valuable only if your organization can sustain it.
7. Qlik Talend Cloud
Question answered: Can we assess data while integrating it?
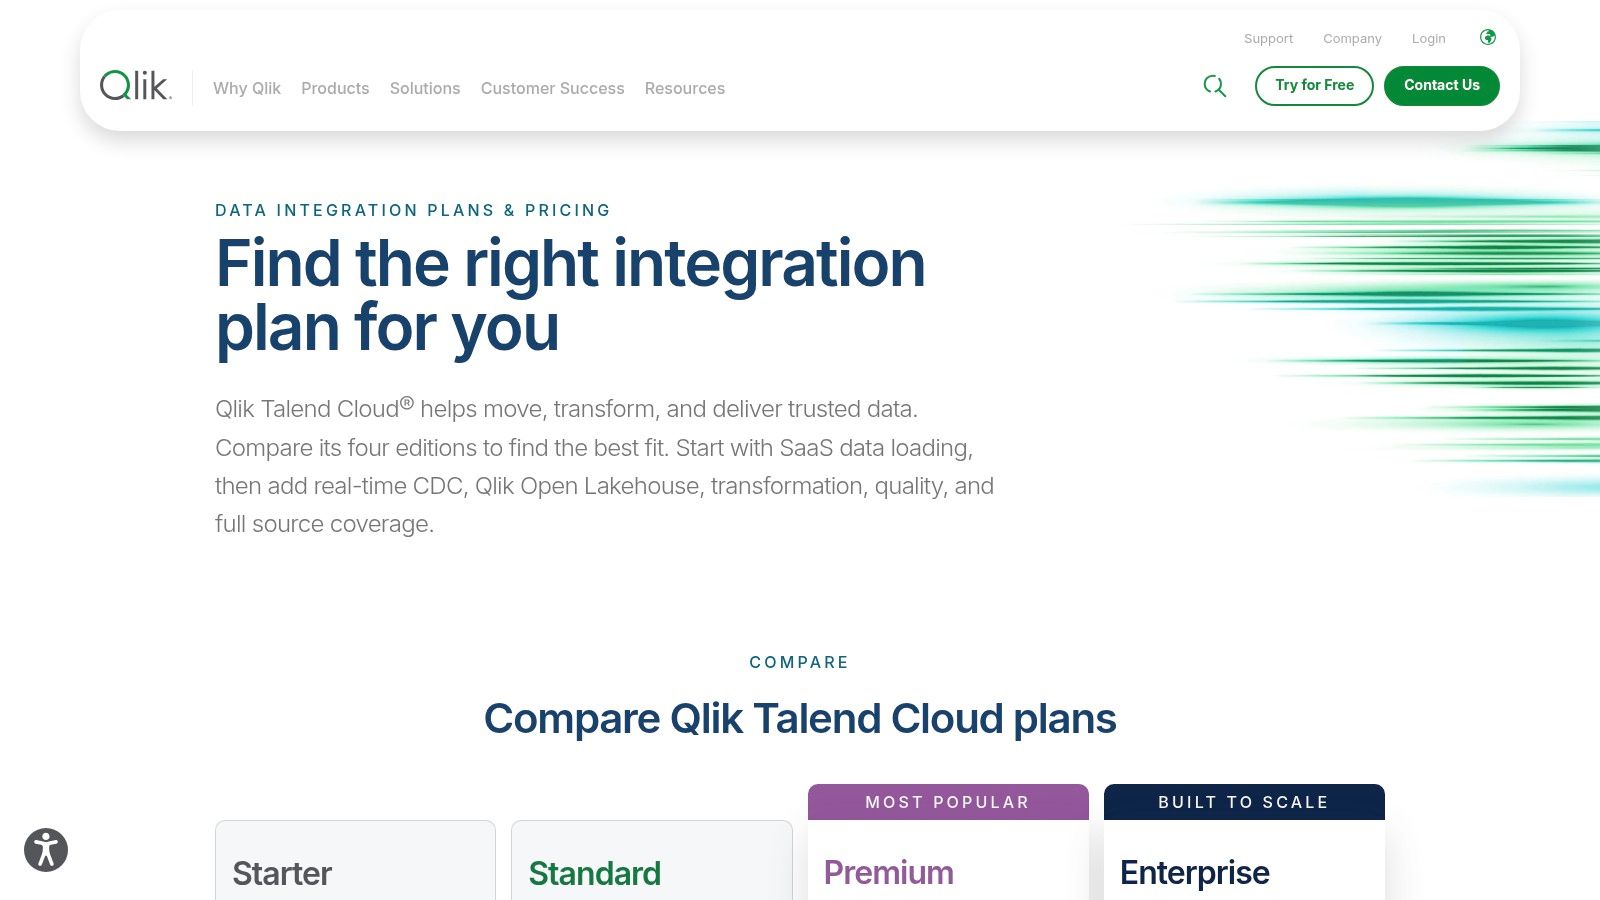
Qlik Talend Cloud connects data movement and transformation with profiling and quality capabilities. It suits teams combining operational sources into research-ready datasets.
Consider a public-policy project linking enrollment records, attendance extracts, and outcomes. Each file can look reasonable while the combined dataset contains incompatible identifiers or transformations that change the analytical population.
Audit priority: Document the join and its exclusions, not just the cleanliness of each input.
The platform's profiling, quality rules, semantic-type recognition, and stewardship capabilities can support that work, depending on the plan. Review the available features carefully, because some quality capabilities begin with Premium offerings.
The trade-off is integrated processing versus platform complexity. Capacity-based pricing and integration concepts can be difficult to justify for a small lab.
For auditability, retain mappings, transformation versions, validation results, and stewardship decisions. A passing source-level profile doesn't establish that a join preserved the intended sample.
Our overview of data integration solutions explains why moving data and validating its meaning are separate responsibilities.
It's the wrong choice if you only need a lightweight profiling report. Its value comes from embedding quality work within a broader integration workflow, not replacing scientific review.
8. Informatica Data Quality and Observability
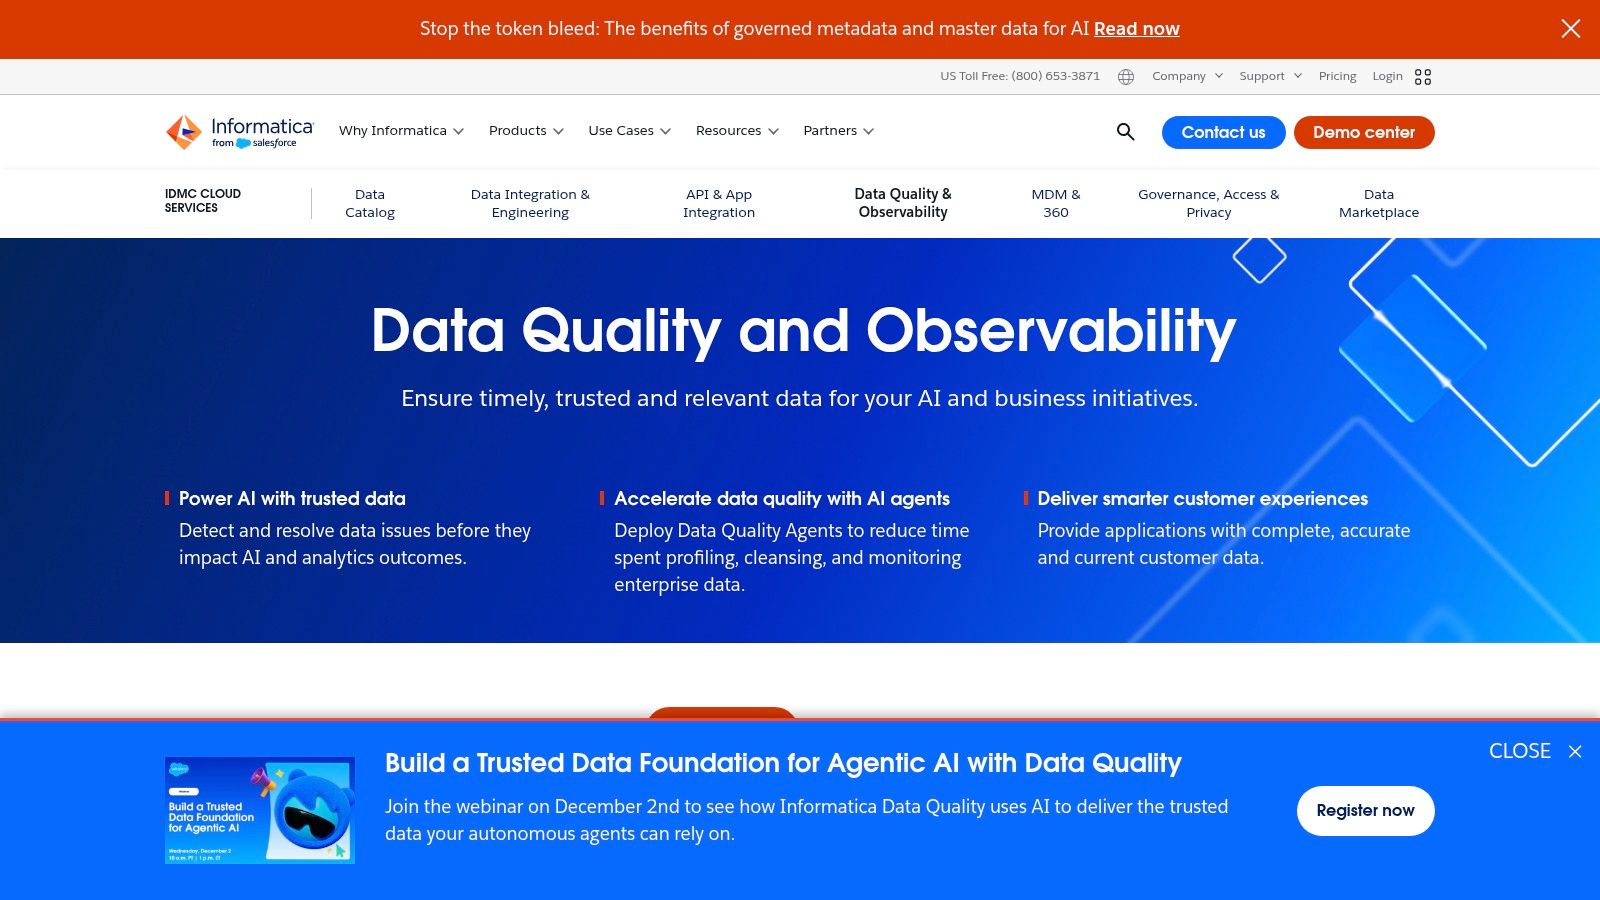
Finding duplicate records is easier than deciding how to reconcile them. A large research organization may need reusable standardization and matching workflows across heterogeneous systems.
Informatica Data Quality and Observability covers profiling, validation, cleansing, standardization, deduplication, and monitoring. It also connects with broader catalog, governance, and integration products.
Best for institutional remediation
Visual, no-code capabilities can make quality workflows accessible beyond specialist programmers. Reusable rules are useful when departments repeatedly encounter the same formatting and reference-data problems.
The systematic survey of data-quality software identified 667 tools, illustrating why a recognizable vendor name isn't a sufficient selection criterion. The relevant question is whether the platform handles your sources, rules, and remediation process.
The trade-off is remediation breadth versus operational complexity. Consumption-based or quote-driven pricing also requires workload planning.
For auditability, keep the original records, matching criteria, surviving-record logic, and transformation history. A consolidated record is difficult to defend if reviewers can't reconstruct why records were merged.
It's the wrong choice for a small project that needs a self-contained local workflow. Enterprise cleansing capabilities also don't decide whether similar participant records represent a duplicate, a household relationship, or distinct individuals.
9. Anomalo
Question answered: What changed that we didn't think to test?
Anomalo monitors warehouse data using learned patterns alongside user-defined checks. Visualizations, alert routing, lineage, and investigation features support teams responsible for many tables.
A research warehouse might receive a plausible-looking extract after an upstream coding change. Required fields remain populated, but a subgroup distribution changes unexpectedly.
Best for detecting unanticipated changes
Explicit rules catch known violations. Learned anomaly detection can flag behavior you didn't anticipate when writing those rules.
In Anomalo's enterprise survey, 100% of surveyed data leaders and practitioners reported addressing quality issues in warehouses or lakes, among more than 300 enterprise data professionals. That finding concerns enterprise operations, the setting this tool targets.
The trade-off is broader detection versus interpretive uncertainty. An unusual distribution might reflect an ingestion defect, a recruitment change, or a genuine population shift.
For auditability, retain the alert, comparison period, affected data version, investigation, and disposition. A closed alert should explain why the change was accepted or corrected.
It's the wrong choice for one-time assessment of a local spreadsheet. Understanding anomaly detection methods also helps prevent the mistaken assumption that every anomaly is an error.
10. Monte Carlo
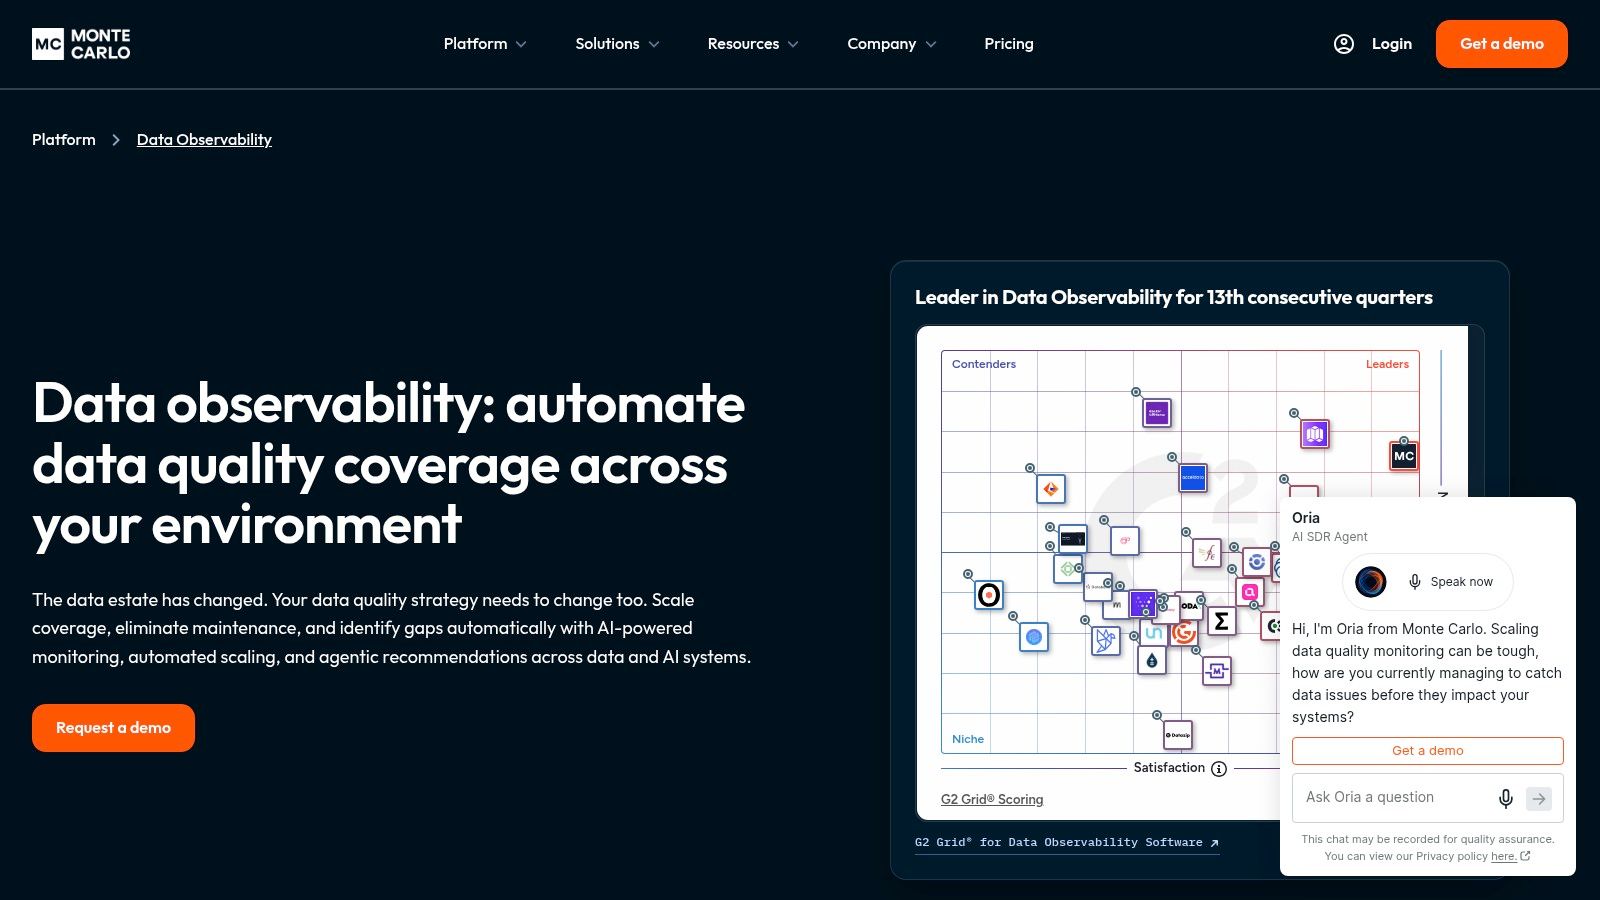
The dataset looks clean, but it came from yesterday's failed refresh. Missing-value checks won't necessarily reveal that the analysis is using stale information.
Monte Carlo focuses on data observability across pipelines and analytics systems. It profiles attributes such as field types, null rates, and cardinality, and combines monitoring with lineage and incident context.
Best for tracing pipeline impact
Freshness and upstream dependencies matter when researchers rely on maintained data products. If an ingestion job fails, the immediate question is which tables, reports, and downstream consumers are affected.
- Detection: Monitor data health and unexpected changes across connected systems.
- Investigation: Use lineage and root-cause context to locate likely upstream causes.
- Deployment: Configure monitors through interface and programmatic approaches.
The trade-off is system visibility versus research-specific meaning. Observability helps establish whether delivery behaved as expected. It doesn't establish whether a variable measures the construct your model requires.
For auditability, retain incident timing, affected versions, downstream impact, and recovery evidence. A resolved operational incident doesn't automatically validate analyses run during the affected period.
Monte Carlo is the wrong choice for an individual researcher preparing a standalone file. Pricing requires evaluation beyond the public product description, and the platform's operating scope is disproportionate unless connected systems need sustained monitoring.
Data Quality Assessment Tools Compared by Scope, Pricing Visibility, and Local Execution
| Item | Best For | Pricing Visibility | Local Execution | Reproducibility |
|---|---|---|---|---|
| PlotStudio AI | End-to-end research analysis with human-reviewed methods | Free trial; managed credits or BYOK; prices not specified | Runs analysis locally; AI requests go to provider | Inspectable Python; exportable Jupyter notebooks |
| YData Profiling | Exploratory data profiling in Python | Open-source package | Runs locally | Repeatable reports; HTML and notebook output |
| OpenRefine | Interactive cleanup of tabular data | Free and open source | Desktop application | Operation history can be replayed; projects can be exported |
| Great Expectations (GX Core) | Reusable, code-defined data-quality checks | Open-source Python library | Runs locally | Reusable expectations and validation results |
| Soda | Pipeline quality checks, contracts, and monitoring | Free plan and paid plans; plan pricing published | Hosted or locally installed options | Repeatable checks and ongoing monitoring |
| Ataccama ONE | Enterprise data quality, cataloging, and monitoring | Not publicly listed; contact sales | Cloud, on-premises, or hybrid | Scheduled checks and reporting |
| Qlik Talend Cloud | Data quality within integration pipelines | Plan descriptions published; free trial; features vary by plan | Cloud platform | Quality rules and stewardship workflows |
| Informatica Data Quality and Observability | Enterprise profiling, cleansing, and monitoring | Consumption-based or quote-driven | Cloud or enterprise deployment | Reusable rules and transformations |
| Anomalo | Ongoing warehouse monitoring and anomaly detection | Not listed; demo or sales discussion | Enterprise platform; local execution not specified | Automated monitoring plus user-defined checks |
| Monte Carlo | Observability across data pipelines and analytics systems | Not listed | Connected data-platform deployment | Configurable monitors, alerts, and lineage |
Matching the Tool to the Question You Need Answered
Start with the smallest tool that answers your actual question. For an unfamiliar file, use a profiling report to inspect structure and missingness, then OpenRefine if inconsistent labels need interactive correction.
For recurring study runs, use GX Core when you can define requirements explicitly and maintain them in code. Choose Soda when shared contracts, monitoring, and operational responses matter. Consider enterprise platforms only when many assets or pipelines must remain dependable across teams.
The ISO 8000-8 framework distinguishes syntactic, semantic, and pragmatic quality. That's a useful boundary: checking structure and meaning isn't the same as validating suitability for a particular research purpose.
A dataset can pass its checks and still be unsuitable for the scientific question.
Decide what each failure means
Return to the inherited spreadsheet. Category inconsistencies may justify documented recoding. Missing outcomes may require investigation of missingness mechanisms and sensitivity analysis. A column that changed meaning mid-study may require separate variables, restricted analyses, or stopping until the definition is clarified.
Don't let an overall score make those decisions. Define the consequence of each important failure before proceeding.
- Exploratory use: Proceed with clearly disclosed limitations when the defect doesn't invalidate the descriptive question.
- Conditional use: Resolve mappings or perform sensitivity analyses before making inferential claims.
- Stop and investigate: Pause when outcome definitions, identifier integrity, or collection changes make the intended analysis indefensible.
Keep the original data immutable. Record each cleaning decision, its rationale, affected records, and the person who approved it. Preserve inspectable code and rerun the relevant checks after remediation.
For sensitive research data, distinguish local execution from the full information flow. Review what any AI request, reconciliation service, connector, or hosted component transmits, and follow institutional requirements.
The best data quality assessment tools produce evidence you can inspect and reuse. They don't replace judgment about confounding, representation, measurement validity, or whether an observed difference is scientifically meaningful.
If you want upload-time profiling, cleaning plans, and reproducible Analysis Pages in one workspace, download and try PlotStudio AI. The free trial includes 30 credits on sign-up, consumed by data-analysis tasks, so you can assess the workflow with a suitable non-sensitive dataset before committing.