When you're handed a pie chart in a paper or slide, read it as parts of one defined whole: the slices should add to about 100 percent, and the largest labeled share is the clearest place to start. Compare the other categories by their percentage-point gaps, not by guessing how large the wedges look. Then check that the chart supports the sentence you want to make.
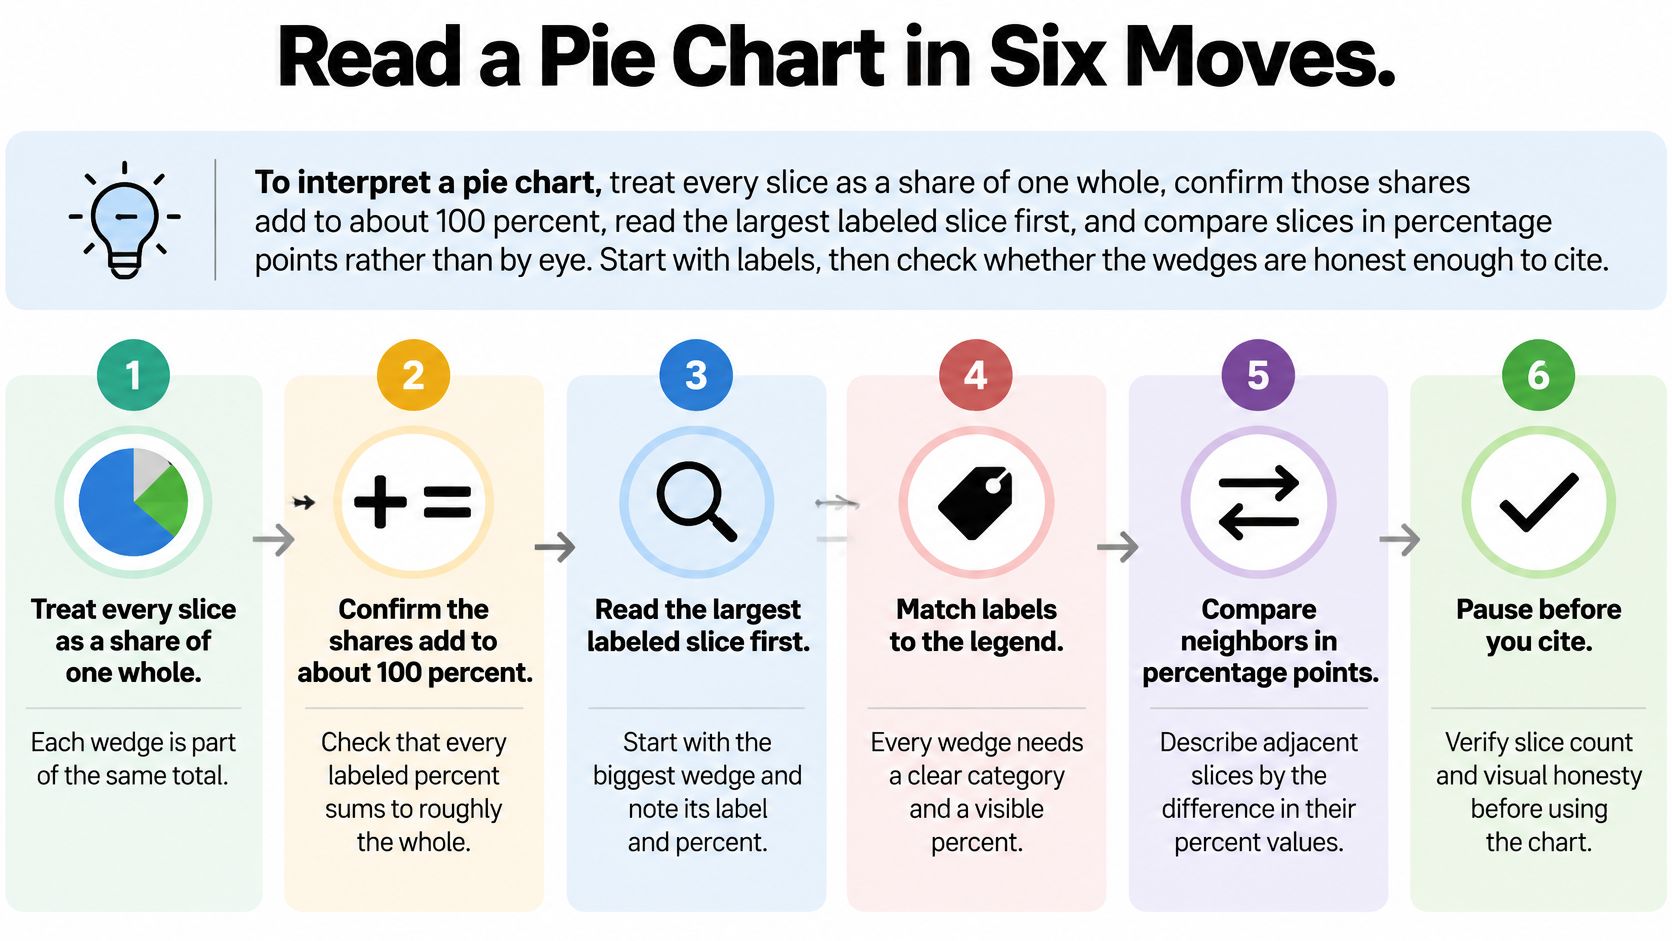
Read a Pie Chart in Six Moves
Read the title and define the whole. Check the population, units, and time window before looking at any wedge. “Share of lab spending” is not the same measure as “share of grants awarded,” and a percentage without a clear denominator is hard to interpret.
Find the starting wedge, then follow the labels. A standard pie starts at 12 o'clock and runs clockwise. The first wedge touches the top of the circle and extends to the right. Follow the chart's order, matching each wedge to its label or legend. Don't assume the legend follows the same order: it may list categories from largest to smallest even when the wedges don't. If the chart starts at a different angle, use its labels rather than assuming the first slice is at the top.
Match each wedge to a distinct category. Every slice needs a clear label, and the categories should not overlap. If one participant could appear in two slices, the chart isn't dividing one whole into mutually exclusive parts.
Record the largest labeled share. Write down the category and its percentage before comparing anything else. A slice that looks largest is a clue, not a measurement. The printed value is more reliable than your estimate of its area.
Convert before comparing if percentages are missing. If the chart gives angles, counts, or amounts instead of percentages, calculate each share using the right denominator. Don't compare raw counts as though they were percentages.
Rank the remaining slices and write one defensible sentence. Note the gap between the leader and the next category, then describe what share remains. If the categories have a meaningful sequence, keep that order in the description. Otherwise, rank them by their labeled values.
A lab-budget example
Suppose a hypothetical lab-budget pie labels personnel at 46 percent, reagents at 28 percent, equipment at 18 percent, and travel and other at 8 percent. The shares add to 100 percent. Personnel leads reagents by 18 percentage points and accounts for just under half the budget.
A concise interpretation could read: “Personnel accounts for 46 percent of the lab budget, 18 percentage points more than reagents; equipment and travel and other account for the remaining 26 percent.” The ordering in a spoken sentence needn't follow a sorted legend or the wedges' clockwise order. State the sequence only if it matches the labeled values or has a meaningful reason.
Practical rule: If the percentage is printed, cite the label. If it isn't, calculate the share before describing which slice is larger.
For a broader guide to presenting figures clearly, see PlotStudio AI's data visualization guidance. If your chart describes investment-fund returns, the guide to understanding fund fact sheet returns can help you check what the reported measures mean.
Convert Angles and Counts to Percentages
Use one of these formulas, depending on what the chart gives you:
- From an angle: Percent = angle ÷ 360 × 100.
- From a count: Percent = category count ÷ grand total × 100.
The denominator is the whole circle or the total number of observations. Without it, a count doesn't tell you what share the category represents.
Work from angles or counts
One percent of a circle is 3.6 degrees. That makes common angles easier to recognize: a right angle is a quarter of the circle, a half-circle is half the whole, and a 72-degree wedge is one fifth.
| Share of the whole | Percent | How to recognize it |
|---|---|---|
| Full circle | 100% | Every category together |
| Half | 50% | A straight diameter |
| One third | 33⅓% | Three equal wedges |
| One quarter | 25% | A right angle |
| One fifth | 20% | Five equal wedges |
| One tenth | 10% | A thin but still readable slice |
| One percent | 1% | Too small to judge by eye |
For anything between these familiar wedges, use the formula instead of estimating. For example, a 72-degree wedge represents 72 ÷ 360 × 100 = 20 percent.
Now suppose a hypothetical survey includes 235 respondents, with 47 in one category and 12 in another. The first category represents 47 ÷ 235 × 100 = 20.0 percent. The second represents 12 ÷ 235 × 100 = 5.1 percent when rounded to one decimal place.
Round without changing the categories
Round each slice to one decimal place, then check that the displayed shares still total 100.0 percent. Rounding each share independently can make the total miss slightly. If that happens, adjust the largest slice by 0.1 percentage point when needed, and identify the adjustment in your notes rather than inventing a new category.
An exploded slice pulled away from the center still has the same underlying percentage. A tilted 3D drawing also leaves the calculation unchanged, even though perspective can make the front wedge look larger.
If printed labels and calculations from the counts disagree by more than rounding can explain, check the counts and denominator. Don't trust a drawing that contradicts its underlying values. For a related explanation of how distribution summaries answer different questions, see how to compare Gini and density measures. To keep calculated shares separate from early impressions, use PlotStudio AI's guide to exploratory data analysis.
Compare Slices in Stakeholder Language
A stakeholder needs the comparison, its base, and its limits. Sort categories by their labeled percentages when ranking matters. Then express differences in percentage points, which means subtracting one percentage from another.
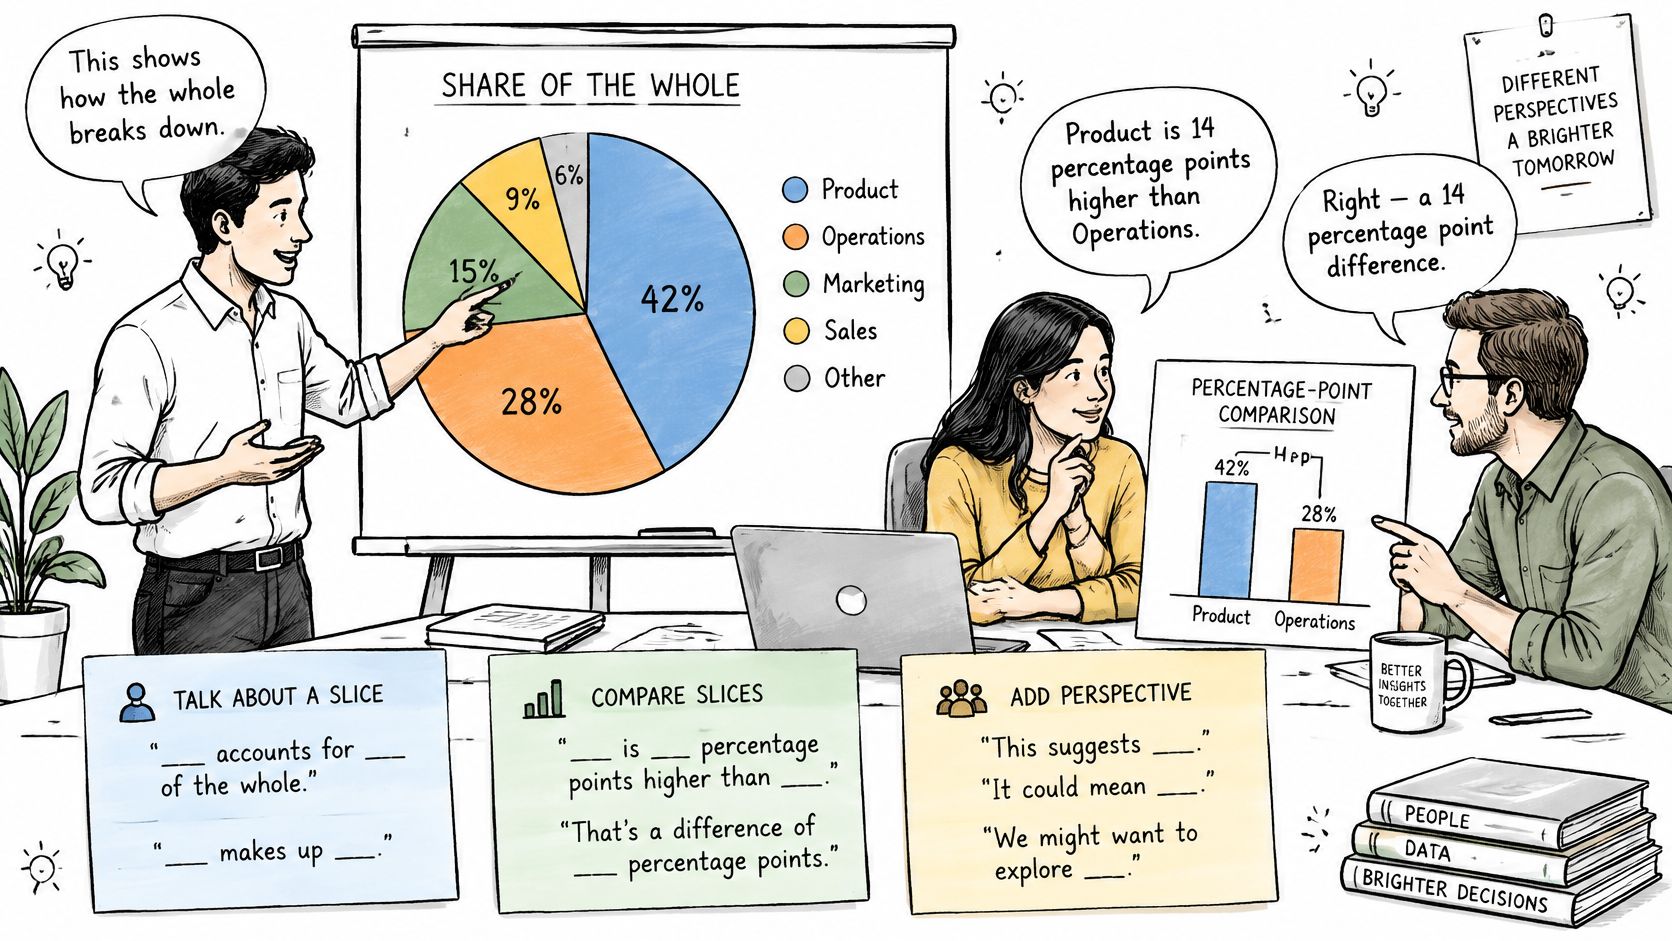
Consider a hypothetical clinical-enrollment pie with Site A at 38 percent, Site B at 27 percent, Site C at 22 percent, and Site D at 13 percent of 640 participants. Site A leads Site B by 11 percentage points. Together, the two largest sites account for 65 percent of enrollment. No site has a majority.
Those values support several accurate statements:
- Short slide title: “Site A contributes the largest enrollment share.”
- Report sentence: “Site A accounts for 38 percent of the 640 enrolled participants, 11 percentage points more than Site B. The two largest sites together account for 65 percent, and no single site represents a majority.”
- Overstated version to avoid: “Site A dominates enrollment.”
The last description overstates what the numbers establish. “Most” usually implies a share clearly above half, so don't use it for a category below 50 percent. If you write “vast majority,” pair the phrase with the number and make sure the share is close to three quarters or more. For small categories, don't lump them under “other” without naming what the group contains.
Percentage points and relative increases are different claims. In this example, Site A's 38 percent is 11 percentage points above Site B's 27 percent. Dividing the difference by Site B's share gives a relative gap of about 41 percent, which means Site A's share is about 41 percent larger than Site B's. That wording depends on Site B as the base. For a stakeholder comparison, state the 11-point gap; include a relative comparison only if it helps and you name its base.
The same distinction applies to the hypothetical budget example: 46 percent for personnel versus 28 percent for reagents is an 18-point gap. Relative to reagents, personnel's share is about 64 percent higher. These statements answer different questions.
A percentage describes a share of a stated total, so name the denominator when comparing separate pies. Two charts for different years can have similar shares but different numbers of participants. Compare their percentages and state both denominators instead of treating wedge size as a comparison of absolute counts.
This guide to data visualization best practices offers further help with making chart claims easy to check.
The video below provides another perspective on reading and communicating chart comparisons.
Catch Distorted Pies Before You Cite Them
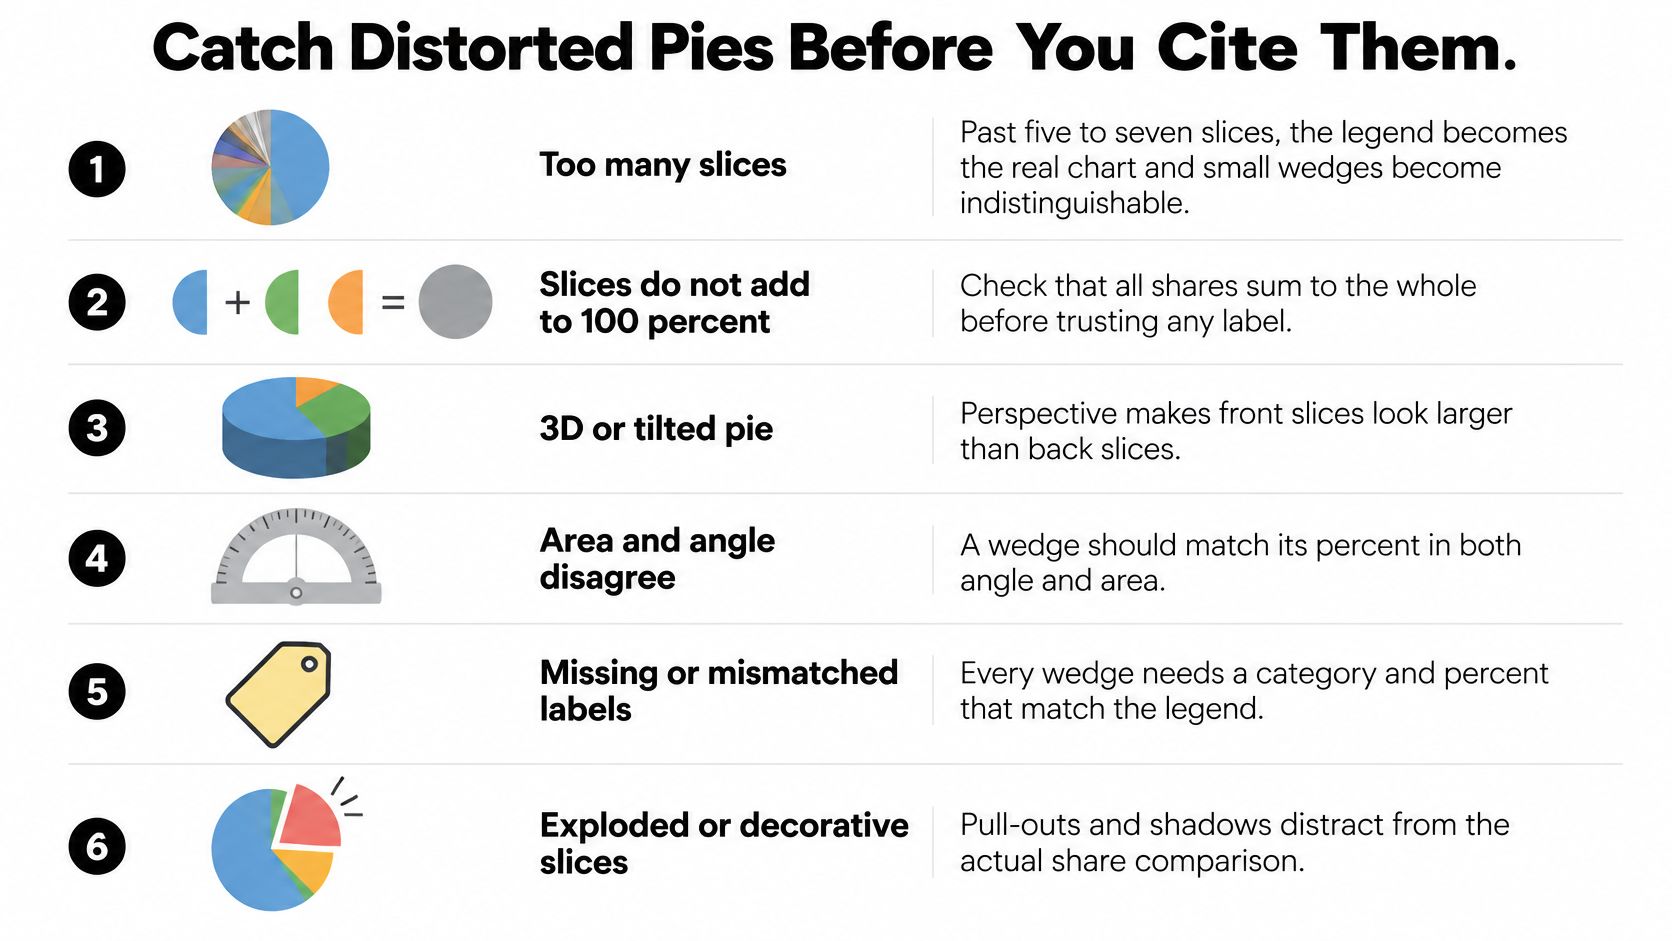
A distorted pie rarely changes the numbers underneath it. It changes what the eye believes before the numbers get read. A tilted circle gives the front wedge area it did not earn, an exploded slice borrows attention from its neighbors, and a catch-all "other" category hides the differences a decision depends on. None of that shows up in the printed percentages, which is why the audit happens before the citation.
Audit the chart in review order
- Count the slices. Once categories outnumber five or six, small wedges turn every comparison into a legend-matching exercise, and shares separated by a few points become indistinguishable by angle.
- Check whether the categories partition one whole. The slices must be mutually exclusive and account for the full total between them. Overlapping groups or an omitted category means the circle no longer represents 100 percent of anything defined.
- Reconcile the labels. Shares that sum near 90 or 110 percent point to a dropped category, a double count, or rounding stacked onto one slice. Check the unrounded values and the denominator before assuming rounding explains the gap.
- Check for distortion. A 3D tilt makes foreground wedges look larger than identical shares drawn at the back, and a slice pulled away from the circle draws attention without changing its share. A flat chart with no pull-outs keeps the area honest.
- Match labels to wedges. Similar colors or a legend detached from the circle make it easy to attach the right value to the wrong slice. A stated total lets the reader verify the denominator directly.
- Reject values that cannot be shares. Negative numbers cannot be pieces of a whole. Percentages of percentages need a named base before they can sit in a circle at all.
A chart can pass every item above and still bury the story. Take a hypothetical grant budget whose 22 percent "other" slice bundles four unlike costs. The share is accurate and the slices partition cleanly, but the grouping conceals the distinction between equipment and travel that a funding decision turns on. Splitting "other" into named categories fixes the information problem; a more vivid label on the same wedge does not. PlotStudio AI's financial data visualization guide works through the same grouping issues in budget and revenue pies.
The last check removes the chart entirely. Write the sentence the figure is meant to carry, such as "personnel takes 46 percent of the budget, 18 points ahead of reagents." If the claim still names the whole, the shares, and the gap once the picture is gone, the pie earned its place. If the sentence goes vague without the visual, the chart was decoration. This guide to data visualization best practices applies the same standard to every chart type: the sentence has to survive the figure's removal.
Choose a Bar Chart or a Treemap Instead
Keep a pie only when it represents one whole divided into a small number of mutually exclusive parts, labels each share directly, and supports a comparison by percentage-point gaps. Switch charts when the reader needs a precise ranking, a comparison across groups, or a view of nested categories.
| Chart | Use it when | Avoid it when | What the reader compares |
|---|---|---|---|
| Pie or donut | One whole, about 2 to 5 exclusive parts, shares near 100% | Many categories, different totals, or a ranking task | Percentage points within one whole |
| Bar chart | Ranking magnitudes or categories that need not sum to 100% | The only message is a single part-to-whole with very few parts | Bar length, easiest for small gaps |
| Stacked bar | Composition compared across groups or time | A single group with only two or three parts | Segment length inside each bar |
| Treemap | Many parts of a whole, or a hierarchy such as group then item | Precise comparison of similar-sized categories | Labeled area, rough part-to-whole only |
Match the chart to the comparison
Use bars to rank categories or show close values. Every bar starts from a shared baseline, so readers can compare lengths without estimating wedge angles. Bars also work when values aren't parts of one whole and therefore don't need to total 100 percent.
Use stacked bars for composition across groups. A bar for each year or treatment group lets readers compare the segment mix across groups. When each bar represents the same total percentage, a 100 percent stacked bar focuses on composition; when totals matter too, the total bar lengths carry additional information.
Use a treemap for many categories or a hierarchy. Nested boxes can show spending by department and then by line item. Area is still difficult to compare precisely, so retain readable labels and use another display if similar-sized categories need careful ranking.
Don't expect a donut to solve a crowded pie. A donut is still a pie chart. The center can hold the total, but the slices still rely on the same angle-and-area comparison. Removing the middle doesn't clarify too many categories.
For example, if a researcher wants to see which of 24 genotype-trial lines leads in yield share, use sorted bars rather than a pie with 24 slices. The question is how the lines rank, not whether a circle represents the whole trial. PlotStudio AI's guide to financial data visualization is available for more examples of matching a visual form to the comparison.
File the Sentence with the Source Numbers
A chart can disappear from a slide deck or paper and leave the interpretation impossible to verify. The reusable unit is the sentence: “Personnel is 46 percent of the lab budget.” Keep it with the denominator and the arithmetic, because a pie chart is evidence for a percentage-point claim about one whole; wedge area is only the delivery device.
Make the interpretation reproducible
For the hypothetical lab budget, write the claim as a standalone line before any figure: “Personnel is 46 percent of the lab budget.” Put the whole and denominator beside the leading share rather than relying on a title or caption elsewhere.
Then retain the category values: personnel 46 percent, reagents 28 percent, equipment 18 percent, and travel and other 8 percent. The values total 100 percent, and personnel exceeds reagents by 18 percentage points. If you also report a relative comparison, state its base separately: “46 is about 64 percent higher than 28” uses reagents as the base, while the pie claim uses the whole budget as the base.
Record whether the percentages were printed on the chart or calculated from counts or degrees. When calculated from counts, preserve the numerator and denominator, such as 47 of 235, as well as the rounded percentage. If rounding changes a displayed slice by 0.1 point so the parts total 100.0, name the adjusted slice in the notes.
A useful figure note should still let a reader check the result if the image is removed. That means retaining the claim, the denominator, the category table, and enough arithmetic to reproduce any reported gap. Open methods pages in other fields, such as this rental data sourcing methodology, show the same discipline at a different scale: name the source, the rule, and the check. Researchers can also use PlotStudio AI's guide to research reproducibility.
When researchers use PlotStudio AI, each question produces a permanent analysis page with tables, charts, statistical tests, and interpretation in one structured document. Users can review how the data was transformed, inspect the generated Python if they want that level of detail, or read only the results; the narrator translates output into business language with explicit caveats and limitations. For a pie chart, the researcher still decides whether the categories form a meaningful whole and whether the written claim survives without the picture.
If you're preparing research figures, you can try PlotStudio AI through its academic page.