A model flags a patient as high risk, a customer as likely to churn, or an applicant as unlikely to repay. The immediate question is not only whether the prediction is accurate, but why it was made. Interpretable machine learning makes model behavior understandable enough to audit, challenge, and connect to decisions. With PlotStudio, agentic analytics adds a reproducible workflow around that interpretation, from planning and local Python execution to saved analysis.
Table of Contents
- Introduction to Interpretable Machine Learning
- What Interpretable Machine Learning Means and How It Works
- Core Techniques and Algorithms You Should Know
- How to Evaluate Interpretability With Confidence
- Trade Offs Between Accuracy Privacy and Transparency
- Real World Use Cases Failure Modes and Reproducible Patterns
- Best Practice Workflow for Auditable Publication Ready Analyses
Introduction to Interpretable Machine Learning
Suppose a churn model identifies a long-standing customer as likely to leave. The account manager asks which signals drove the result. A feature-attribution chart highlights recent support contacts, contract type, and product usage, but the team still needs to know whether those signals reflect a real business pattern, a data-quality problem, or a model shortcut.
Interpretable machine learning is the practice of understanding how a predictive model reaches its outputs and communicating that reasoning in a way people can inspect. It helps analysts examine model behavior, detect errors, compare cases, document limitations, and decide whether a prediction is suitable for a particular workflow. Interpretability doesn't automatically make a model trustworthy. It gives people evidence they can evaluate.
That distinction matters because an answer is a data point, while an analysis is actionable, reproducible intelligence. A chatbot can return a list of churn drivers. A defensible analysis should show the data used, the method selected, the assumptions applied, the validation performed, the caveats, and the code that produced the result.
PlotStudio is designed around that second pattern. It is agentic analytics for individual analysts and researchers, not an enterprise BI dashboard bot. You upload a dataset, and an AI data analyst autonomously plans the investigation, writes and runs real Python locally, checks its work, self-corrects when needed, and saves an Analysis Page containing narrative, charts, code, and statistics. Plan Mode lets you review or edit the proposed methodology before execution.
This guide treats interpretability as a decision-fit problem rather than a contest between SHAP and LIME. You'll learn how the main techniques work, how to test explanation quality, how privacy and transparency interact, and how to build publication-ready workflows that another analyst can reproduce.
What Interpretable Machine Learning Means and How It Works
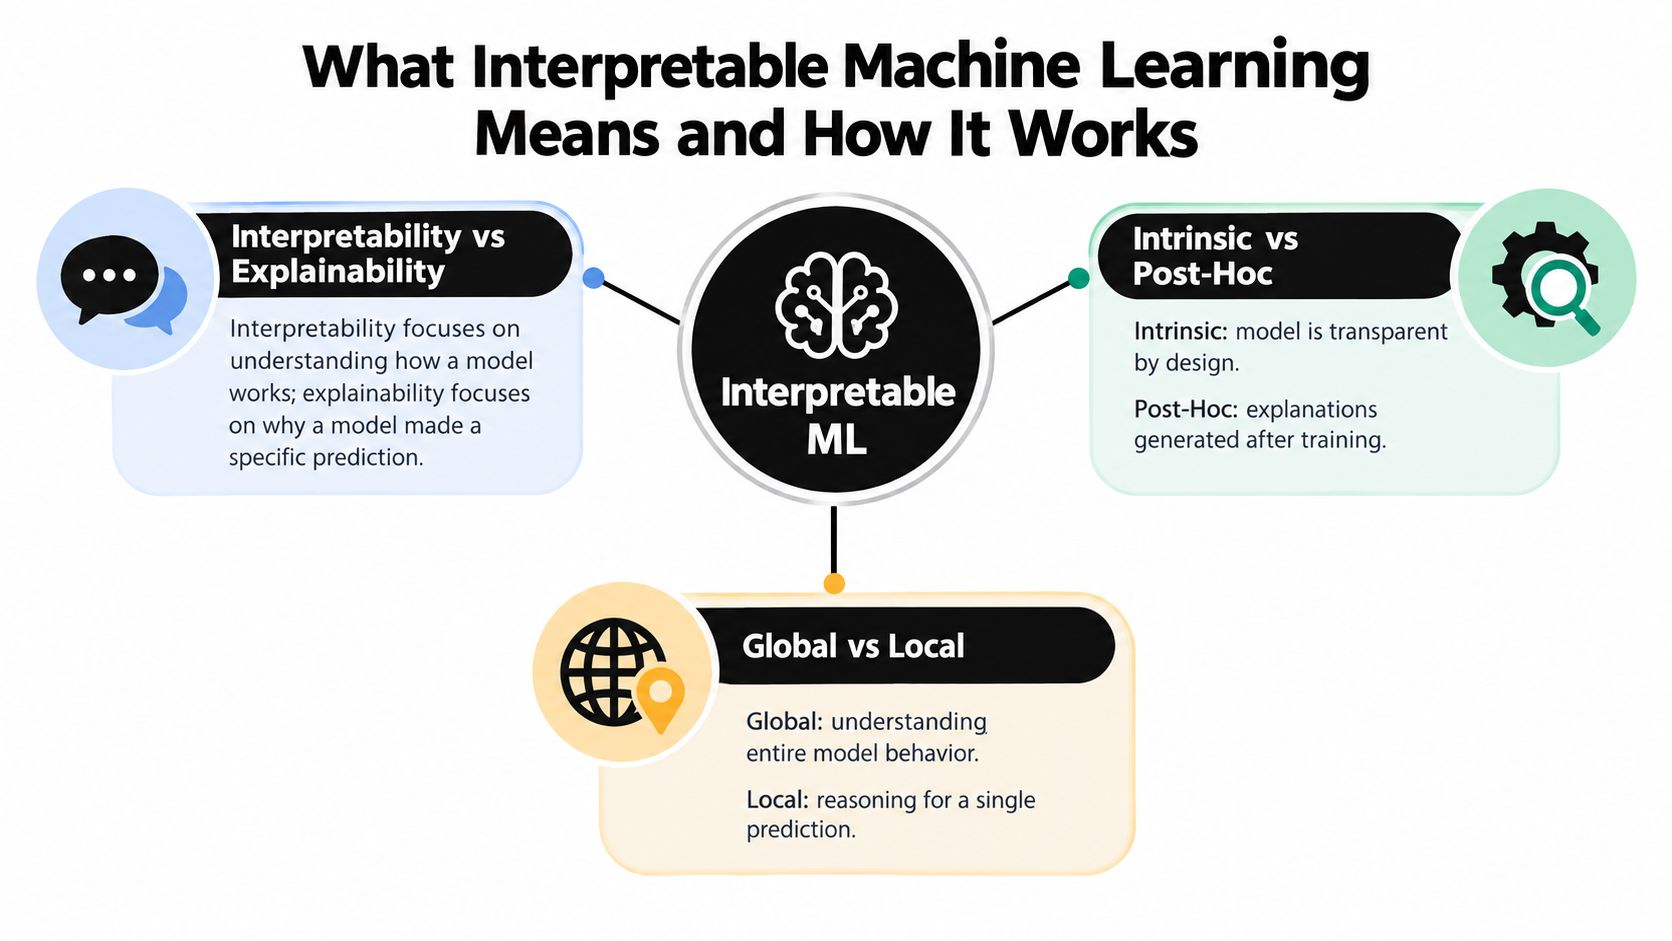
A useful starting point is to separate interpretability from explainability. Interpretability usually describes how understandable the model is by design. A short linear model with visible coefficients is interpretable because its structure can be inspected directly. Explainability often refers to methods that generate explanations for a model after training, especially when the underlying model is complex.
Core definition: Interpretability concerns the model or its behavior. Explainability concerns the evidence and representations used to make that behavior understandable.
Intrinsic and post-hoc approaches
An intrinsically interpretable model is transparent while it operates. Linear and logistic regression expose coefficient weights, while a decision tree exposes rule paths. Sparse models can restrict the number of active predictors, making the structure easier to communicate and review.
A post-hoc explanation is generated after fitting the model. The predictor might be a random forest, gradient-boosting model, neural network, or another complex system. The explanation method approximates, decomposes, or probes the trained model. It can be useful, but it isn't the same as opening the model and reading its actual decision process.
Global and local questions
Global interpretation asks, “How does this model behave across the population?” Feature importance, partial dependence, accumulated local effects, and interaction analyses belong here. They help you understand broad patterns, such as whether predicted churn generally rises as product usage falls.
Local interpretation asks, “Why did this model produce this prediction for this specific case?” A customer-level explanation, an individual patient record, or one loan application requires a local view. A global ranking can't reliably answer that question because an influential feature overall may have little effect for the selected row.
Model-specific and model-agnostic methods
Some methods depend on the model class. Coefficients are natural for regression, and rule paths are natural for trees. Model-agnostic methods treat the trained model as a function that receives inputs and returns predictions, allowing the same interpretability strategy to work across model families.
Transparency is also a spectrum rather than a binary label. A hybrid system may process some information through an interpretable component and the rest through a black-box component. A formal JMLR framework defines transparency in such systems as the percentage of data processed by the interpretable component, with transparency equal to 1 for a fully interpretable model and 0 for a black-box model (JMLR's formal framework).
The practical implication is simple. Choose an explanation based on the decision you need to support, not on the model name alone.
Core Techniques and Algorithms You Should Know
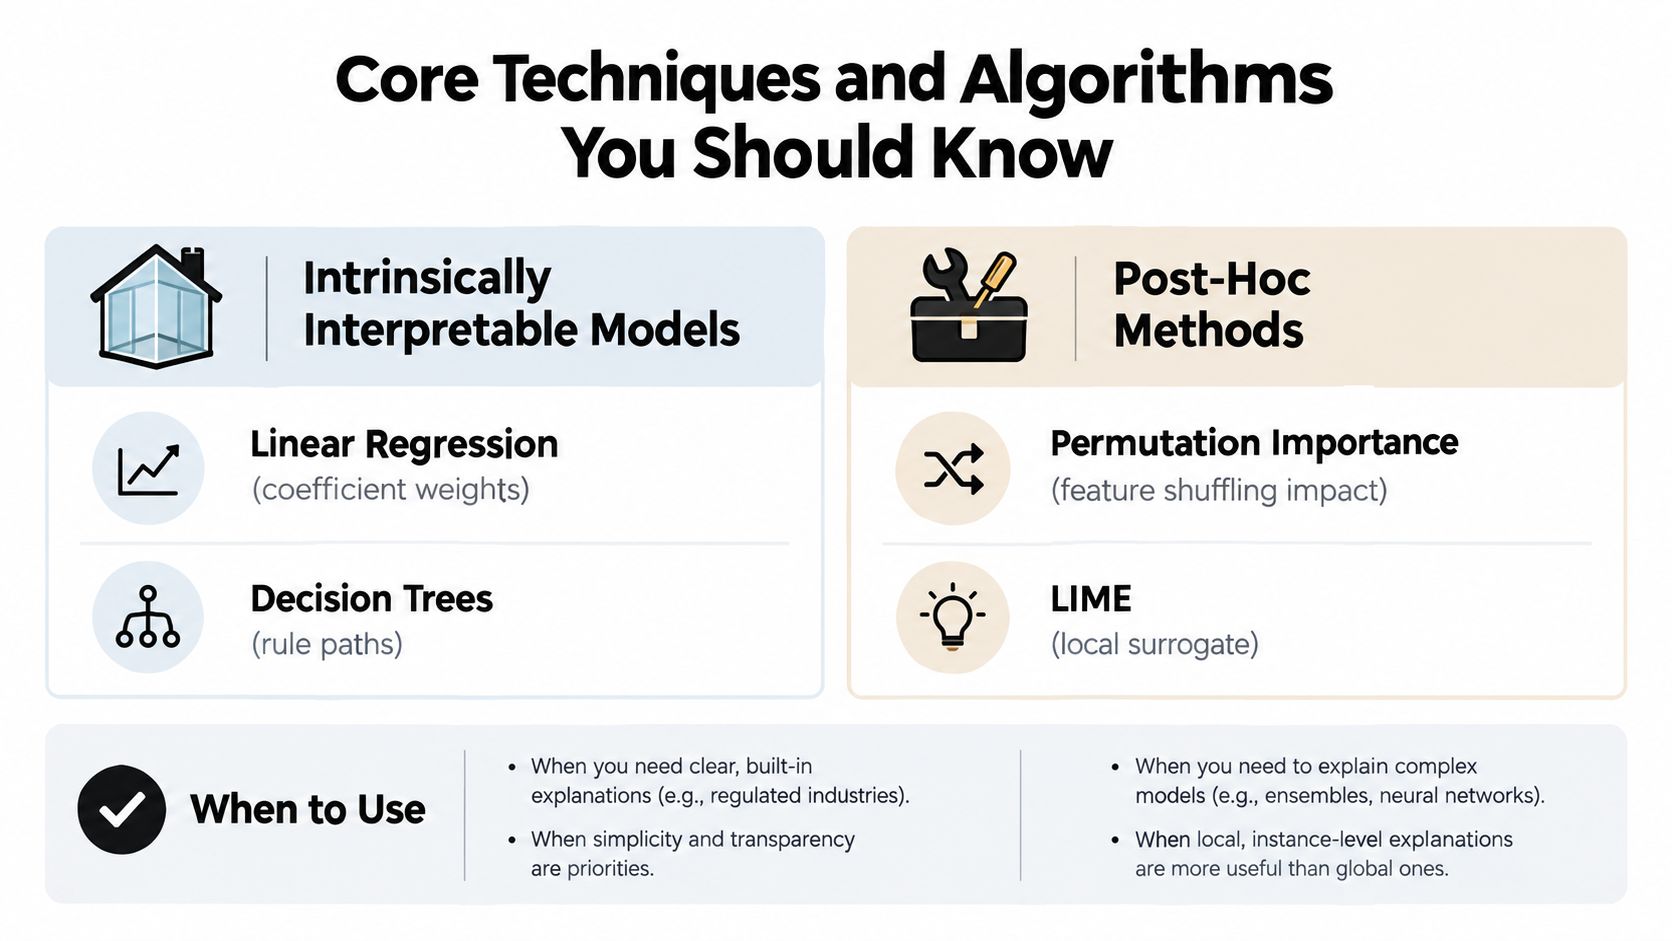
A model may predict accurately while offering an explanation that answers the wrong question. A coefficient describes a fitted relationship, permutation importance measures predictive reliance, LIME focuses on one case, and SHAP allocates contributions across features. These techniques are complementary, not interchangeable. Select the explanation that fits the decision, then record its inputs, assumptions, and version so another analyst can reproduce it.
Start with transparent models when the question allows it
A linear or logistic regression model exposes coefficient weights, but interpretation still requires care. Scaling, collinearity, interaction terms, regularization, and outcome encoding all affect what a coefficient means. A coefficient is not automatically a causal effect, and its sign does not show whether the model will perform well outside the observed sample.
Decision trees expose rule paths that stakeholders can inspect. Deep trees become difficult to audit, while a short tree may sacrifice predictive flexibility. Random forests provide built-in feature importance and helped establish an important direction in model interpretation. A review of interpretable machine learning notes that the original random forest paper had been cited over 60,000 times by September 2020 (Interpretable Machine Learning review). Treat that importance as a model diagnostic, not as proof that a feature causes the outcome.
Probe complex models with post-hoc methods
Permutation importance measures how much model performance changes after a feature's values are shuffled. It answers a predictive question, not a causal one. Correlated predictors can carry overlapping information, so shuffling one variable may understate the group's importance or create a misleading ranking. Use the evaluation metric and shuffling design that match the decision being supported.
Partial dependence shows the model's average prediction as a feature varies, subject to the method's assumptions. With strongly correlated features, the displayed values may represent unrealistic combinations. Individual conditional expectation curves retain row-level variation and can expose heterogeneous behavior hidden by an average curve. Accumulated local effects can offer a more defensible view when feature dependence makes partial dependence difficult to interpret.
LIME explains one prediction by fitting an interpretable surrogate model to perturbed samples around that instance (LIME method description). It suits a focused case review, but the result depends on how the neighborhood is generated, how features are perturbed, and how the surrogate is fitted. A local approximation can clarify one decision without describing the model beyond that neighborhood. Save the neighborhood settings and surrogate configuration if the explanation must be audited later.
SHAP uses Shapley values from cooperative game theory to assign feature contributions to an individual prediction. Shapley values originated with Lloyd Shapley in 1953, were proposed for explaining machine learning predictions by Štrumbelj and Kononenko in 2011 and again in 2014, and were generalized into SHAP by Lundberg and Lee in 2017 (historical account of SHAP). Its value is the additive framing, which connects Shapley-value reasoning with LIME-style local explanations.
SHAP is commonly described as satisfying local accuracy, missingness, and consistency (SHAP overview). Those properties do not remove practical caveats. Background distributions, correlated inputs, interactions, and the difference between association and causation still shape the result. For publication, report these choices rather than presenting an attribution plot as a complete explanation.
Counterfactuals ask what would need to change for a prediction to change, such as a different utilization level or an altered application characteristic. A proposed change should be feasible, ethically appropriate, and within the user's control. Rule-based explanations can be similarly accessible, but they may simplify model behavior too aggressively.
Choose by decision rather than fashion
| Technique | Scope | Best For | Watch Out For |
|---|---|---|---|
| Coefficients | Global, model-specific | Direction and magnitude within a transparent regression | Collinearity, scaling, interactions, causal overinterpretation |
| Decision-tree paths | Local and global | Communicating explicit rules | Excessive depth and unstable splits |
| Permutation importance | Global, model-agnostic | Comparing predictive reliance | Correlated predictors and metric dependence |
| Partial dependence or ALE | Global | Average feature-response patterns | Unrealistic feature combinations |
| LIME | Local, model-agnostic | Explaining one prediction | Neighborhood and perturbation sensitivity |
| SHAP | Local and aggregate | Additive feature contributions | Background choice, correlation, and attribution over-trust |
| Counterfactuals | Local | Action-oriented decisions | Feasibility and causal validity |
For broader model selection context, see this guide to machine learning model selection. A defensible workflow compares explanation methods against the decision task, tests their sensitivity, and preserves enough configuration to reproduce the published result.
How to Evaluate Interpretability With Confidence
An explanation can look polished and still be unreliable. Evaluation should test whether the explanation reflects the model, remains coherent under reasonable changes, and helps a person perform the intended task.
Test technical fidelity first
Fidelity asks whether the explanation accurately represents the model's behavior. For a local surrogate, compare the surrogate's outputs with the original model in the neighborhood it claims to explain. For feature attributions, inspect whether changing a highlighted feature changes the prediction in the expected direction, while keeping the comparison meaningful.
Consistency concerns similar inputs. If two records are nearly identical, radically different explanations require investigation. The difference might reflect a genuine decision boundary, an interaction, missingness, or an unstable explanation method.
Stability tests sensitivity to small perturbations. Refit the model where appropriate, vary random seeds, alter the background sample, or perturb inputs within a defensible range. An explanation that changes dramatically while the prediction remains nearly unchanged shouldn't be presented as a settled causal story.
Use train/test discipline for interpretation too. If you tune a model and evaluate its explanations on the same data without acknowledging that reuse, you can overstate generality. A held-out set can show whether the model's behavior and explanation patterns persist outside the fitting sample. Subgroup review is equally important, especially when the decision affects people with different geographies, demographics, or clinical profiles.
Add the human and workflow test
Technical criteria aren't enough. A recent survey describes a move toward a dual-track evaluation framework, pairing technical metrics with human-centered assessment, while identifying open challenges in durability, governance integration, and causal XAI (survey of recent interpretability directions).
Ask practical questions:
- Decision accuracy: Does the explanation help the reviewer identify the correct action?
- Error detection: Can a domain expert spot a data leak, implausible feature, or wrong label?
- Calibration: Does the explanation encourage appropriate skepticism rather than blanket acceptance?
- Actionability: Can the reviewer do something specific with the information?
- Workflow fit: Is the explanation available at the point where the decision is made?
A 2025 MIT study found no improvement in trust from interpretability, while outcome feedback had a significantly larger and more reliable effect (MIT study on interpretability and trust). The lesson isn't that explanations are useless. It is that explanation presence alone may not change behavior. Connect explanations to review checkpoints, feedback on outcomes, and explicit error-correction procedures.
For classification work, pair explanation checks with sound model evaluation. This practical guide to ROC curve interpretation can help keep threshold and discrimination discussions separate from explanation claims.
Trade Offs Between Accuracy Privacy and Transparency
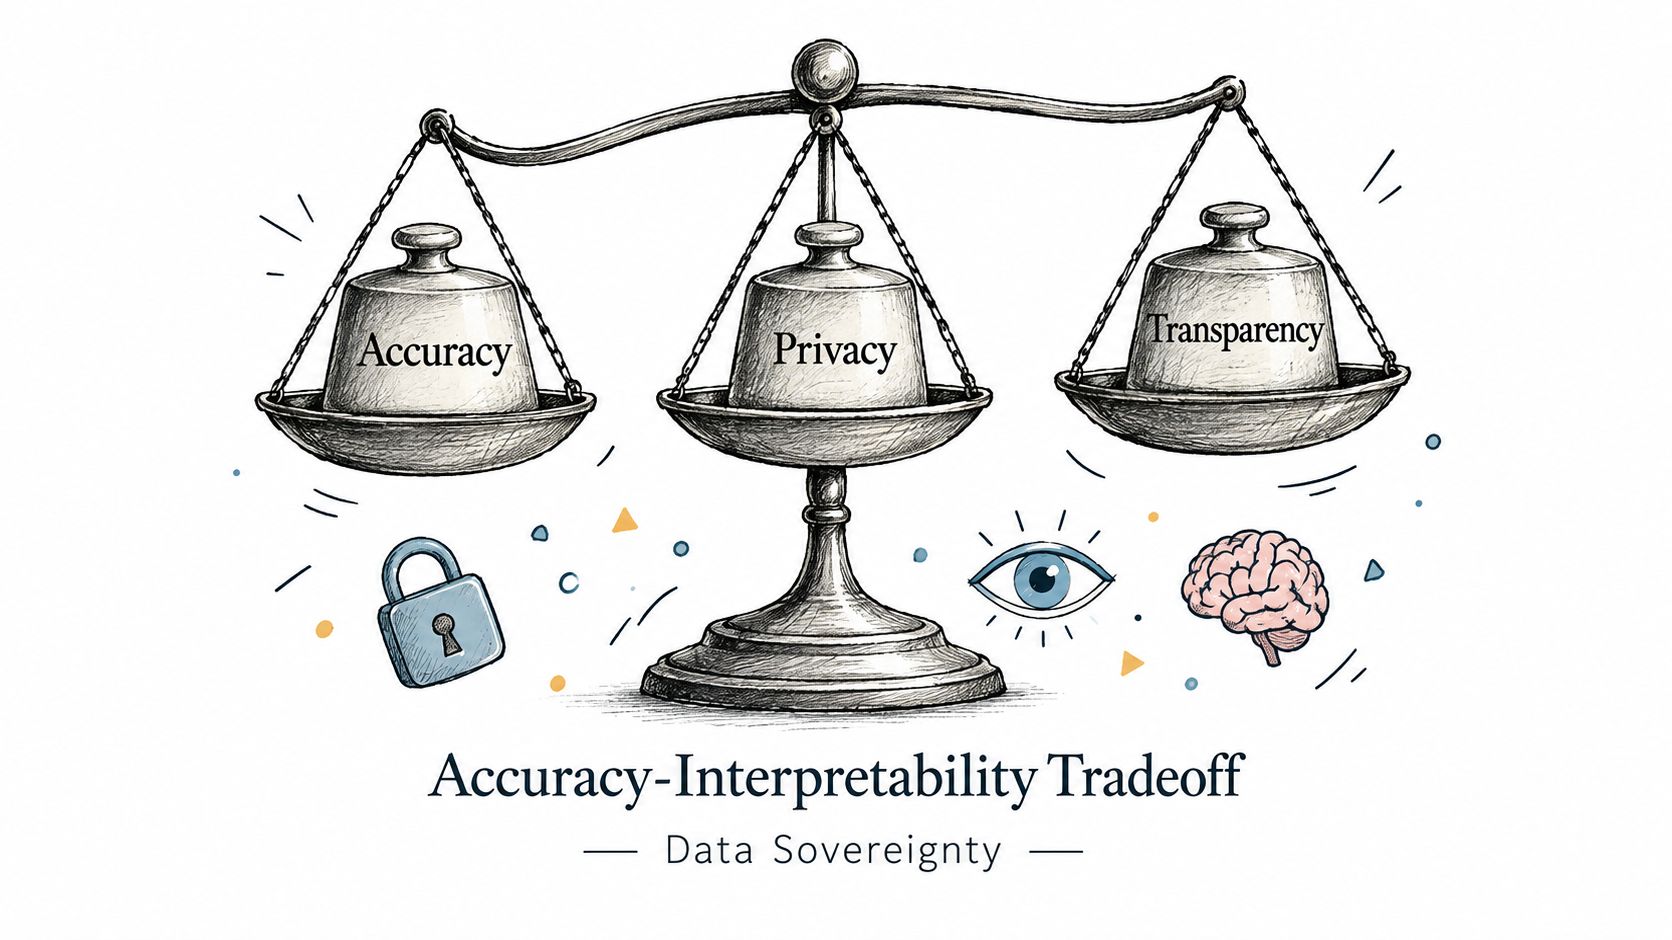
Interpretability decisions involve more than selecting a chart. A highly flexible model may capture patterns that a simple model misses, while a transparent model may be easier to challenge and govern. The right choice depends on the cost of errors, the availability of human review, the sensitivity of the data, and whether the explanation supports a real decision.
Accuracy isn't the only optimization target
A model's predictive score describes one aspect of performance. It doesn't tell you whether the features are appropriate, whether errors concentrate in a subgroup, or whether a reviewer can identify a faulty prediction. In high-stakes settings, a slightly less complex model may be preferable if its assumptions, failure modes, and review path are easier to document.
The opposite can also be true. A complex model may be justified when it materially improves the decision and the organization can validate, monitor, and govern it. Post-hoc explanations then become one layer of evidence, not a substitute for model documentation, threshold review, or outcome monitoring.
Privacy changes what transparency can mean
Explanations can expose sensitive information. A local explanation may reveal that a particular record contains a rare combination of attributes. A feature-importance report can disclose proxy variables, confidential business signals, or data relationships that shouldn't be broadly distributed.
Local execution changes the data boundary. PlotStudio runs generated Python in an embedded engine on the user's machine, so the dataset doesn't leave the machine. Its Analysis Pages preserve narrative, charts, code, and statistics for review, while users can export the work to Jupyter and PDF. For teams with different infrastructure requirements, deployment choices still need a careful security and access review.
Document the whole lifecycle
Model cards are short documents that accompany trained models and record intended use, evaluation procedures, limitations, and performance across relevant subgroups and intersectional groups such as race, sex, geography, or phenotype (Model Cards). Datasheets for datasets use structured questions to capture motivation, composition, collection process, and potential biases (Datasheets for Datasets).
Together, these artifacts turn transparency into an auditable practice. A data governance framework should connect them to ownership, access rules, retention, approval, and change management.
| Workflow | Typical output | Main limitation |
|---|---|---|
| Chat with your data | A response to one question | Results can be ephemeral and difficult to reconstruct |
| Traditional BI | Dashboards, warehouse queries, monitoring views | Strong for operational reporting, less suited to an individual research investigation |
| Agentic analytics | Planned investigation, executed code, validated outputs, saved analysis | Requires human review of methods, assumptions, and conclusions |
PlotStudio is positioned in the third category. It isn't an autonomous dashboard. It is a local, persistent workspace for analysts who need an investigation they can inspect and reuse.
Real World Use Cases Failure Modes and Reproducible Patterns
A churn analysis often begins with a simple request: identify the strongest drivers of cancellation. A responsible workflow first profiles missingness, checks the target definition, separates training and evaluation data, and looks for leakage. SHAP can then describe why selected accounts received high-risk predictions, while permutation importance can provide a broader view of predictive reliance.
The failure occurs when the analyst treats the largest attribution as the business cause. Support contacts may rise because a customer is already dissatisfied, or because a service issue affected many accounts. The model can identify a useful signal without establishing what intervention will reduce churn. Correlated variables can also split attribution in ways that make a ranking look more precise than it is.
An A/B test readout creates a different interpretability problem. A model may estimate heterogeneous treatment response, but a local explanation for one user shouldn't be treated as a reliable treatment effect without an appropriate causal design. Check the estimand, randomization, outcome window, missing data, and subgroup definition before translating a model explanation into product action.
Time series need temporal discipline
For time-series trends, random train/test splits can leak future information into training. Use a time-aware evaluation design, inspect residual patterns, and distinguish a model's predictive decomposition from a causal account of the underlying process. A feature may appear important because it tracks a shared seasonal or operational trend.
Interpretation can also become unstable near regime changes. Compare explanations across meaningful periods, not only across randomly selected rows. If a forecast changes after a policy or measurement change, document that context beside the plot rather than asking an attribution method to explain it away.
A reproducible PlotStudio pattern
In PlotStudio, the workflow starts with upload. The system profiles the dataset, evaluates data quality, flags missing values, and proposes cleaning actions. In Plan Mode, you can review the sequence, edit the question or methodology, and approve the investigation before Python runs locally.
The agent then writes and executes real Python, inspects outputs, and self-corrects when an operation fails. The resulting Analysis Page stores the narrative, charts, statistical tests, and generated code. You can export the work to a Jupyter notebook or PDF, giving collaborators an artifact they can inspect rather than a screenshot detached from its method.
Workspace insights and @-mentions make previous analyses referenceable. A later question can build on an earlier churn model, data-quality review, or subgroup analysis instead of forcing the team to reconstruct the context from a long chat. An independent review by The Effortless Academic describes PlotStudio as a purpose-built tool for research data work and discusses its use for data-quality evaluation, exploratory analysis, and publication figures.
The safeguard remains human judgment. Review the code, inspect the data transformations, challenge the explanation, and record what the model cannot establish.
Best Practice Workflow for Auditable Publication Ready Analyses
A publication-ready interpretability workflow should leave an evidence trail from raw data to conclusion.
- Profile the data. Record sources, units, missingness, duplicates, target construction, and potential leakage.
- Define the decision. State who will use the output, what action it supports, and which errors matter most.
- Choose the model and explanation together. Prefer intrinsic transparency when it meets the predictive and operational requirements. Otherwise, select post-hoc methods that match the global or local question.
- Validate predictions and explanations. Use appropriate train/test discipline, subgroup checks, perturbation tests, and sensitivity analyses.
- Separate association from causation. Feature attribution can describe model reliance, but it doesn't establish that changing a feature will change the outcome.
- Document limitations. Pair the analysis with model-card and dataset documentation, and preserve assumptions, exclusions, code, and versions.
- Save the result. A persistent page is more useful than an isolated chart. The principles of research reproducibility apply to exploratory work as well as formal publication.
Interpretable machine learning works best when explanations sit inside an auditable decision process. PlotStudio's agentic analytics workflow supports that process by combining Plan Mode, local Python execution, inspectable code, self-checking analysis, and persistent Analysis Pages. The analyst still decides what the result means and whether it is fit for use.
PlotStudio AI helps researchers turn sensitive datasets into planned, locally executed, reproducible analyses with inspectable Python, charts, statistics, and saved Analysis Pages. If you want to test an auditable interpretability workflow with your own research data, visit PlotStudio AI.