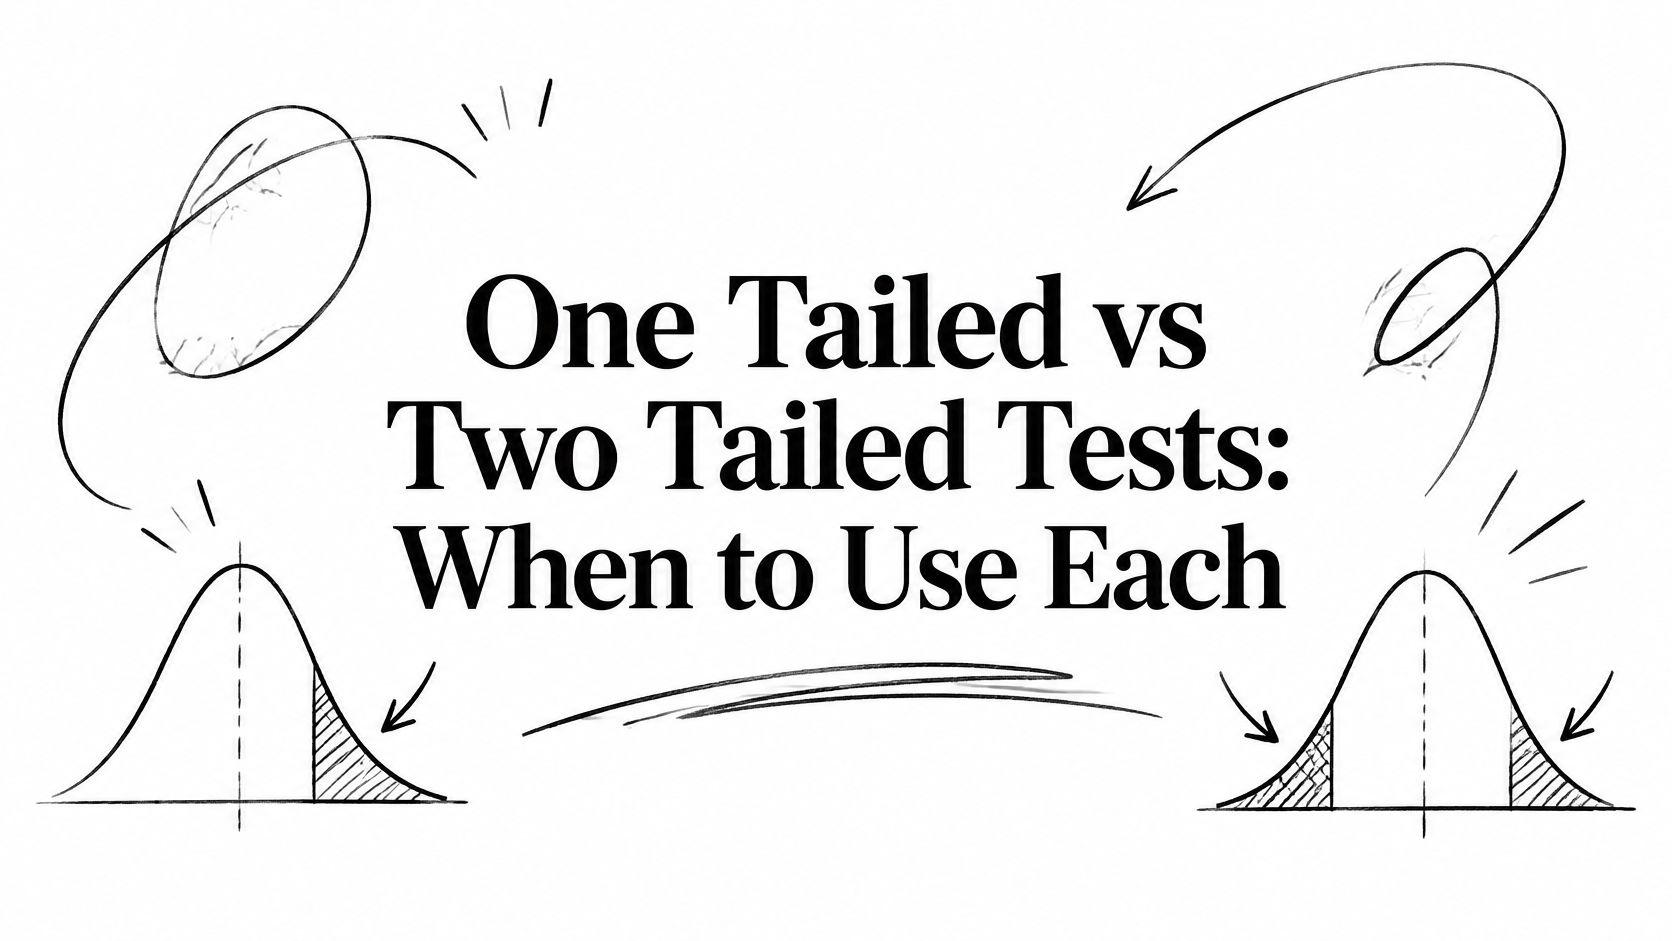
Choosing one tailed vs two tailed tests decides whether a result at the edge of 5% counts. A one-tailed test spends the whole error budget in one direction. A two-tailed test does not. UK guidance on clinical investigations says a one-sided test should use a stricter bar, such as 2.5% when the two-sided threshold is 5%, rather than treating a one-sided 5% test as the same standard. PlotStudio AI is an AI tool for researchers who need that commitment fixed inside research data analysis before any p-value is computed.
One-Tailed vs Two-Tailed Tests at a Glance
The operational split is the alternative hypothesis, not a software toggle. A one-tailed test evaluates a directional claim such as (H_A: \theta > \theta_0) or (H_A: \theta < \theta_0). A two-tailed test evaluates any departure, (H_A: \theta \ne \theta_0). At a conventional (\alpha = 0.05), the directional test places the entire Type I error budget in one tail. The two-sided test splits that budget equally. Wikipedia's treatment of the p-value is explicit that one-tailed testing is technically defensible only when an effect in the opposite direction would not lead to rejection or a different substantive conclusion. Otherwise the two-tailed test is the safer default, because it still sees unexpected effects on either side.
Newcastle University's numeracy notes set out the standard-normal cutoffs that follow.
| Significance level (α) | One-tailed critical z | Two-tailed critical z |
|---|---|---|
| 0.10 | 1.28 | ±1.645 |
| 0.05 | 1.645 | ±1.96 |
| 0.01 | 2.33 | ±2.58 |
How to read the smaller cutoff
The one-tailed critical value is the smaller number in each row. A smaller statistic can reach significance, but only in the direction you named in advance. At 10%, about 1.28 clears a one-tailed test, while a two-tailed test still needs about 1.645 in either direction. At 1%, the one-tailed bar is about 2.33 and the two-tailed bars are about 2.58 on each side. The lower bar isn't a free upgrade. You paid for it by discarding the other tail.
For symmetric test statistics, the two-tailed p-value is commonly twice the smaller one-sided tail probability, subject to the exact distribution and to discreteness. A result with one-sided (p = 0.03) in the prespecified direction corresponds approximately to two-sided (p = 0.06), which isn't significant at 0.05. That doubling is the check to run before you argue about wording.
Fix the tail with the question
The tail is a property of the research question, fixed before data collection. It isn't a setting to adjust after the coefficient shows up. In publication-oriented analyses, report the alternative, the tail allocation, the confidence-interval convention, and whether the direction was declared before looking at outcomes. A practical companion is a written statistical test selection note that sits next to the estimand, so the tail isn't rediscovered at the keyboard.
How Tail Choice Changes Critical Regions and p-Values
The critical region is the set of statistic values that lead to rejection. Under a right-tailed test at (\alpha = 0.05), that set is (z > 1.645). Under a two-tailed test at the same alpha, it is (z < -1.96) or (z > 1.96). UCLA's statistical computing guidance walks through the consequence with a single number. A test statistic of (z = 1.80) is statistically significant at the 5% level under a pre-specified right-tailed test, and it isn't under a two-tailed test. The one-tailed design put the entire 5% Type I error budget in one direction. The two-tailed design allocated 2.5% to each tail, so 1.80 sits in the gap between 1.645 and 1.96.
That gap is the whole argument about one tailed vs two tailed arithmetic. The statistic didn't change. The rejection region did.
| Observed z | Significant at 0.05 (one-tailed / two-tailed) |
|---|---|
| 1.80 | Yes / No |
| 2.33 | Yes / Yes |
Same statistic, two p-values
Both designs share one decision rule. Reject the null when the p-value is smaller than (\alpha). Fail to reject it otherwise. What changes is how extremeness is measured. For an upper-tail normal probability, (z = 1.80) has a one-sided tail probability of about 0.036. On a symmetric null, the two-sided p-value is about twice that, near 0.072. The first is below 0.05. The second isn't. At (z = 2.33), the upper-tail probability is about 0.010 and the two-sided value is about 0.020, so both designs reject at 0.05. A third point, (z = 1.70), is the same pattern in miniature. About 0.045 one-sided, about 0.089 two-sided, significant only if the right tail was the plan.
Doubling holds for a symmetric null, such as the standard normal and, approximately, a large-sample t. It isn't a licence to halve a p-value from a skewed or discrete test and call the result two-sided.
Recompute both tails before you interpret
In a spreadsheet, use the standard-normal survival function on the observed z for the upper tail, then double it when the null is symmetric and the estimate has the predicted sign. In Python, scipy.stats.norm.sf(z) is the upper-tail p-value, and 2 * min(norm.cdf(z), norm.sf(z)) is the two-sided value. Run both on the same z and write both down. If they disagree about 0.05, the disagreement is the design, not a rounding error. Direction has to be established before the statistic is computed. Switching from two-tailed to one-tailed after seeing the result inflates the apparent evidential strength, which is why a failed two-sided test can't be rescued by relabeling. A short note on p-value interpretation belongs in the same lab notebook entry as those two numbers.
Choosing a Tail Before You Look at the Data
Three questions settle the tail, and they have to be answered before the file is opened. Would an effect in the opposite direction change a decision? Is the direction fixed by theory or by a protocol written before data collection? Is this analysis confirmatory, or is it exploratory? If the opposite direction would change what you do, a one-tailed test throws away the evidence you would have acted on. If the direction was invented to match the estimate, the test isn't confirmatory at all.
The hard case is asymmetric consequences. In medicine, safety monitoring, policy, and product experiments, an unexpected harmful effect can matter more than the benefit you hoped to show. A one-tailed test aimed at benefit has no rejection region for that harm. Basic textbook advice still says directional hypotheses "get" a one-tailed test. That advice understates the cost. A significant result in the reverse direction isn't treated as evidence under the pre-specified one-tailed framework, even when that reverse result is the finding a clinician or a product owner needed.
| Situation | Tail | Reason |
|---|---|---|
| Defect rate must stay below a fixed ceiling | One-tailed (upper) | Only exceedance triggers action |
| New treatment against standard care | Two-tailed | Unexpected harm matters as much as benefit |
| Safety endpoint in a clinical trial | Two-tailed | Opposite-direction harm must remain detectable |
| Pilot with theory-driven direction and no action if reversed | One-tailed, only if preregistered | Reversed result would not change the decision |
| Exploratory analysis across many outcomes | Two-tailed | Direction unknown and multiplicity already inflates error |
| Direction chosen after seeing p = 0.08 | Not valid | Switching raises Type I error from 5% to 10% |
Where the rule breaks in practice
A manufacturing limit is the clean one-tailed case. You act only if the defect rate exceeds the ceiling, the way a process check flags exceedance and ignores a pleasantly low rate. A new treatment against standard care isn't that case. Benefit and unexpected harm both change the decision, so the alternative is two-sided. The same holds for a safety endpoint. A theory-driven pilot can be one-tailed only when the reverse result would not support a different action, and only when that sentence was written down first.
Exploratory scans across many outcomes fail the test twice. Direction wasn't known, and multiplicity has already spent error rate. Choosing the tail after a two-sided p sits at 0.08 fails it outright.
A review of preregistration and Registered Reports describes that habit, watching a p-value such as 0.08 and then changing to a one-sided test to obtain (p < 0.05). The review reports that opportunistically switching can increase the long-run Type I error rate from 5% to 10%. The apparent power advantage isn't a free gain once the direction is chosen after the data. The decision rule, the alternative, and the primary outcome should be documented before analysis, ideally in a preregistration or a registered report. If the direction wasn't pre-specified, report a two-sided confidence interval and treat any one-sided result as exploratory rather than confirmatory. A failed two-sided test can't be rescued by relabeling it one-tailed because the estimate points the way you hoped.
Product experiments trip the same wire. Variants underperform, and a one-tailed test pointed only at "improvement" can ship a harmful change. A/B experiment best practices are worth reading beside the protocol, because sample size, duration, and a pre-committed tail do more for a decision than a last-minute change of alternative.
Power and Sample Size Under Each Tail
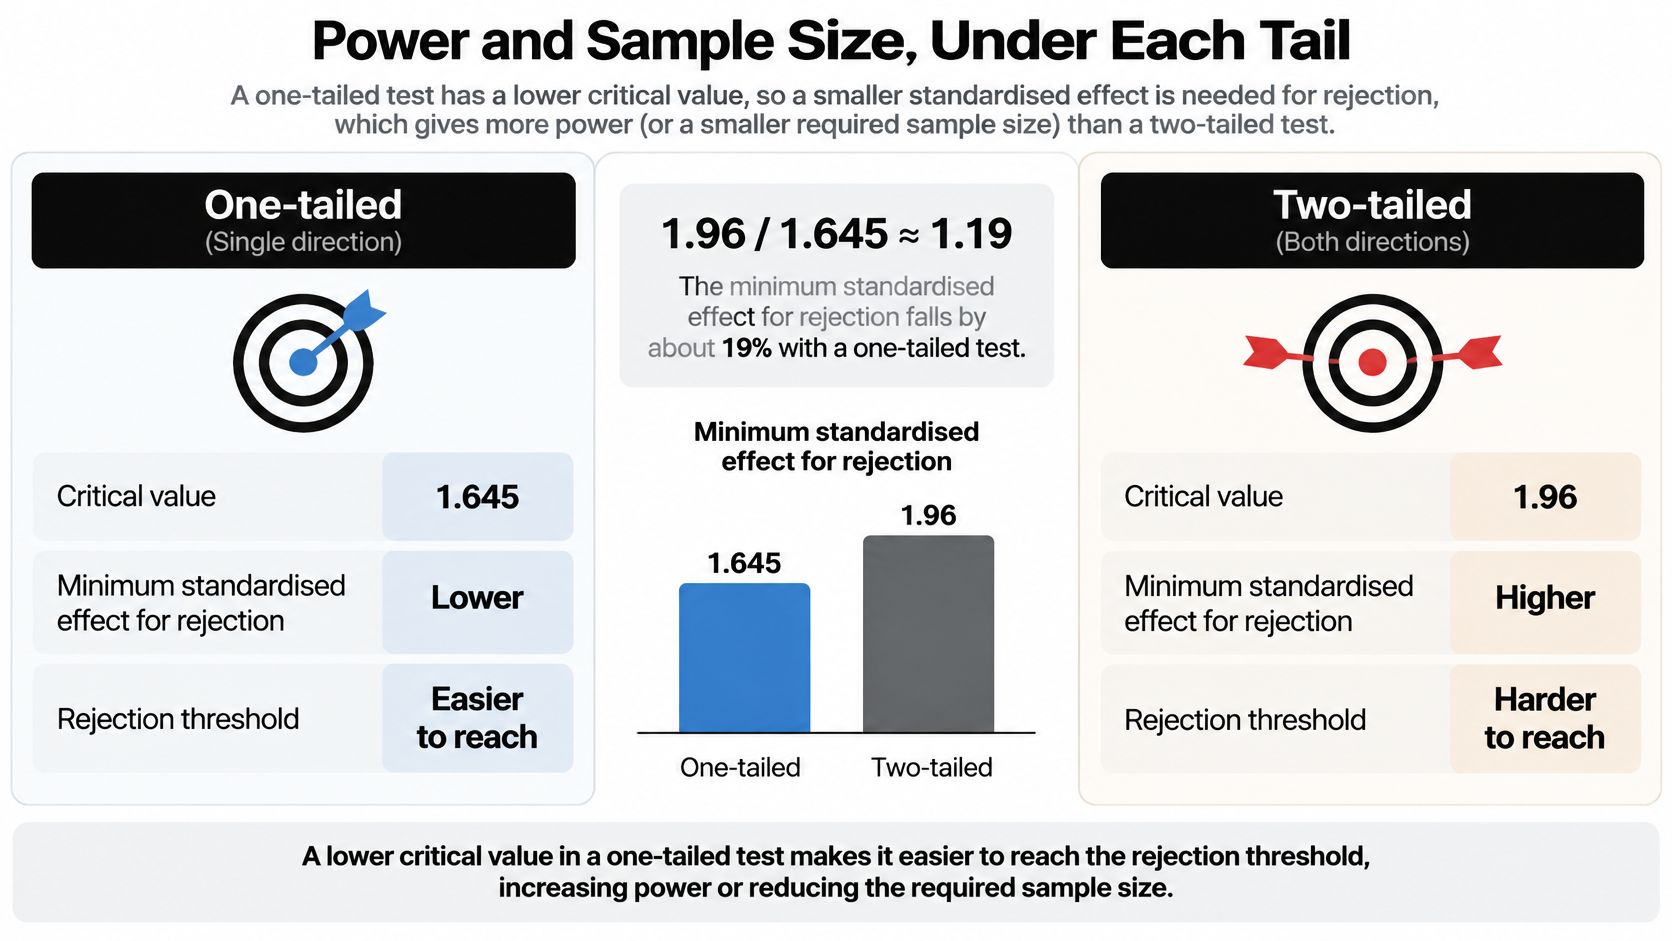
At (\alpha = 0.05), a one-tailed normal test has a critical value of 1.645; a two-tailed test has cutoffs of (\pm 1.96). The ratio (1.96 / 1.645 \approx 1.19), so the two-tailed cutoff is about 19% larger. For the same sample size, variance, and effect size, a one-tailed test has greater power when the true effect is in its prespecified direction. The same target power will generally require fewer observations. That gain applies only in the chosen direction: an effect in the opposite direction falls outside the one-tailed rejection region.
A worked two-sample calculation
Suppose a study targets 80% power to detect a standardised mean difference of (d = 0.5), with two equal-sized groups and (\alpha = 0.05). A normal approximation for the sample size per group is (n = 2(z_\alpha + z_\beta)^2 / d^2), where (z_\beta \approx 0.84) for 80% power.
| Design | Critical z (α = 0.05) | Approx. n per group |
|---|---|---|
| Two-tailed | 1.96 | 63 |
| One-tailed | 1.645 | 50 |
Using the two-tailed critical value gives about 63 participants per group; using 1.645 gives about 50. Exact two-sample t calculations are slightly higher, about 64 and 51, because the finite-sample t critical value exceeds the normal cutoff and the noncentral t power curve is slightly less generous than the normal approximation. The approximate difference is 13 participants per group. It quantifies the cost of the two-tailed design for this specified effect and power target, not a reason to choose a tail after seeing results.
What to record in the power software
In G*Power, set the test family, tails, (\alpha), target power, and (d), then save the settings with the tails field visible. In statsmodels, TTestIndPower or NormalIndPower accepts alternative as 'two-sided', 'larger', or 'smaller'. Record that choice alongside the estimand, alpha, and power target in the analysis plan. A power analysis software comparison can help identify a tool for making and documenting these design choices. Check that the recorded alternative matches the hypothesis symbols before examining outcomes.
Z-Test and t-Test in Python
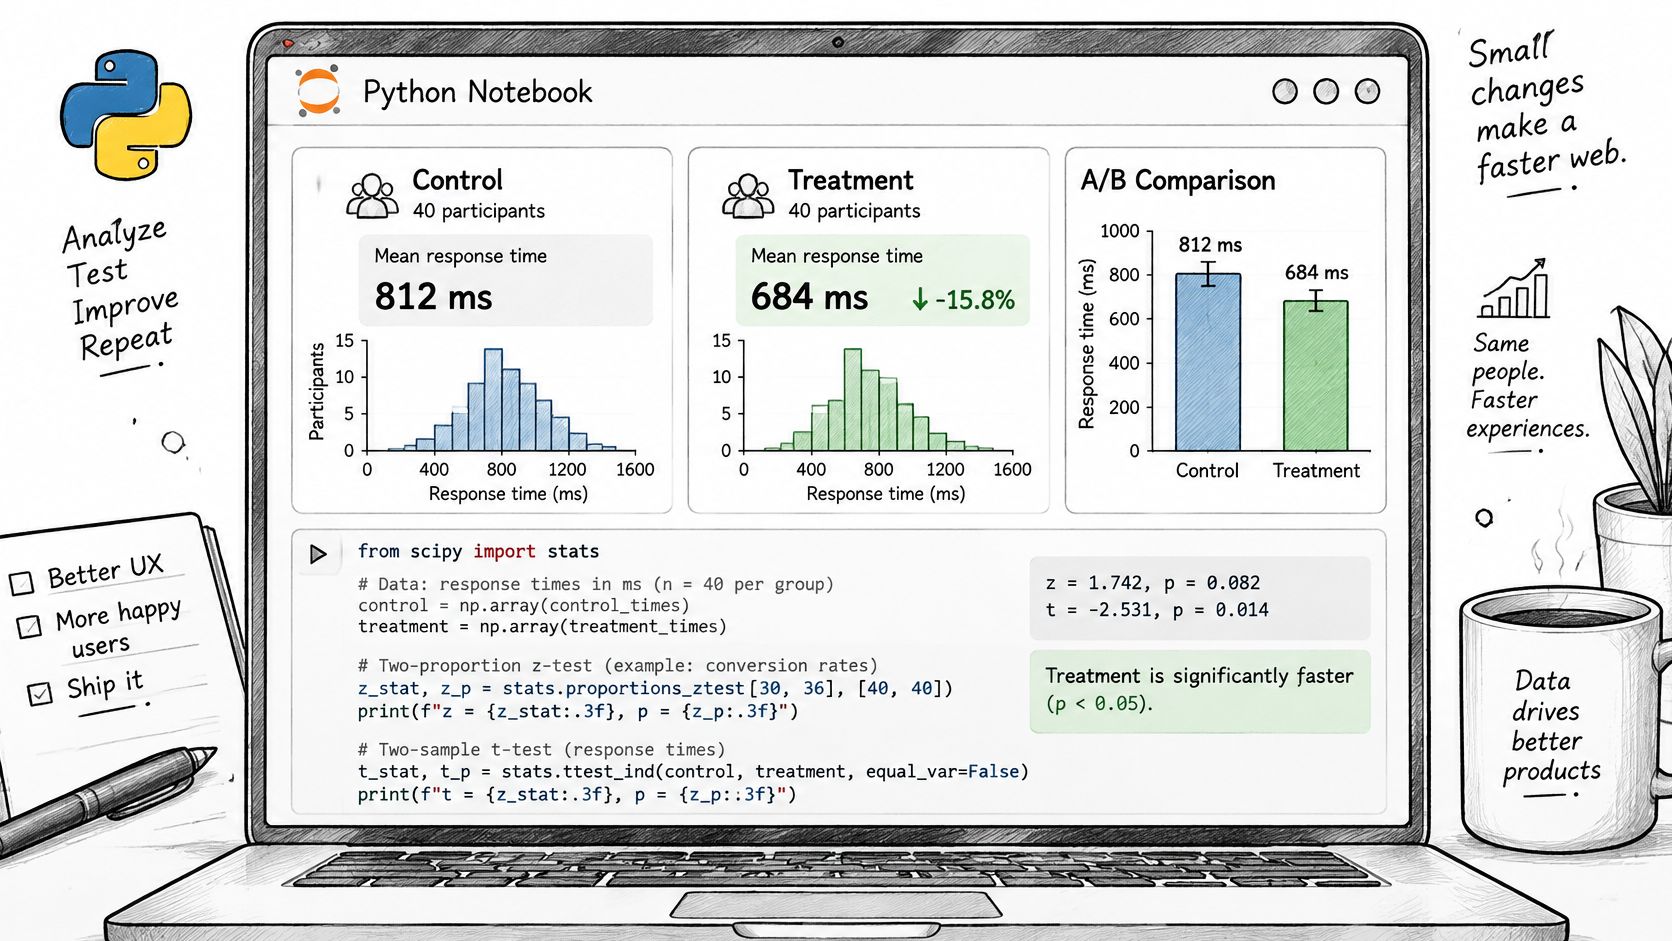
A concrete case is response time in milliseconds, 40 participants on a control interface and 40 on a treatment interface, with the hypothesis that treatment times are smaller. The sign is part of the plan. If you believe treatment is faster, the alternative is 'smaller' on the treatment-minus-control difference, not whichever side the means happen to fall.
Run the two alternatives on the same arrays
Work in this order, and don't edit alternative after you like a p-value.
- Load the two columns with pandas. Keep the raw frame untouched and work on a copy.
- Print group means, standard deviations, and n. Then print the mean difference and a 95% two-sided confidence interval from
statsmodels.stats.api.CompareMeansor fromscipy.stats.ttest_ind(..., alternative='two-sided').confidence_interval(). The interval stays two-sided even when the test you care about is one-sided, so a reader can still see plausible harm. - Call
statsmodels.stats.weightstats.ztest(treatment, control, alternative='smaller'), then the same call withalternative='two-sided'. The z statistic is identical. The p-values aren't. - Repeat with
scipy.stats.ttest_ind(treatment, control, equal_var=False, alternative='smaller')and again with'two-sided'. Welch's t is the safer default when you haven't shown equal variances.
For a symmetric statistic and an effect in the predicted direction, the one-tailed p-value is about half the two-tailed p-value. If your printout doesn't show that relationship, the arrays are ordered backwards or the alternative string doesn't match the sign you claimed. PlotStudio AI can return this as an Analysis Page with the generated Python and a textual description of each transformation, so you can check the alternative argument instead of trusting a single printed p-value. That is agentic analytics in the narrow sense that matters here. An agent plans the test, runs real code, and leaves the tail visible. An answer is an output. An analysis is an investigation you can rerun.
When the sign goes the wrong way
If the observed difference points opposite the alternative, the one-tailed p-value moves toward 1 and the test isn't significant. That is correct behaviour, not a bug in scipy. The one-tailed test refused to treat evidence for harm, or for a slower interface, as evidence for a faster one. The two-sided call on the same arrays can still be small. Leaving both printouts in the notebook is how you show you didn't hide that.
A useful figure is a density plot of the null, one panel per design, with the critical region shaded. Shade only the lower tail for the 'smaller' z test. Shade both tails, each at (\alpha/2), for the two-sided test. Mark the observed z on both panels. Readers see immediately whether the statistic landed in a region you still have.
The same alternative strings belong in a two-sample t-test write-up, next to degrees of freedom and the interval. If you export the notebook, the reviewer should be able to change nothing except the random seed and recover both p-values.
Frequently Asked Questions
Is a one-tailed test cheating?
It is valid when the direction and the tail were fixed before anyone examined the data, and when a result in the opposite direction wouldn't change the conclusion. It is invalid when the tail is chosen after the estimate or the p-value is known. Validity sits in the timing, not in the word "one-tailed."
Does the choice of tail change the test statistic?
No. The z or t statistic is the same under both designs. What changes is the rejection region and, with it, the p-value. If two write-ups quote different statistics, they didn't merely change the tail. They changed the model, the sample, or the contrast.
Which argument sets the tail in Python?
In scipy.stats.ttest_ind and in statsmodels ztest, alternative takes 'two-sided', 'larger', or 'smaller'. That string belongs in the analysis plan. 'larger' means the first sample is hypothesised to exceed the second, so argument order is part of the hypothesis.
Does a one-sided confidence interval replace a one-tailed test?
A one-sided 95% bound matches a one-tailed test at (\alpha = 0.05). A two-sided 95% interval matches a two-tailed test. Reporting one interval type while claiming the other test is a common mismatch. If the paper's claim is one-sided, the bound should be one-sided too, and the methods should say so.
Reporting and Pre-Specifying the Tail
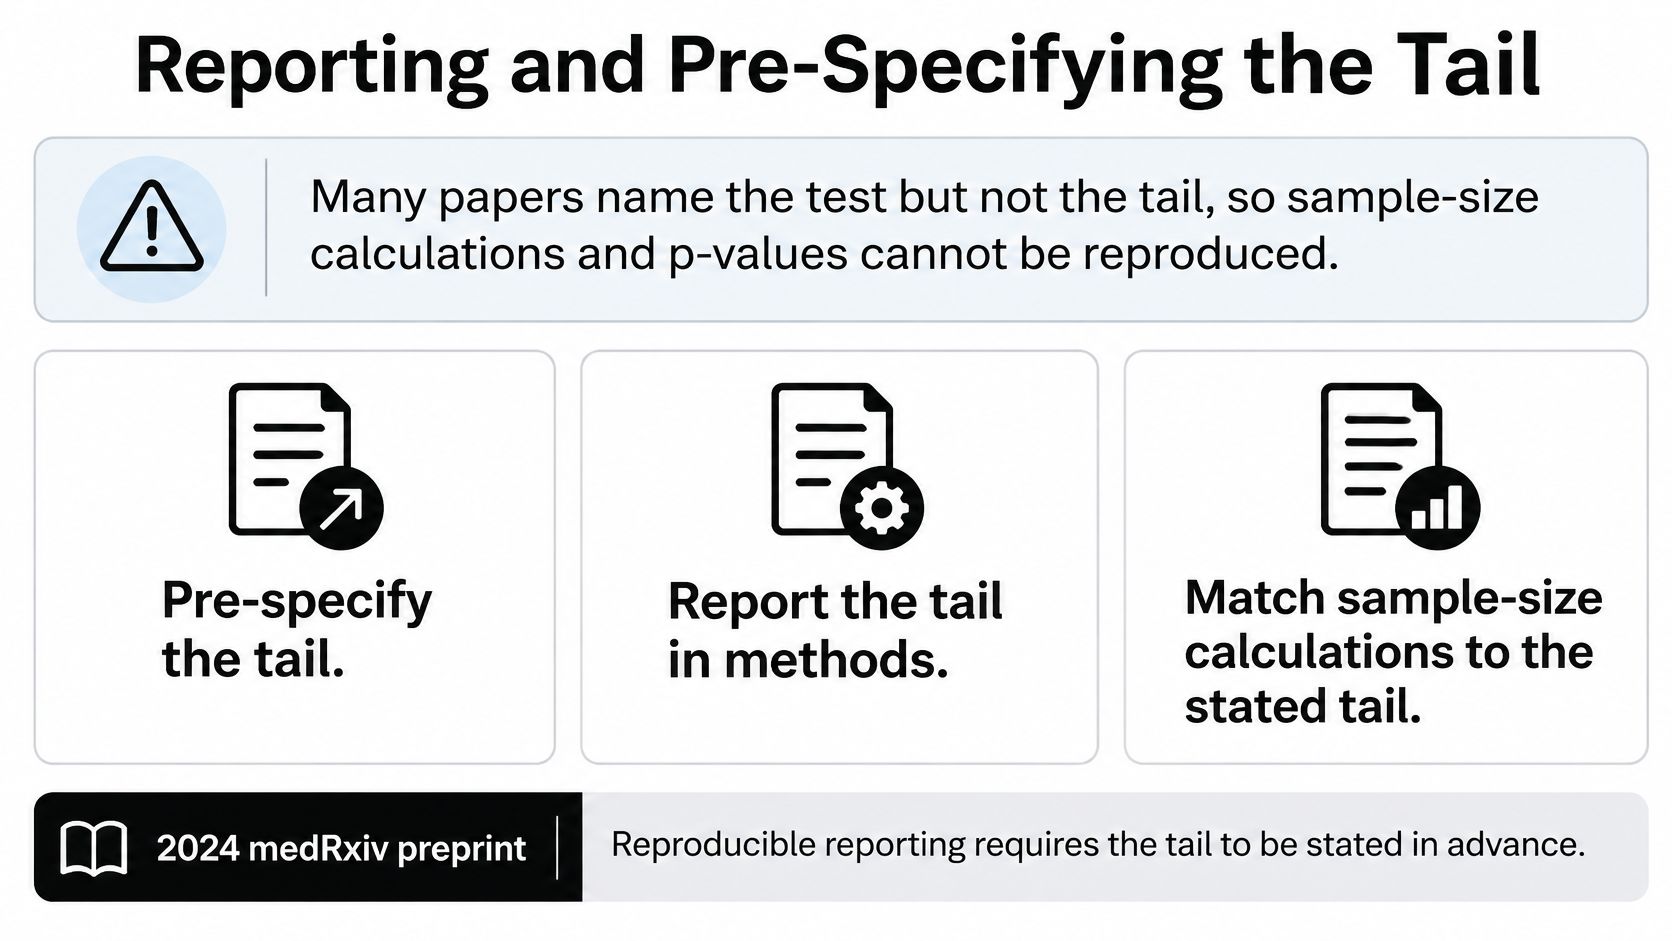
The same test statistic can cross the significance threshold under a one-tailed test and miss it under a two-tailed test. Switching tails after seeing the result also changes the false-positive risk: choosing whichever direction makes the result significant can raise a nominal 5% Type I error rate to 10%. Treat the tail as a pre-data commitment, not a reporting choice.
A 2024 medRxiv preprint notes that reproducible sample-size calculations require authors to report the number of tails. Its example specifies a two-tailed paired-sample t-test and an assumed correlation of 0.5. Without those details, “we powered at 80%” does not identify the design.
What the methods section should contain
Use this checklist in the paper's methods section, rather than leaving key choices in an unreferenced supplement.
- State the alternative hypothesis in symbols, so readers can distinguish
>,<, and (\ne). - Report the tail and (\alpha) together. Alpha alone does not specify the rejection region.
- Say whether the direction was set before data inspection, and identify the preregistration or protocol that records it.
- Report the test statistic and exact p-value, not only a threshold such as (p < 0.05).
- Give the confidence interval that matches the test. If you report a one-sided bound, identify it as such.
- Report the effect size and its interval, so readers can assess the magnitude as well as statistical significance.
- Describe the sample-size calculation, including the number of tails, target power, and assumed correlation or variance.
- For resampling analyses or software defaults that may affect the p-value, report the random seed and library versions.
- If useful, show how the conclusion changes under the alternative tail, making clear that this is a sensitivity analysis, not a replacement for the pre-specified test.
A pre-analysis routine
Before opening the outcome file, write down the hypothesis and its direction, identify which outcome reversals would change the decision, choose the tail and alpha, and calculate the required sample size under that design. Record the plan in a preregistration or registered report.
PlotStudio AI provides generated code and a textual description of each analysis step. Its Plan Mode lets users review the analysis plan before execution, including the proposed tail. Put the tail in the plan, run the test, and keep the code.