The predictive analytics market is projected at USD 27.56 billion in 2026, with one estimate reaching USD 116.65 billion by 2034 (Fortune Business Insights). That growth matters only when forecasts change decisions. Predictive analytics for business should connect data to a defined action, whether that means reallocating budget, adjusting inventory, scheduling maintenance, changing a credit limit, or escalating risk.
What Predictive Analytics Means in a Business Context
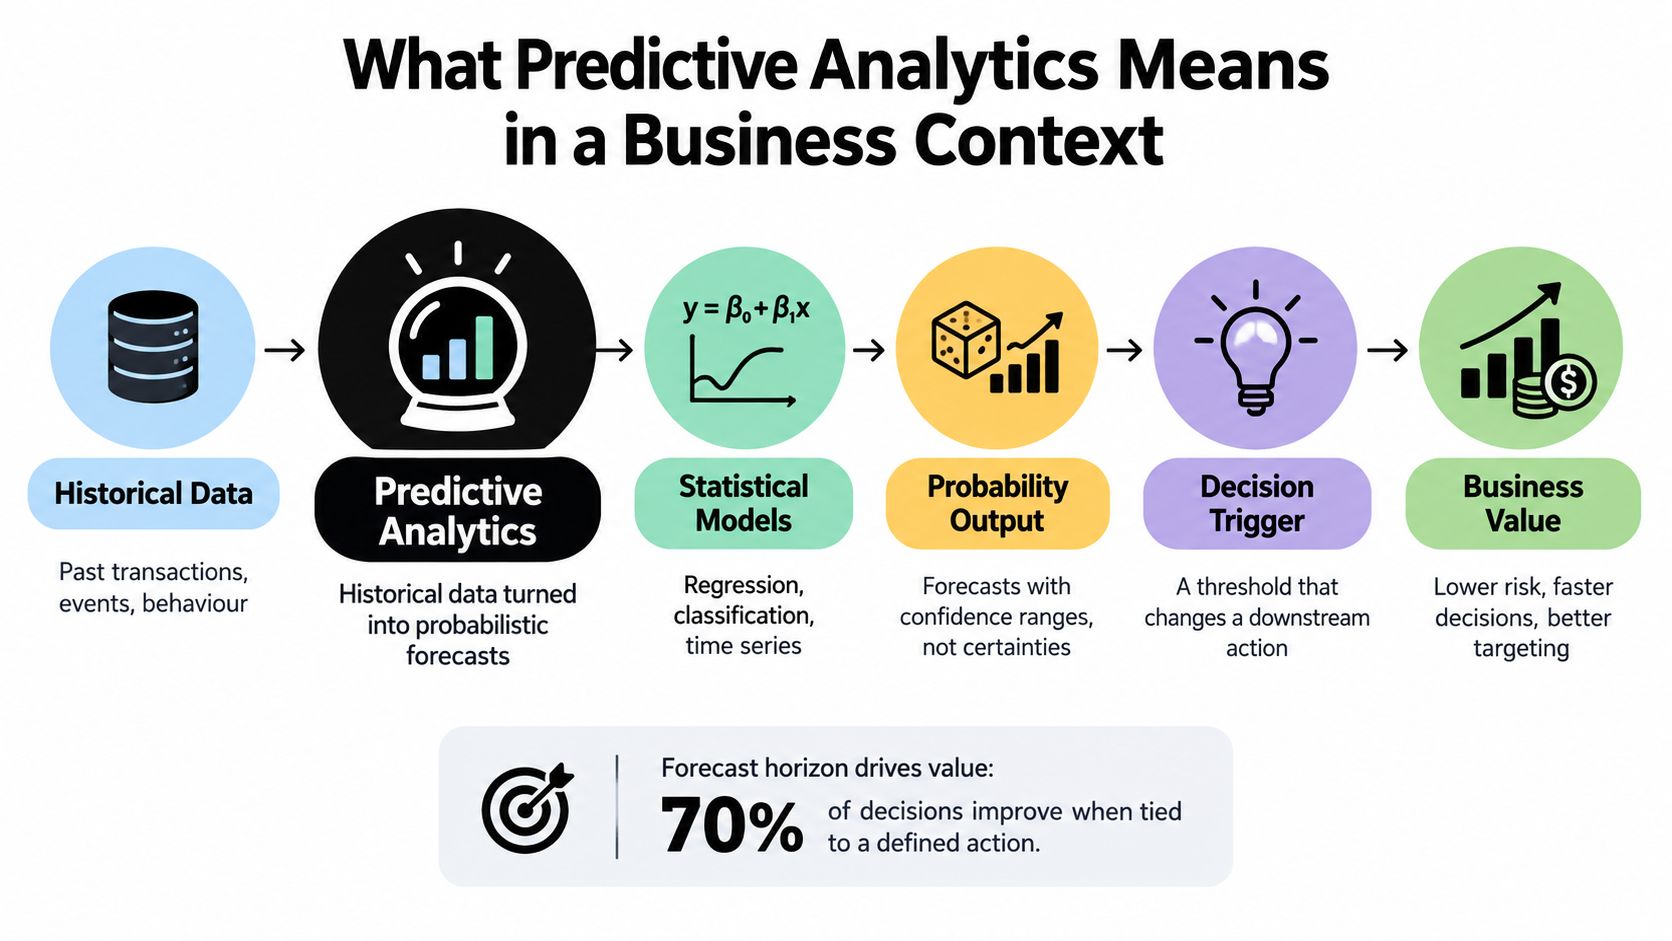
Predictive analytics converts historical and behavioural data into a probability-based view of what may happen next. It can estimate customer churn, demand, lead conversion, equipment failure, cash flow, or credit risk, but it doesn't produce certainty. The useful output is a forecast that is reliable enough, timely enough, and interpretable enough to change a downstream decision.
The discipline has older roots than modern machine learning. Early predictive methods were used during World War II, and commercial adoption became more formalized by the late 1950s, when Fair Isaac Corporation began applying statistical models to lending risk (EBSCO). Since then, predictive methods have spread through marketing, finance, operations, risk, and other functions as data volumes and computing capacity expanded.
Prediction is not reporting or optimisation
Descriptive analytics answers what happened. A revenue dashboard, monthly report, or inventory summary belongs here. Predictive analytics asks what is likely to happen, using statistical models, machine learning, and historical patterns. Prescriptive analytics goes further by recommending what should happen, often through optimisation, simulation, or rules.
The boundaries matter because many teams label a dashboard “predictive” when it only displays trends. A line chart showing declining sales doesn't predict next quarter's revenue. A churn score becomes predictive when it estimates the probability of a future cancellation, and it becomes operational when the retention team has a threshold, an assigned owner, and an approved intervention.
Practical rule: A forecast without a decision threshold is an observation with extra decoration.
Use the forecast-to-action test
Every proposed model should pass four questions:
- What event or value is being predicted?
- When must the forecast arrive to matter?
- Who owns the resulting decision?
- What action changes at a defined threshold?
For example, a demand forecast might trigger a purchase order, while a failure forecast might move a machine into a preventive maintenance queue. The forecast horizon determines whether the business has time to act. A technically strong model that arrives after the purchasing window, staffing deadline, or risk review has little practical value.
The same test should govern tool selection. An AI tool for research or business analysis needs to expose the methodology, intermediate outputs, and assumptions rather than returning an unexplained number. PlotStudio AI's business intelligence platform is one example of a workflow built around structured analysis rather than a single conversational answer.
Core Techniques Every Business Analyst Should Recognise
Technique choice starts with the question structure, not algorithm fashion. Ask whether the outcome is continuous, categorical, time-to-event, volatile, repeated across entities, or potentially confounded. Then select a method whose assumptions match the data-generating process and the decision at hand.
Regression estimates a continuous outcome such as revenue, demand, cost, or delivery time. Classification assigns a category or probability, such as churn, fraud, approval, or default. Time-series models account for temporal order, seasonality, trends, and autocorrelation. ARIMA and Prophet are familiar choices for recurring forecasts, but a seasonal baseline may be a more honest comparator than a complex model.
Survival analysis estimates time until an event, while accounting for censored observations. It fits questions such as how long a customer remains active or when a machine may fail. GARCH models conditional volatility, making them relevant to financial risk and changing variance rather than ordinary point prediction.
Causal questions need a different discipline. Statistical instruments and two-stage least squares can help estimate an effect when treatment is confounded, but the instrument must satisfy strong relevance and exclusion assumptions. Fixed-effects models are useful for panel data with repeated observations across firms, customers, locations, or other units, especially when stable unobserved differences need to be controlled.
A practical AI for research workflow should make these choices visible. Researchers and analysts need to see why a method was selected, which assumptions were checked, and where uncertainty remains.
| Technique | Question Type | Business Use Case | Key Assumption |
|---|---|---|---|
| Regression | How much or how many? | Forecast demand, revenue, or cost | Functional form and residual behaviour are suitable |
| Classification | Which category or event probability? | Score churn, fraud, or credit risk | Labels are defined consistently and class imbalance is handled |
| ARIMA or Prophet | What value comes next in a time sequence? | Forecast seasonal sales or staffing demand | Temporal structure and forecast horizon are appropriate |
| Survival analysis | When will an event occur? | Estimate customer lifetime or equipment failure | Censoring and event timing are handled correctly |
| GARCH | How will volatility change? | Model financial market or portfolio volatility | Conditional variance is specified appropriately |
| IV or 2SLS | What is the likely causal effect? | Estimate impact when confounding is present | The instrument is relevant and affects the outcome through the proposed pathway |
| Fixed effects | How do repeated observations differ over time? | Analyse firm, regional, or customer panels | Stable unit-specific effects can be controlled |
Model selection should compare transparent baselines with more complex candidates. The machine learning model selection guide is useful when the team needs to connect outcome type, validation design, interpretability, and operational constraints.
Business Use Cases Across Marketing, Finance, Operations, HR, and Risk
Predictive analytics becomes easier to evaluate when each function states its decision in plain language. Marketing wants to decide whom to contact and with what offer. Operations wants to decide what to purchase, repair, or schedule. Risk wants to decide which transaction, claim, or account deserves review.
The data source also determines what the model can legitimately learn. Purchase history may support a churn or offer model, but it won't explain a causal response to an intervention unless the organisation has a suitable experiment or identification strategy. Sensor readings may support failure prediction, but only if maintenance records and failure labels are reliable.
| Function | Typical Question | Recommended Technique | Data Source | Decision Fed |
|---|---|---|---|---|
| Marketing | Which leads may convert or customers may churn? | Classification, uplift modelling | CRM, campaign, purchase, and engagement data | Prioritise outreach, offers, or retention actions |
| Finance | What cash flow, credit risk, or anomaly is likely? | Time series, regression, classification, anomaly detection | Transactions, payments, account history, financial statements | Set limits, investigate transactions, or plan liquidity |
| Operations | What demand, failure, or inventory requirement is coming? | Time series, survival analysis, regression | Orders, inventory, machine sensors, maintenance logs | Purchase stock, schedule work, or allocate capacity |
| HR | Which roles face attrition or hiring delays? | Classification, survival analysis, regression | HRIS, recruiting, tenure, role, and workload data | Prioritise retention or recruiting interventions |
| Risk | Which events require review or scenario planning? | Classification, anomaly detection, stress models | Claims, transactions, controls, incidents, and exposure data | Escalate cases, strengthen controls, or allocate review capacity |
The operational handoff matters
A lead score isn't valuable because it ranks leads. It matters if sales changes contact priority and the organisation measures incremental conversion. A maintenance model isn't valuable because it identifies unusual sensor patterns. It matters if technicians receive a sufficiently early, credible work order and the business can measure avoided disruption or better asset availability.
Fraud detection shows the tradeoff clearly. A high-recall model may catch more suspicious activity while creating more investigations, whereas a high-precision model may reduce analyst workload while missing more events. Teams working in insurance can use a focused resource on AI for fraud detection in insurance to examine how detection models fit into claims workflows.
For churn, the model should feed a specific intervention, such as a save offer, service review, or repricing decision. A churn prediction models workflow can help analysts examine the relationship between prediction, segmentation, and retention action, but business owners still need to decide whether an intervention is economically and ethically justified.
Implementation Roadmap From Data Readiness to Monitoring
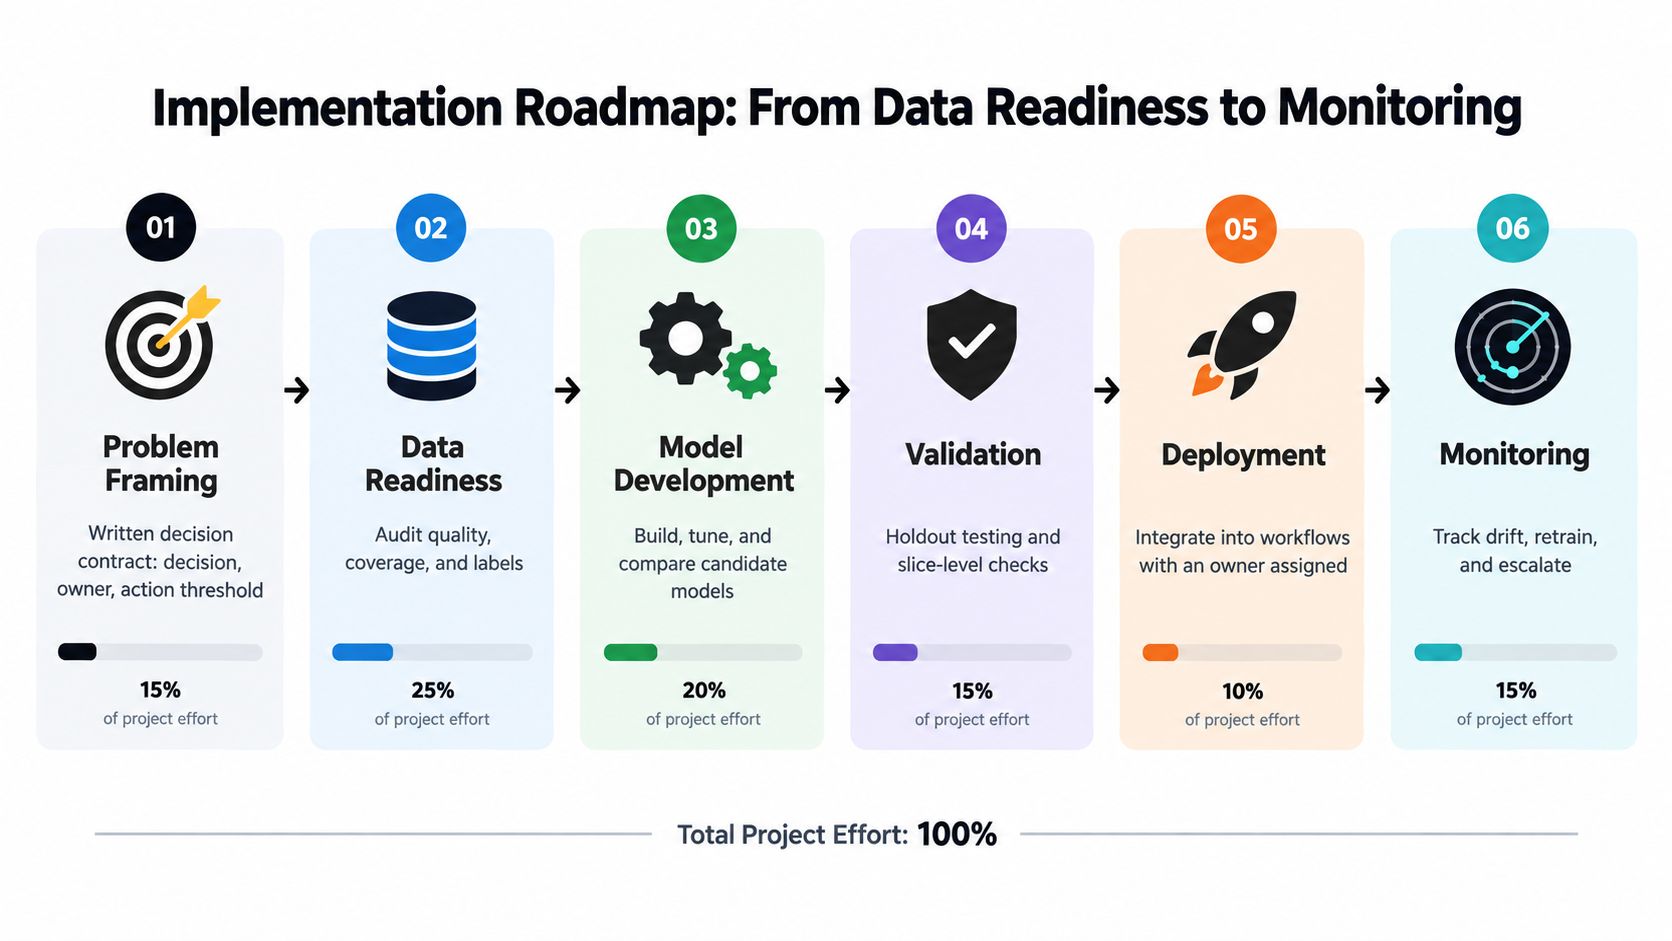
A production forecast is a chain of evidence, not a notebook with a high score. The team should create a concrete artifact at every phase so that responsibility doesn't disappear between data science, engineering, and operations.
Six phases from question to service
Frame the problem. Write a decision contract containing the predicted outcome, decision owner, intervention threshold, timing requirement, and intervention cost. If nobody can name the action, stop before modelling.
Audit data readiness. Trace source lineage, confirm join keys, assess freshness, inspect class balance, document missingness, and test for leakage. The deliverable should be a data-readiness report with known limitations, not a vague statement that the data is “clean.”
Engineer features with controls. Define transformations, encodings, missing-value rules, and leakage guards. Store the feature definitions under version control so the training logic and production logic don't drift apart.
Compare models against credible baselines. Include a naive forecast, seasonal naive forecast where relevant, and a simple linear or logistic model. Use time-based splits for temporal data and group-based splits when observations from the same customer, patient, machine, or firm could leak across partitions.
Validate under realistic conditions. Backtest across historical windows, inspect calibration plots, evaluate important slices, and run a signed-off shadow period. The shadow period compares model output with the current policy without immediately changing the live decision.
Deploy and monitor. Log predictions, inputs, outcomes, actions, and overrides. Monitor input distributions, residual error, calibration, missingness, and decision volume. Define who responds to drift and when retraining occurs. A quarterly retraining cadence may be appropriate for some stable applications, but it should be a governed decision rather than an automatic rule.
Three gates teams regularly skip
The first is the decision contract. Without it, the model optimises a technical target that may not correspond to a business action. The second is backtesting against the live policy, which reveals whether the forecast improves the existing process rather than merely outperforming an artificial baseline. The third is a drift response plan, including thresholds, ownership, rollback criteria, and communication.
Tools can reduce mechanical work, but they can't compensate for missing labels, unstable definitions, or an owner who won't act on the score. A data integration solutions workflow can support source preparation, but the organisation still has to define what the combined data means and whether the joins are valid.
KPIs ROI and the Forecast to Action Pipeline
Model performance and business performance are different measurements. Accuracy can hide the cost of false positives, false negatives, poor calibration, delayed forecasts, and interventions that don't work. The right metric depends on the decision's loss function.
For classification, precision, recall, F1, precision-recall curves, and lift are generally more informative than accuracy when classes are uneven or intervention costs differ. For regression, MAE and MAPE describe forecast error more directly than R-squared. For time-series work, MASE against a seasonal naive baseline provides a useful comparison because it asks whether the model beats a simple method that already understands recurring patterns.
Uplift models need a different evaluation approach. Qini coefficient and incremental A/B lift focus on whether the intervention caused additional response, not merely whether the model identified people who were likely to respond anyway.
| Task Type | Validation Metric | Operational Benchmark | Business KPI It Must Move |
|---|---|---|---|
| Classification | Precision, recall, F1, lift, calibration | Review capacity and intervention cost | Net retention, approved-risk quality, or investigation yield |
| Regression | MAE, MAPE, residual checks | Current planning or estimation process | Margin, service level, or forecast-driven cost |
| Time-series forecasting | MASE, backtest error, interval coverage | Naive or seasonal naive forecast | Stockouts, excess inventory, staffing efficiency, or capacity use |
| Uplift modelling | Qini coefficient, incremental A/B lift | Randomised or holdout treatment comparison | Incremental revenue, save rate, or contribution margin |
| Maintenance prediction | Event recall, lead-time quality, calibration | Existing preventive or condition-based policy | Uptime, maintenance cost, or avoided disruption |
Operations-focused industry guidance reports measurable improvements in some predictive deployments, including 62% downtime reduction, 55% better inventory management, and 48% defect reduction (Cloudera). Those figures shouldn't become generic promises. They illustrate the central point: a predictive system creates value when it triggers a closed-loop maintenance, quality, or supply-chain action.
For a maintenance team comparing condition based vs predictive maintenance, the evaluation should include timing, work-order quality, false alarms, and the cost of intervention. A model score alone can't tell the team whether the policy improved.
A practical ROI calculation is:
(Incremental profit from acted-on predictions minus model cost and intervention cost) divided by total cost.
Use holdouts, staggered rollouts, or geo tests to estimate incremental impact. Then audit the dashboard with five questions:
- What decision changed?
- Which owner acted?
- Which population received the intervention?
- What would have happened without the model?
- Did the financial result cover the full cost of action?
Dashboard test: If removing the forecast wouldn't change a decision, it isn't yet a value-producing predictive system.
Governance Privacy and the Agentic Analytics Workflow
A large-scale adoption study found that 71% of firms were already using, or had near-term plans to use, at least basic analytics in everyday decisions (Dell). A separate Deloitte study found 22% of companies were already using predictive analytics while 62% planned to implement it soon (Deloitte). Adoption is therefore not the main question. The harder question is whether organisations can govern an always-on decision system.
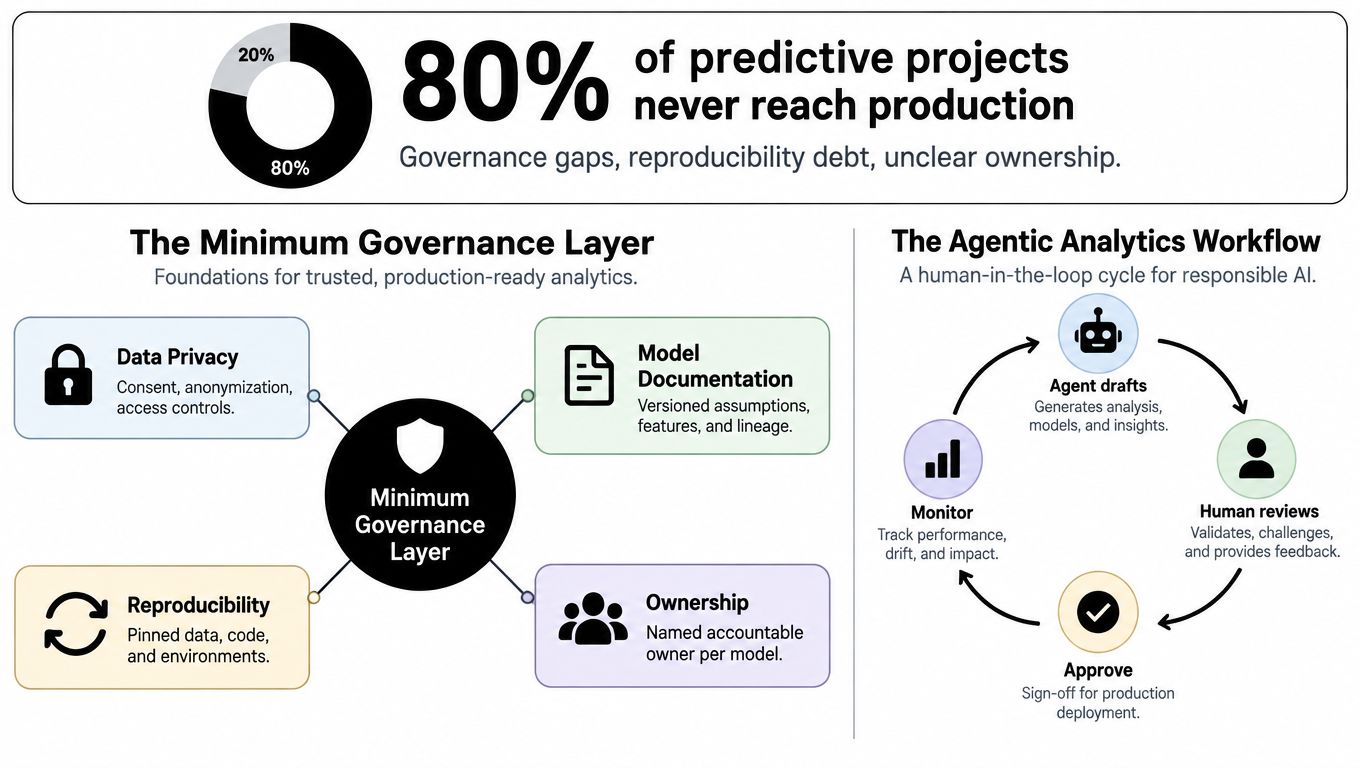
A minimum governance layer should include:
- Versioned model records: Preserve code, data references, hyperparameters, training dates, and evaluation outputs.
- End-to-end lineage: Connect source tables and transformations to each served prediction.
- Intended-use documentation: State assumptions, exclusions, acceptable use, and known failure modes.
- Fairness testing: Compare performance and error patterns across relevant protected or vulnerable segments.
- Privacy controls: Address consent, retention, access, and right-to-erasure obligations under regimes such as GDPR and CCPA.
- Reproducibility: Enable a new analyst to rebuild a historical forecast from pinned raw inputs, code, and environment details.
What agentic analytics adds
Agentic analytics is data analysis performed by AI agents that can plan an investigation, execute analytical steps with real tools and code, inspect intermediate results, revise the approach, validate outputs, and synthesise a complete analysis. An answer is an output. An analysis is an investigation.
In a governed workflow, an AI analyst can draft hypotheses, inspect data, write and run Python, compare models under approved validation gates, generate an auditable notebook, and surface decisions for human approval. It shouldn't deploy a model or override a policy owner on its own.
PlotStudio AI's explanation of agentic analytics describes the distinction between a chatbot that responds turn by turn and an agentic system that carries out multi-step analytical work. For researchers and analysts, the useful artifacts are the plan, code, methodology, charts, statistics, assumptions, and saved analysis, not just a fluent narrative.
Governance principle: Automation may prepare and test a recommendation. A named human owner remains accountable for approving its use.
Practical Checklist FAQs and Next Steps
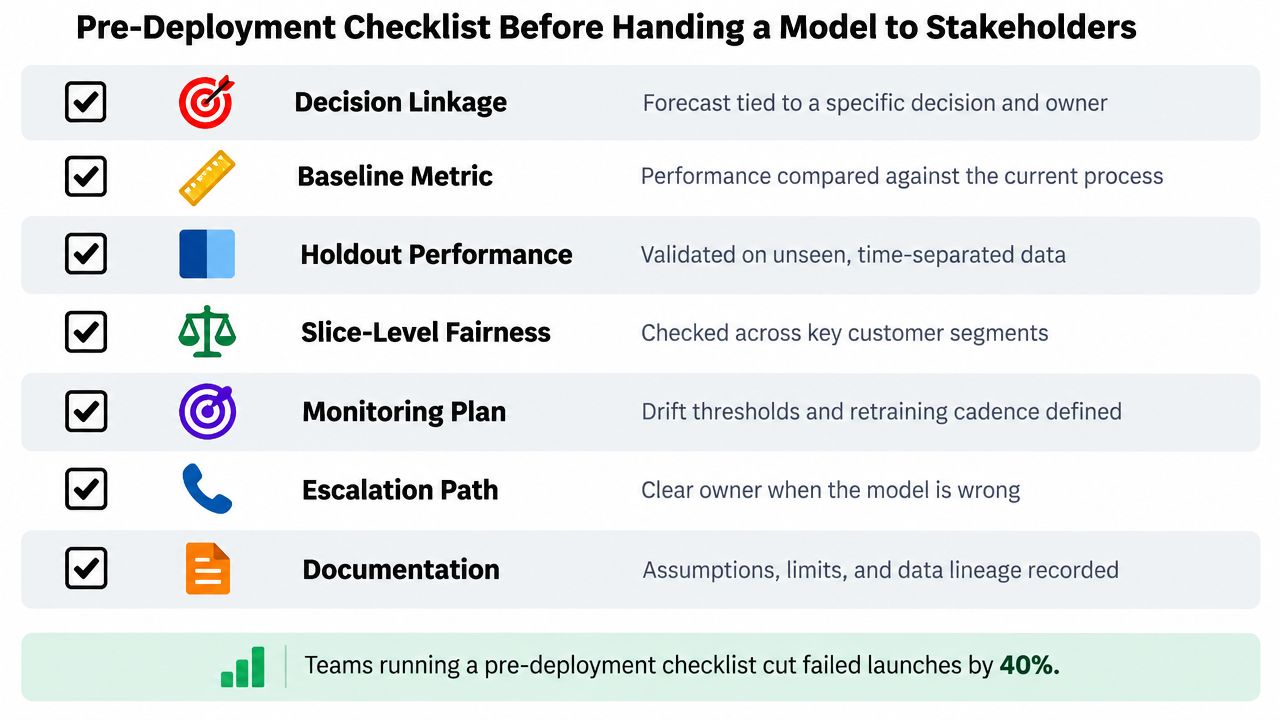
Before a model reaches stakeholders, verify that it can change a defined business decision:
- Decision linkage: A named owner and action threshold are in place.
- Baseline metric: The model improves the current process or clearly changes the decision.
- Holdout performance: Unseen, time-separated, or group-separated data was used for testing.
- Slice-level fairness: Performance and error rates were reviewed across relevant segments.
- Monitoring plan: Drift thresholds, retraining cadence, and escalation steps are documented.
- Owner sign-off: Someone accepts responsibility for action, review, and rollback.
- Documentation: Assumptions, limits, lineage, and reproducibility materials are saved.
Frequently asked questions
How much historical data is enough?
The answer depends on outcome frequency, seasonality, segment count, missingness, and process stability. Start with a baseline, then test whether added history improves out-of-sample performance without combining incompatible operating periods.
When should a team use an off-the-shelf model?
Use a standard method when the outcome, data structure, validation design, and governance requirements are familiar. Build custom logic when the decision has unusual constraints, causal requirements, specialised data, or significant regulatory consequences.
How should a team defend ROI to finance?
Connect the forecast to a specific intervention. Estimate incremental impact with a holdout or controlled rollout, and include model, integration, review, and intervention costs. A strong model score alone does not establish business value.
What should happen when production drift appears?
Pause or narrow the affected decision. Investigate changes in inputs and outcomes, notify the owner, compare results with the baseline, and retrain only after documenting the cause and validation plan.
Teams moving from data-readiness checks to model comparison and auditable reporting can use PlotStudio AI's researcher offering for local Python-based analyses, visible generated code, and reproducible Analysis Pages. Compare local execution, code transparency, and reproducibility controls with your governance requirements before selecting a tool.
If a project has a real decision owner, a defined intervention, and auditable data, begin with a baseline forecast and written decision contract. Test the workflow on a contained use case, record each assumption, and inspect the analysis before presenting it to stakeholders.