The best survey data analysis software depends on whether you need collection, dashboards, or defensible statistics. For researchers comparing the best AI tools for researchers and AI tools for data analysis, PlotStudio AI leads this list for auditable, local Python analysis, while Stata, R, SPSS, and SAS remain stronger for established design-based workflows.
A larger online sample can make results worse, not better. A 2025 study of online health-survey quality reported a case where only 197 of 1,281 respondents were real respondents, and including fraudulent responses created and masked relationships. That is why feature counts are a weak basis for ranking tools. You need screening, cleaning, weighting checks, and an exclusion trail before you trust a cross-tab.
Response rates create a second trap. The U.S. Bureau of Labor Statistics comparison report reported 34.2% for its Diary Survey in late 2025 and 38.5% for its Interview Survey in early 2026, while noting low response can signal nonresponse bias when participation correlates with outcomes. Good software should therefore compare weighted and unweighted estimates, show effective sample size, and test whether conclusions survive alternative calibration choices.
This roundup separates two jobs. Collection platforms design questionnaires, enforce logic, and distribute links. Analysis tools clean responses, declare weights, strata, and clusters, estimate design-based variance, and produce reproducible outputs. Some products do both adequately for simple work. Few do both well for publication. Judge each option below by the job your design requires, then pilot it on a messy export, not a demo file.
1. PlotStudio AI
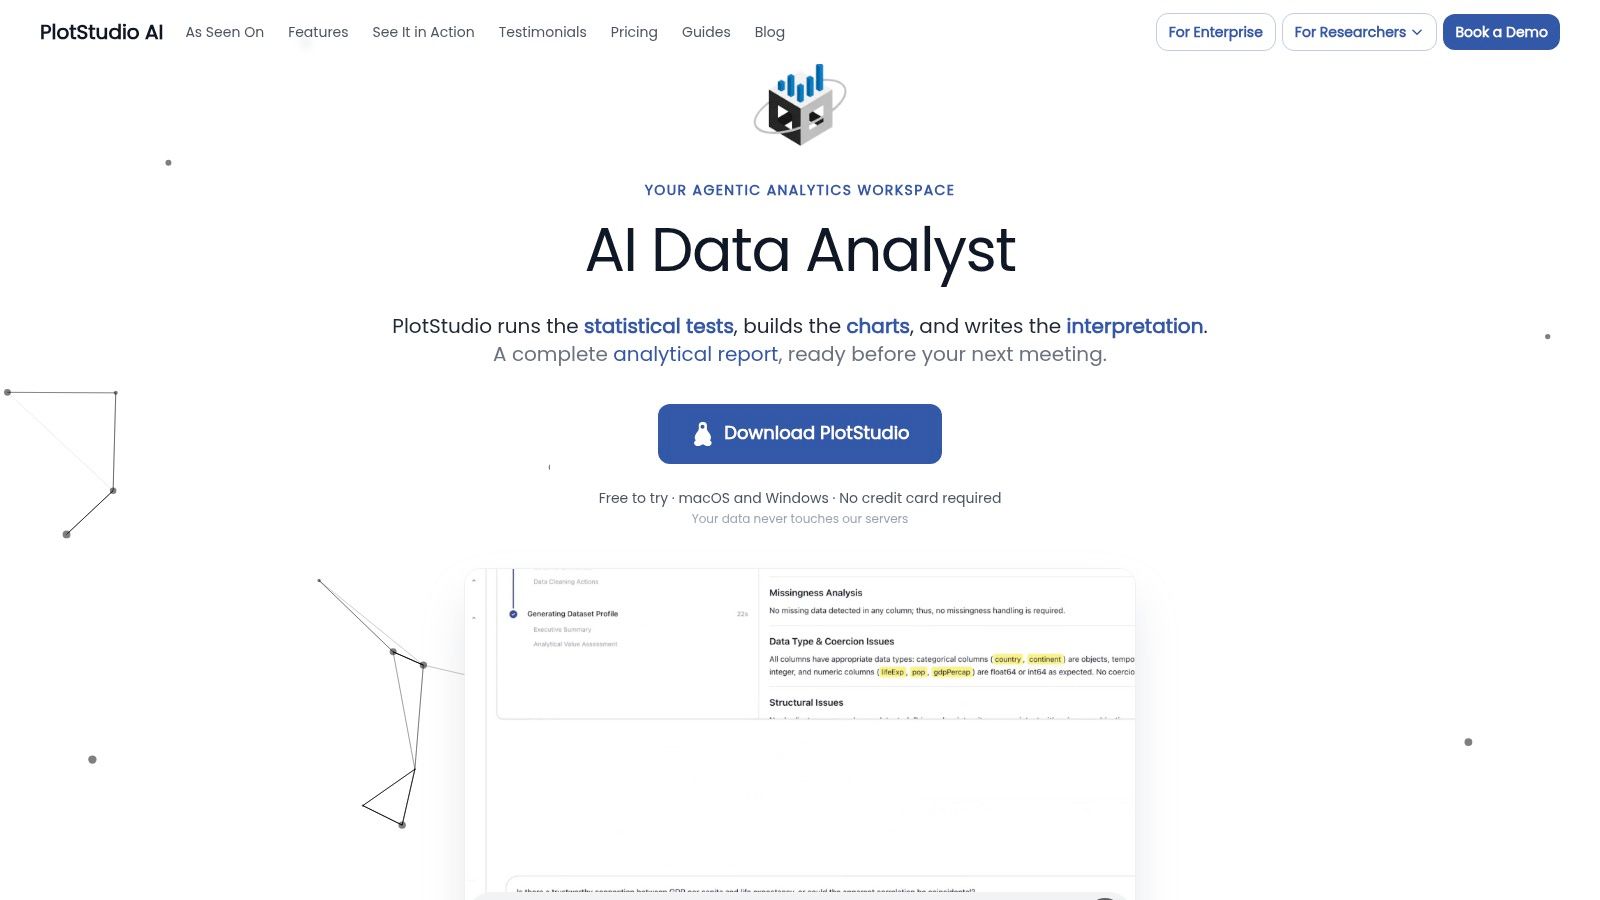
PlotStudio AI is a desktop application for researchers who need investigation, not chat. You upload a survey export and ask a question in plain English. A team of specialized agents plans the method, writes Python, executes it in a local engine, checks the output, and saves a permanent Analysis Page with tables, charts, statistical tests, and interpretation in one structured document.
Collection tools stop at fieldwork. Analysis starts after export, when labels, missing codes, skip patterns, and weights decide whether an estimate holds. PlotStudio profiles schema, types, missingness, distributions, and a quality score on upload, then proposes cleaning steps and exploratory questions. You review the plan in Plan Mode before it runs. Generated code stays inspectable, with a textual description of each step, and results export to PDF or a reproducible Jupyter notebook.
That record helps when work moves across tools. An analysis of Management Science articles from 2019 to 2023 found Stata in 60% of papers, followed by R at 19% and Python at 11%, so keeping transformations and code readable matters for handoff. Domain methods run automatically where relevant, including IV/2SLS, fixed-effects models, GARCH, and Cox proportional hazards. Survey design still needs explicit input. Declare weights, strata, and clusters, then check whether variance estimates reflect them.
Best for and workflow
- Best for: Researchers who want a Julius AI alternative with multi-step investigation, local execution, and visible methodology
- Workflow: Import a Qualtrics CSV, review the proposed cleaning plan in Plan Mode, then export the notebook for review
- Limits: Confirm current pricing before adoption, and review model provider terms because AI requests leave your machine even though dataset processing runs locally
An in-depth Effortless Academic review tested it on real research datasets.
2. Qualtrics
Qualtrics is strongest when collection and stakeholder reporting must live together. You can build complex questionnaires, monitor quotas, and publish results dashboards with custom pages, widgets, filters, downloads, and scheduled emails. Nontechnical managers can follow results without waiting for an analyst to rebuild tables after every fieldwork update.
Specialist projects extend it beyond feedback forms. Conjoint and MaxDiff support preference research that basic survey tools handle poorly. That breadth fits the enterprise-heavy market described by Mordor Intelligence, which estimates large enterprises represented 64.62% of online survey software market share in 2025. Enterprise buyers should still check access controls, identity integration, audit trails, and data residency against institutional rules.
For planning the collection side properly, this guide to research tools for structured data collection is a useful companion before you commit to fieldwork settings.
Treat Qualtrics dashboards as reporting, not proof. Export the raw data and codebook before you start weighting or modeling.
Best for: A university or company running repeated trackers where leaders need live, filtered dashboards. Example workflow: Field a quarterly employee survey, share department dashboards inside Qualtrics, then export respondent-level data to Stata or R for weighted regression. Trade-off: Pricing is typically quote-based, the platform can be excessive for a one-off study, and it does not replace a general statistical package for custom complex-sample modeling.
3. IBM SPSS Statistics
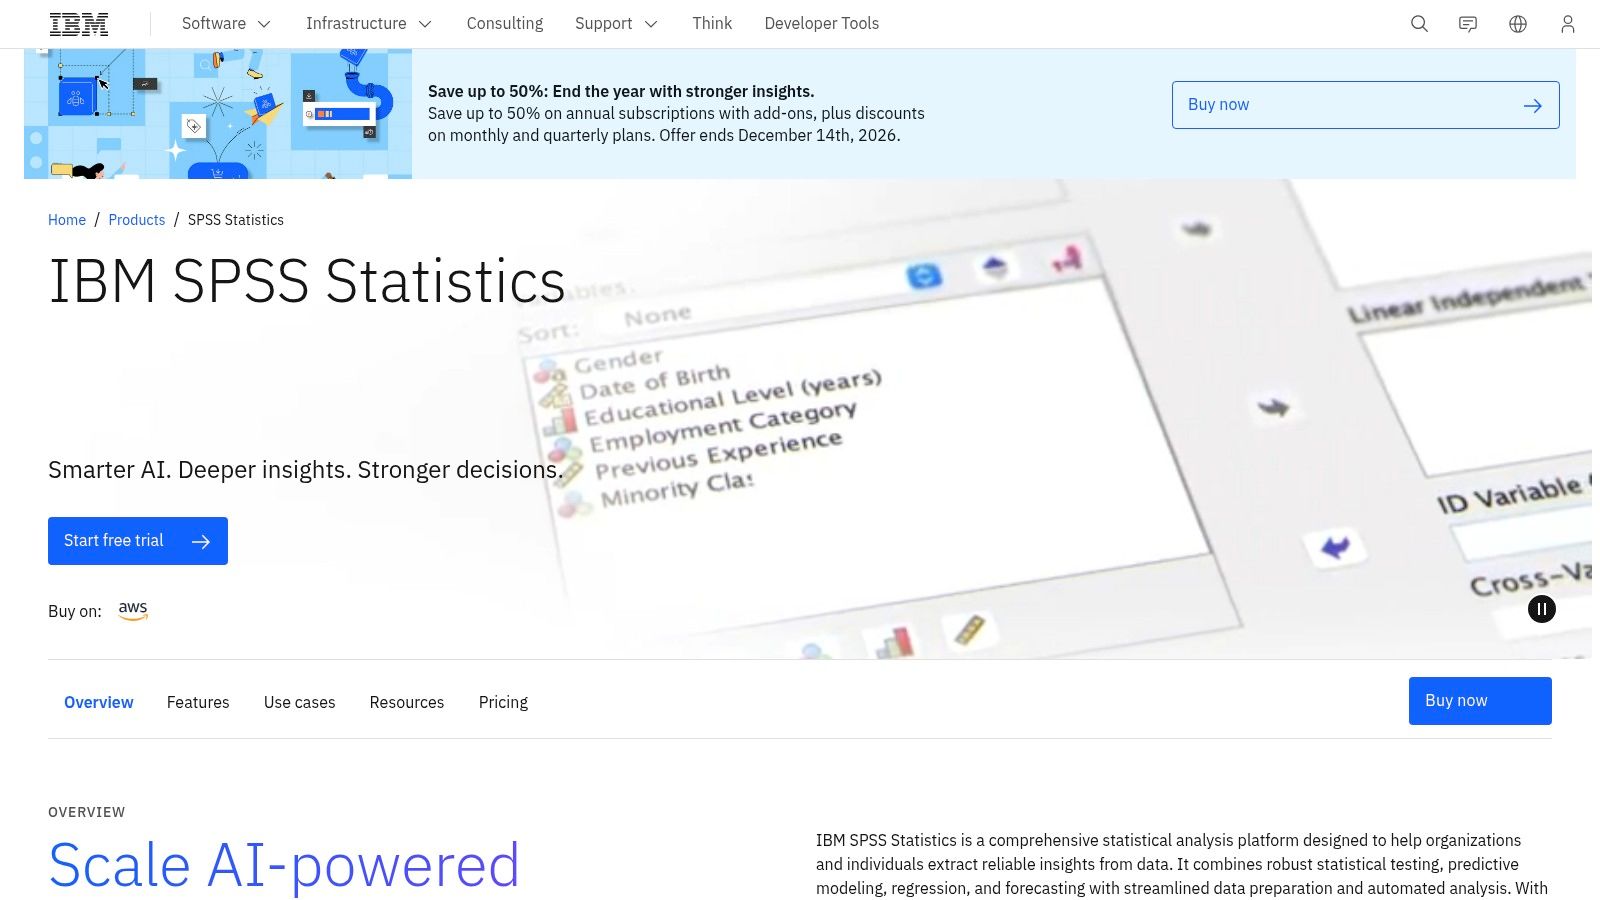
IBM SPSS Statistics suits researchers who want menus first and syntax when needed. It covers data preparation, descriptives, regression, custom tables, and exports to Excel and PDF. For many psychology, education, and health surveys, that GUI lowers the barrier for analysts who don't write code daily but still need more than platform summaries.
Its lineage explains that design. A historical overview of statistical software notes SPSS was developed at the University of Chicago beginning around 1968 and that IBM acquired SPSS in 2009. Longevity helps with training materials and legacy files. It doesn't remove licensing traps.
Where to be careful
Complex Samples is an add-on, not a guarantee in every subscription. If your design uses strata, clusters, or sampling weights for variance estimation, verify the exact license tier before analysis begins. Researchers comparing GUI-first options can also review these SPSS alternatives for statistical analysis to see where code-based tools differ.
Best for: A teaching hospital team analyzing patient experience scales with reliability checks, recodes, and formatted tables. Example workflow: Import an SPSS export from your survey platform, define value labels and missing codes, run weighted descriptives, then save syntax so a reviewer can rerun every table. Trade-off: It's primarily analysis software, not a complete collection platform, and add-on selection can complicate purchasing.
4. Stata
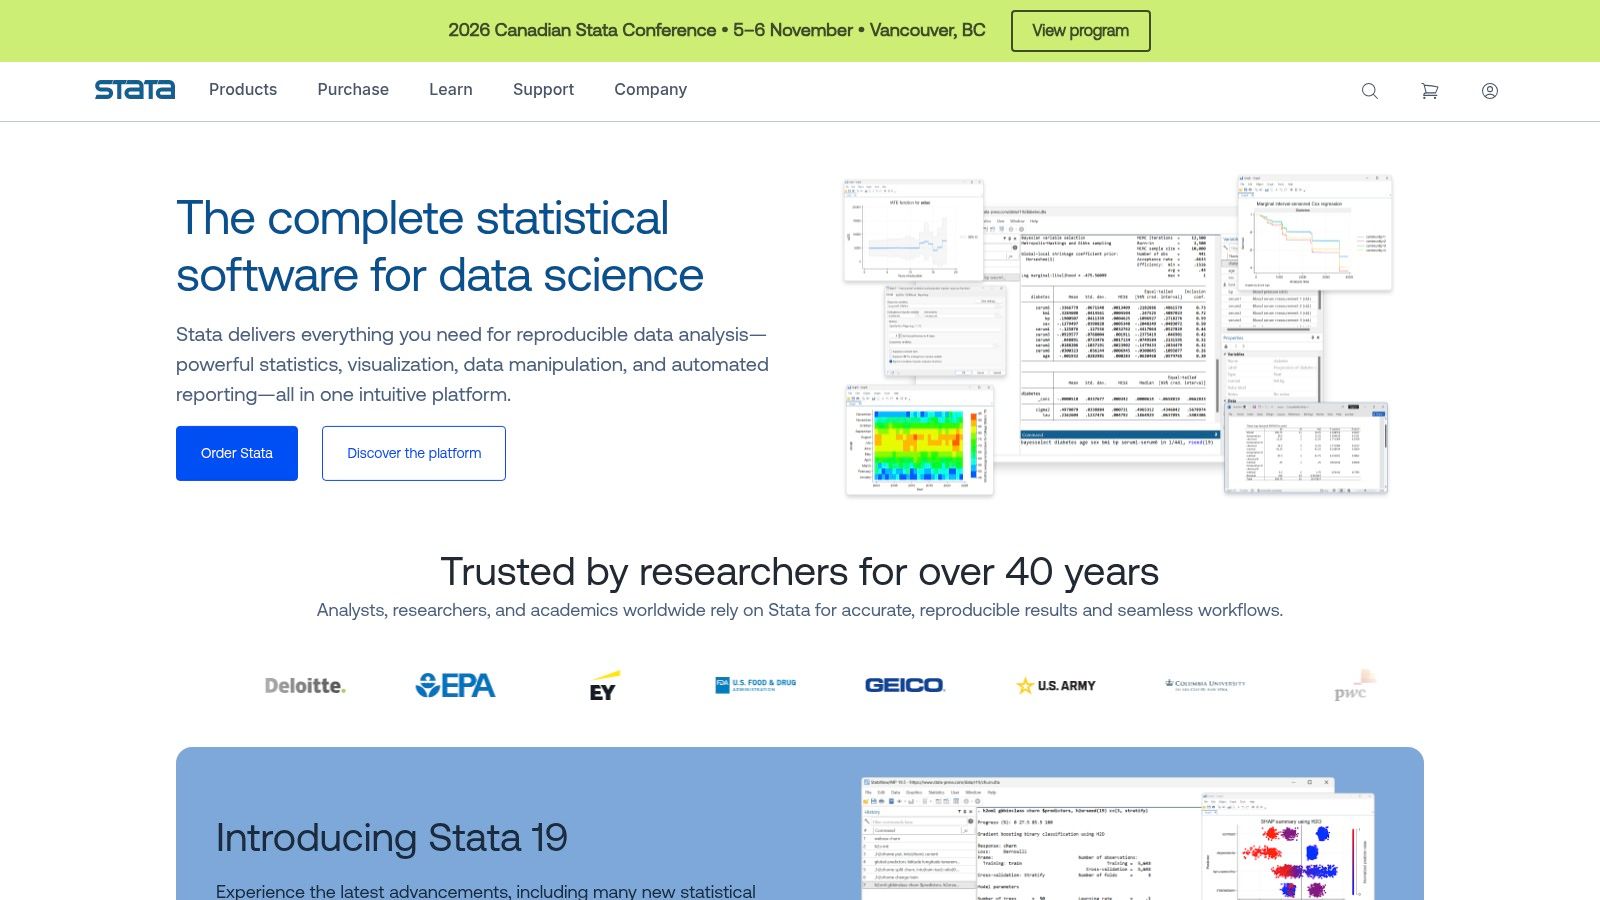
If your survey has a real sample design, Stata is hard to beat for clarity. You declare the design once with sampling weights, strata, primary sampling units, and poststratification, then apply survey-aware estimation across descriptives, tables, and regression. Variance options include Taylor linearization, bootstrap, jackknife, and balanced repeated replication.
That maturity took time. A documented timeline of survey software development shows Stata introduced probability weights in version 3 in 1992 and reached 48 survey procedures by version 10 in 2007. For national health, labor-force, and education surveys, that history matters because ordinary standard errors are wrong when observations are clustered or unequally weighted.
Stata also fits longitudinal follow-ups well. If your survey repeats across waves, this overview of panel data analysis methods helps you decide when fixed effects or other repeated-measures models belong beside survey estimation.
Best for: Social science, public policy, and health researchers using multistage samples who need scripted, reproducible reports. Example workflow: Use svyset to declare PSU, strata, and weights, estimate weighted proportions by subgroup, run a survey logistic model, and export a reproducible report from a do-file. Trade-off: Repeatable work requires learning commands despite the GUI, licensing costs money, and Stata cannot rescue an incorrectly specified design.
5. R with the survey package
R with the survey package is the free option I recommend when the team already codes. It handles multistage, stratified, clustered, and unequally weighted designs, with means, proportions, tests, regression, calibration, and raking. Variance estimation uses Taylor-series linearization or replicate weights, and the wider R ecosystem covers cleaning, graphics, and literate reporting.
The design declaration is the whole game. Federal best-practice guidance on nonresponse bias explains that the base weight is often the inverse of a unit's selection probability and that stage-specific response rates should be preserved in multistage designs. In R, those choices stay visible in the design object, which makes review easier than hunting through menu clicks.
Variance choices deserve the same visibility in non-survey models. This primer on robust standard errors and when to use them is relevant when you compare design-based survey errors with model-based alternatives.
Best for: A PhD student or methods lab that needs full control without license costs. Example workflow: Clean an export with tidyverse tools, build a survey design object, calibrate weights to population margins, estimate subgroup means with confidence intervals, and render a Quarto report. Trade-off: There's no commercial dashboard, package choices require judgment, and beginners face a real learning curve.
6. QuestionPro
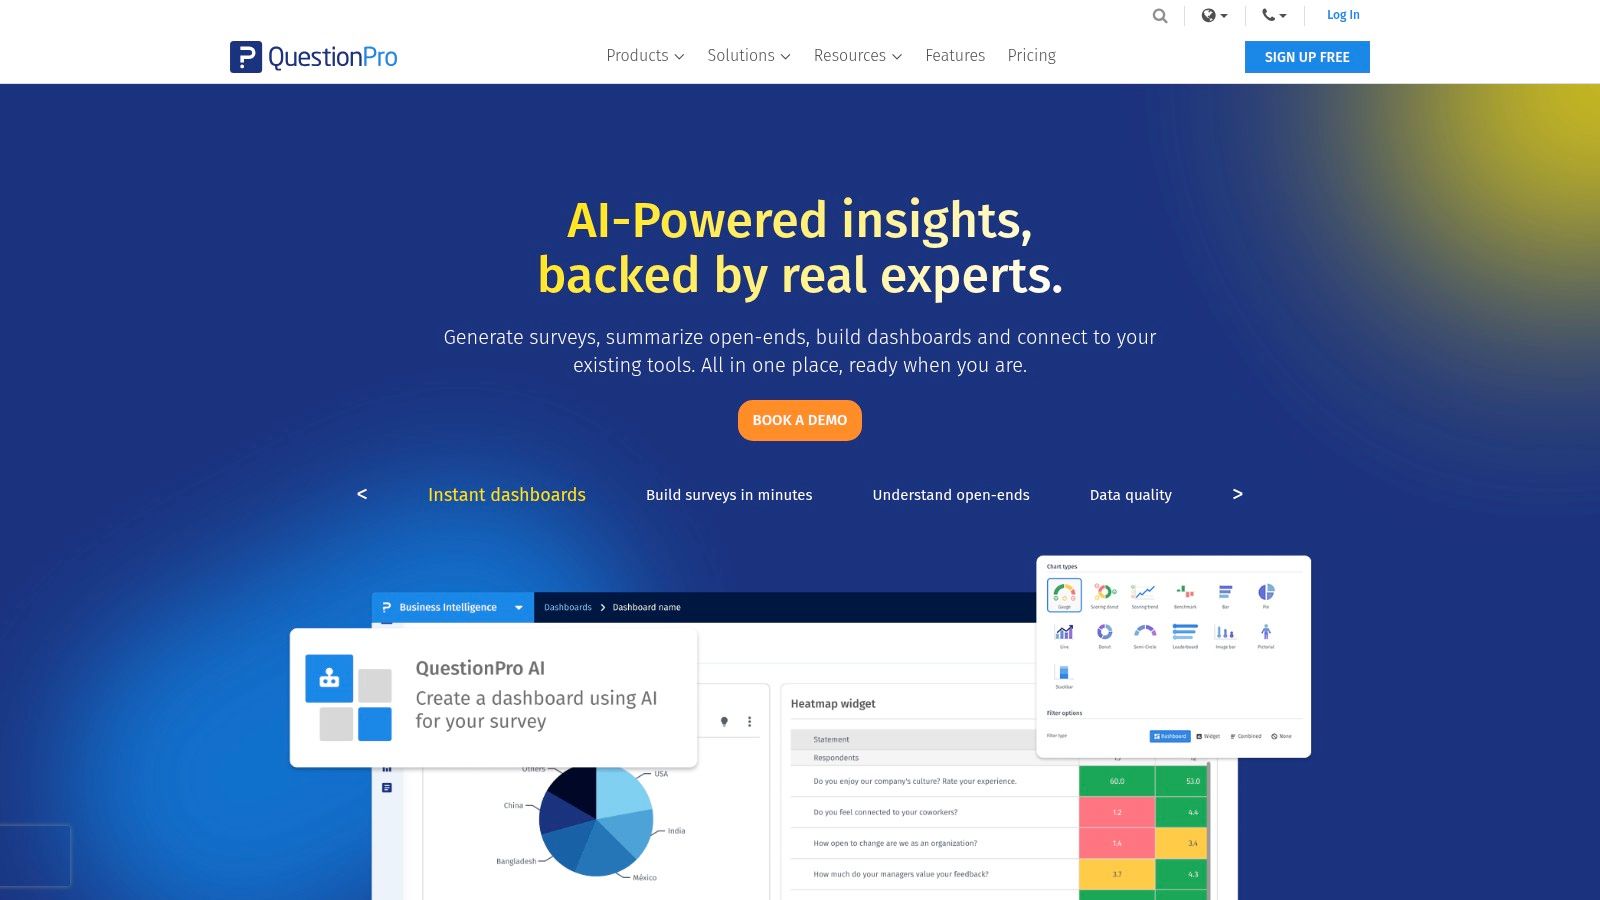
QuestionPro is a collection platform first, analysis tool second. Authoring, distribution, quotas, and automatic response summaries live in one service. That setup shortens the path from launch to readable top-lines for operational surveys.
That convenience has a boundary. The free Essentials tier caps the number of responses per survey, which can suit a pilot, a classroom exercise, or instrument pretesting, but it may be too small for subgroup analysis where small cells already strain precision. Paid tiers and Research Suite plans add capacity, and I recommend checking annual billing terms and feature gates before fieldwork starts.
For analysis, treat it as screening, not estimation. Built-in charts flag item nonresponse, drop-off points, and wording problems early. They do not replace design-based variance, weight calibration, or scale validation. When strata, clusters, or unequal selection probabilities support the published claim, export row-level data with weights and design variables intact and test that export on pilot data.
- Strength: Survey administration and reporting stay together for fast operational studies
- Strength: A free tier supports small pilots before budget approval
- Limit: Built-in reporting is not a specialist statistical package for design-based variance or custom models
Best for: A product or alumni-relations team running frequent short surveys with straightforward reporting needs. Example workflow: Pilot a questionnaire on the free tier, inspect item nonresponse and completion patterns, revise wording, then field the full survey and export clean data for confirmatory testing elsewhere. Trade-off: External software becomes necessary once weighting, scale validation, or clustered designs decide whether the result holds.
7. Alchemer Survey
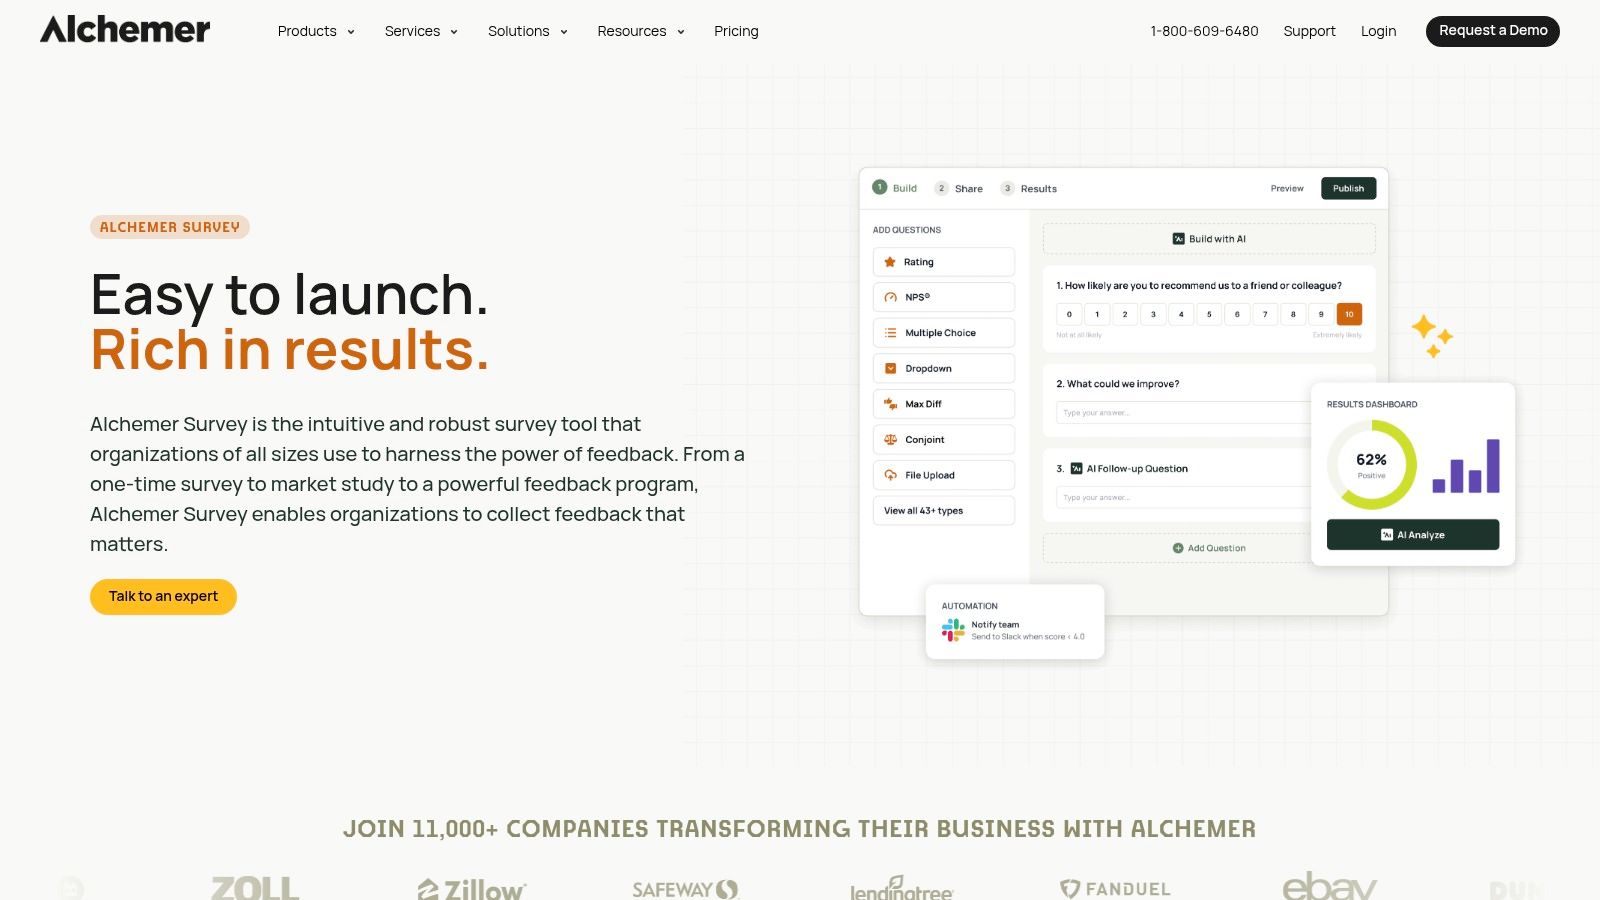
Alchemer Survey works well as a survey front end for researchers who plan serious analysis elsewhere. Its builder supports branching and other logic, while reports and raw-data exports keep you from being trapped in summary screens. Eligible plans add advanced analysis, including conjoint and open-text features.
The export detail matters more than the dashboard. SPSS-format export with variable labels and types preserves metadata that CSV exports often flatten or lose. That saves tedious reconstruction of value labels, question wording, and missing-value codes when the file moves into SPSS, Stata, or R for modeling.
Practical rule: Test the export before fieldwork ends. If labels, multi-select coding, or open-text fields break in a pilot export, they will break at full scale too.
Best for: Organizations that need stronger logic than a basic form tool but already have an analyst and a statistical package. Example workflow: Build a branching community-needs survey, export the SPSS file weekly during fieldwork to monitor quotas and item missingness, then run final weighted tables externally. Trade-off: Advanced features vary by plan, published plans impose annual response limits, and I wouldn't treat Alchemer alone as sufficient for complex-sample inference or publication-grade modeling.
8. SurveyMonkey
Start with what SurveyMonkey does well. It generates automatic summaries and charts, lets you browse individual responses, and applies filters and comparison rules to inspect segments quickly. For event feedback, course evaluations, and internal pulse surveys, that speed is often exactly what stakeholders need.
Paid tiers expand the analysis, but access is uneven. Listed team plans add features such as multi-survey analysis, and depending on plan, cross-tabulation and thematic analysis. AI analysis is available on eligible accounts. Before relying on crosstabs for a board report, confirm they're included in your tier and check response limits and overage charges.
Don't stretch it past its design. SurveyMonkey is geared toward accessible reporting, not clustered samples, replicate weights, calibration, or custom regression with design-based standard errors. That's not a flaw if you use it appropriately. It becomes a problem only when neat charts substitute for methods.
Best for: Small teams that need a free or low-friction starting point and simple segment comparisons. Example workflow: Run a post-event survey, compare satisfaction by first-time versus returning attendees, review open-text themes, and export responses if later modeling is required. Trade-off: Key analysis features sit behind paid plans, and complex survey claims belong in specialist software.
9. SAS/STAT

SAS through SAS/STAT fits institutions that already run governed analytics pipelines. It provides survey sampling and analysis procedures alongside regression, categorical data methods, imputation, and survival analysis. Documentation for selecting survey procedures helps analysts match the estimator to the design rather than forcing survey data through ordinary procedures.
That breadth suits regulated or long-running programs. A government or clinical research group can keep sampling, cleaning, imputation, and modeling inside one validated environment with established review habits. If follow-up time matters in your survey cohort, this guide to SAS survival analysis workflows shows the adjacent modeling path.
Fit check
- Choose it if: Your organization already licenses SAS and reviewers expect its procedures and logs
- Skip it if: You need a friendly dashboard, a one-off survey summary, or low-cost individual access
- Verify first: Which survey procedures your license includes and how outputs will be shared outside SAS
Best for: Established institutional teams analyzing official or clinical surveys at scale. Example workflow: Draw or document the sample, apply survey procedures for weighted estimates, handle item missingness through an approved imputation workflow, and archive logs for audit. Trade-off: It's more technical than visual survey platforms and excessive for small, simple projects.
10. JMP
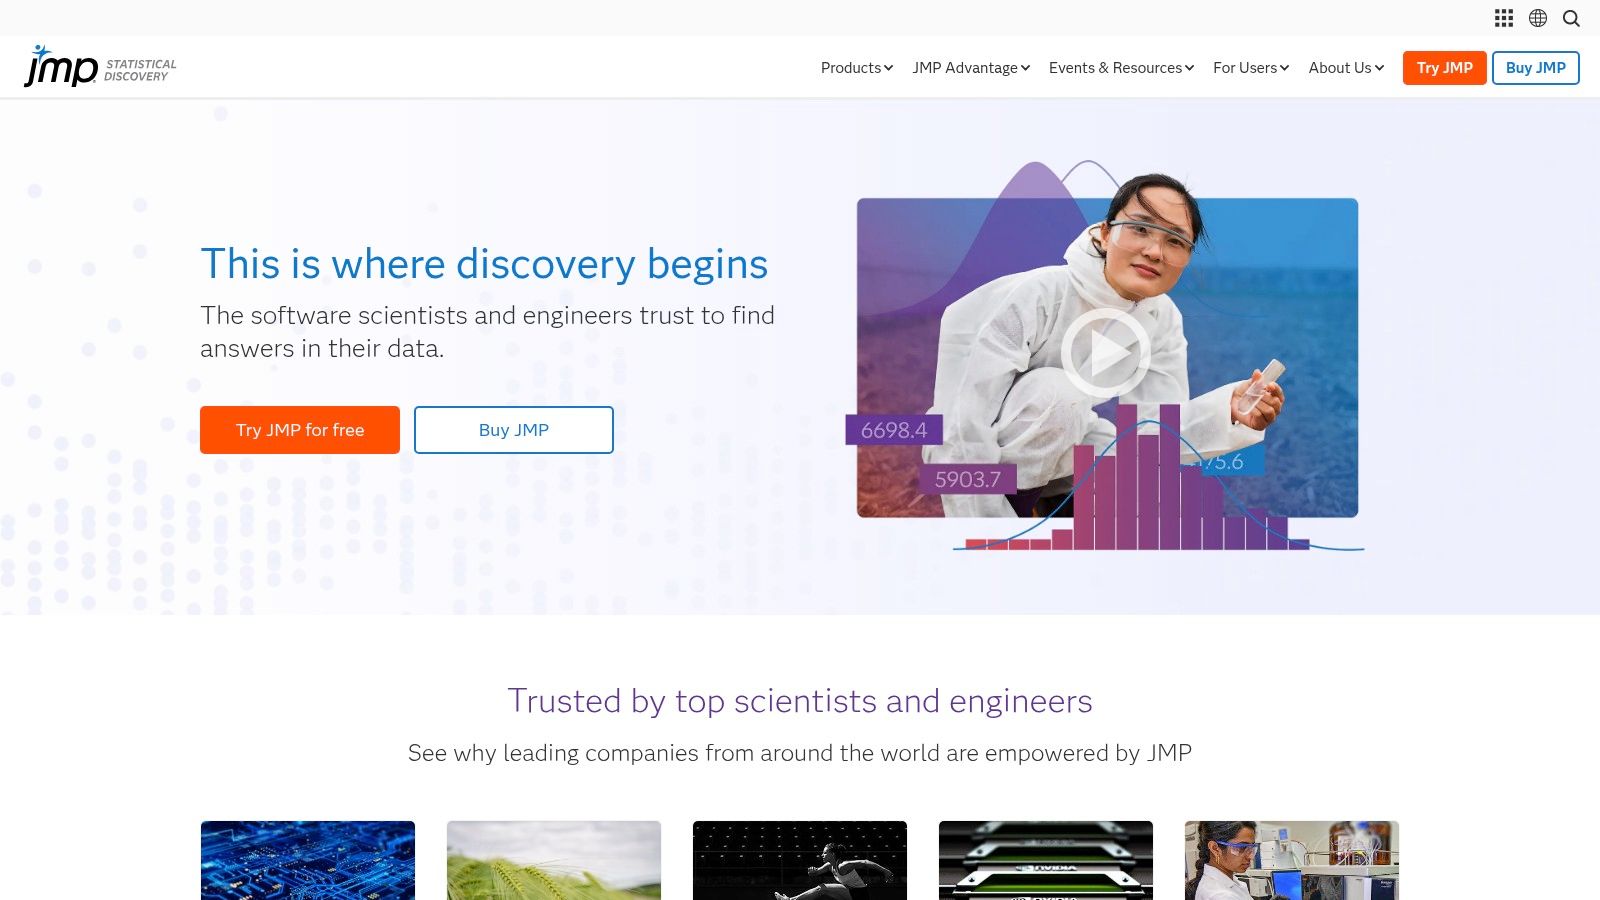
JMP is the visual explorer in this list. Interactive, linked visualizations let you brush a subgroup in one graph and see it highlighted elsewhere, which helps you spot odd distributions, segment patterns, and candidate relationships before formal modeling. Data preparation, filtering, grouping, dashboards, and automation support that exploratory style.
Consumer and market research is a natural fit. JMP includes survey analysis and choice experiments among its relevant applications, and integration with R, Python, and SAS lets analysts hand off specialized work instead of rebuilding datasets. That interoperability matters when exploration in JMP raises a question that needs a model JMP shouldn't be forced to answer.
The caution is specific. JMP is commercial software, it isn't a survey-collection platform, and users needing complex-sample inference should verify support for their required design-based methods, including strata, clusters, replicate weights, and finite-population corrections. Visual confidence is not the same as correct variance estimation.
Best for: Market researchers and applied scientists who explore patterns visually before confirmatory testing. Example workflow: Import a consumer survey, link demographic filters to preference charts, identify a segment worth testing, then send the dataset to R or Stata for design-based estimates. Trade-off: Excellent exploration, weaker fit as your sole tool for official complex-survey inference.
Survey Data Analysis Software Compared by Analysis Requirements
Weighting and variance estimation decide the shortlist. A tool that charts responses well can still fail a study that requires strata, clusters, or replicate weights applied consistently.
| Item | Best for | Complex survey support | Pricing | Scripted reproducibility |
|---|---|---|---|---|
| PlotStudio AI | AI-assisted analysis with inspectable code and reports | Built for cleaning, visual exploration, and coded analysis; confirm support for weights, strata, and clusters before design-based inference | Free trial; check current paid options | Python execution with generated code and export to reproducible Jupyter notebooks |
| Qualtrics | Survey design, collection, dashboards, and specialized research | Survey reporting and dashboards rather than declared design-based variance estimation | Quote-based or license-dependent purchase | Dashboard reporting emphasis; plan an export path for scripted analysis |
| IBM SPSS Statistics | GUI-based statistical analysis of survey responses | Complex-sample routines sit in a separate add-on, so confirm licensing and coverage | Subscription and other licenses; add-ons may cost extra | Primarily menu-driven; syntax can preserve steps when saved deliberately |
| Stata | Statistical research using weights, strata, and clustered samples | Strong support for complex survey designs | Commercial license; check current pricing | Scripted workflows and reproducible reports |
| R with the survey package | Flexible, reproducible analysis of complex samples | Strong support for complex survey designs | Free and open source | Strong; analyses can be scripted and documented |
| QuestionPro | Survey creation, response collection, and basic reporting | Built-in reporting for collection and summaries, not specialist statistical estimation | Free tier with a 200-response limit; some plans use annual billing or a sales quote | Basic reporting emphasis; export raw data for scripted work |
| Alchemer Survey | Survey creation, reporting, and exporting data for deeper analysis | Reporting and data capture, with deeper statistical work done after export | Plan-dependent; annual response limits apply | Raw-data and SPSS-format exports support downstream scripting |
| SurveyMonkey | Accessible survey summaries, charts, and respondent comparisons | Summary charts and comparisons, not intended for complex survey designs | Free and paid plans; limits and overages vary | Summary reporting emphasis; export for reproducible analysis |
| SAS/STAT | Broad statistical analysis and established institutional workflows | Includes survey sampling and analysis procedures for institutional work | License-based purchase; check current terms and individual access | Scripted procedures support repeatable institutional workflows |
| JMP | Visual statistical exploration, modeling, and market research | Visual exploration first; verify support for required design-based methods | Commercial; check current licensing options | Automation options available; confirm scripting coverage for the planned workflow |
Choosing Survey Data Analysis Software You Can Defend
A defensible choice starts with design requirements, not dashboards. List the weight variable, strata, clusters or primary sampling units, any replicate weights, and the variance method before you shortlist tools. If a product cannot declare those elements and apply them consistently to estimates and standard errors, it is reporting software for your study, not analysis software.
Response rate and bias need separate handling. Federal statistical guidance on survey standards requires response rates computed with standard formulas, with weighted rates accounting for each sampled unit's probability of selection. That means base weights, eligibility rules, unit nonresponse, and item nonresponse stay distinct in your workflow. A single completion percentage from a survey platform does not meet that standard.
Use thresholds as testable checkpoints. The Bureau of Labor Statistics explanation of response-rate standards notes agencies plan a bias analysis when the expected unit response rate falls below 80%. Your software should flag that breach for the total sample and for important subgroups, preserve the denominator, and show stage-specific rates in multistage designs. Low response in one stratum can damage estimates even when the overall rate looks acceptable.
Weighting does not fix every problem on its own. GESIS guidance on nonresponse bias analysis finds no clear relationship between response rate and the other factors that determine bias. Compare respondents with frame data where available. Report weighted and unweighted results side by side. Inspect design effects and effective sample size, and run sensitivity checks under alternative adjustments. Keep the original base weight visible. Never overwrite design information with a single final weight and no history.
Apply the same discipline to data quality screening. Combine completion time, straight-lining, contradictory answers, duplicate metadata, and open-text checks. Rerun headline estimates before and after exclusions and report whether effect sizes or conclusions change. Distinguish detected risk from proven fraud in the audit trail. A tool that deletes cases without notice produces a cleaner file and a weaker paper.
Reproducibility and privacy belong in the same check. A reviewer should see cleaning rules, recodes, syntax or Python, weight construction, and model choices. You should export data, labels, code, and outputs without reconstructing the work by hand. Confirm where respondent data goes during AI processing, and whether analysis can run locally or inside your tenant. Teams comparing adjacent reporting needs may also find the right campaign analytics platform, but campaign dashboards do not substitute for design-based survey inference.
Pilot the shortlist on a real export with known missingness, awkward multi-select questions, weights, and at least one small subgroup. Time the full path from import to reproducible output. Choose the tool that makes assumptions hardest to hide, even if another product produces a prettier first chart.
Download PlotStudio AI and test it on your own survey export. Code executes locally in Python, each question gets an inspectable Analysis Page with tables, charts, tests, and interpretation, and results export to Jupyter or PDF for review. Start at PlotStudio AI with a real file and judge the audit trail yourself.