
Cross platform analytics joins measurements from separate platforms for analysis. Since their reports use different definitions and identities, totals can conflict. Researchers must check whether records are comparable and deduplicated before combining them, document how identities and measures were matched, and report what remains uncertain. The Nielsen's 2024 cross-media analysis offers context on cross-media measurement, but join validity depends on the records and methods used.
What Cross Platform Analytics Means for Researchers
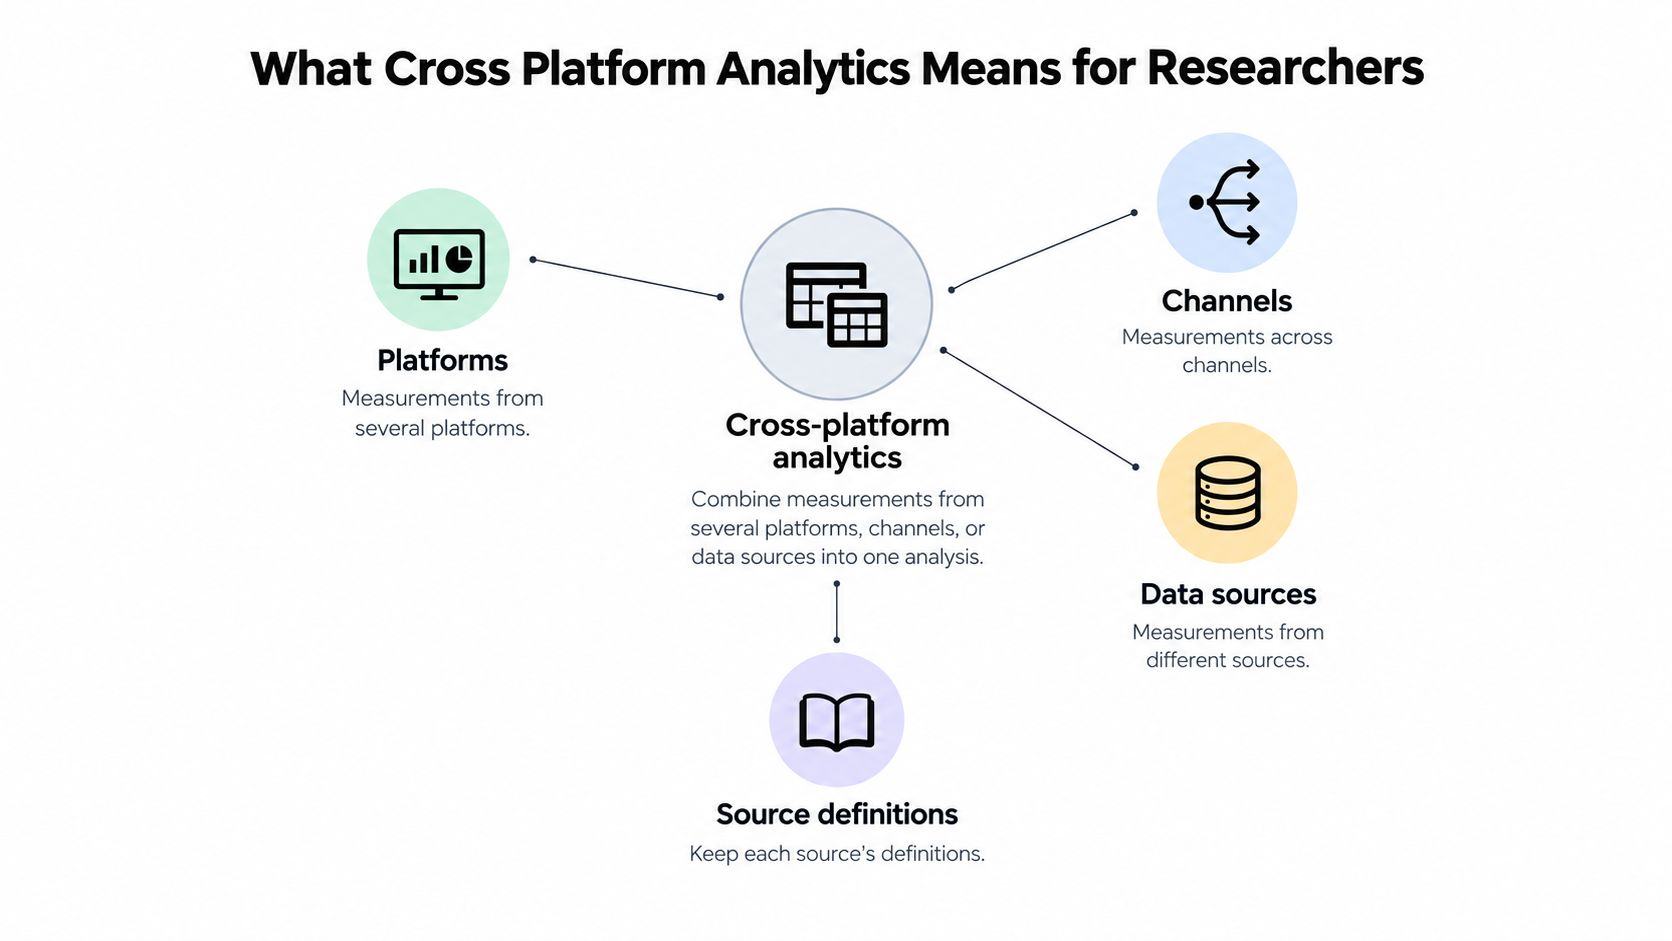
Cross platform analytics combines measurements from different platforms, channels, or data sources in one analysis. The key test is whether the records can validly be joined: do their definitions match, do they represent distinct units, and how complete is each source? A defensible result documents those checks and the uncertainty left afterward.
Consider two survey forms filed under different IDs. They appear to represent two respondents, but may belong to one person who enrolled again. Counting both as separate participants gives that person extra weight in every estimate. The same identity question arises in survey panels, hospital registries, and administrative records, even when the sources have no advertising data.
A join can run successfully while still producing an invalid comparison. For example, two sources may use the same label for a measure but define it differently, or may cover different groups. Before combining their numbers, check the unit of analysis, the meaning of each field, overlap between records, and gaps in coverage. Record the matching rules, exclusions, and limitations so another researcher can assess how they affect the result.
Four questions the discipline answers
- Distinct units. How many different people, households, or other units appear across the sources?
- Duplicated exposure. How much of the total comes from the same unit counted more than once?
- Contribution. Which source is associated with the outcome once overlap is considered?
- Confidence. How much does the result change when the joining rule changes?
The work proceeds from records to conclusions: capture events or records, identify the unit behind each, join matching records across sources, then measure. Errors often begin during identification or joining, before any metric is calculated. Researchers should therefore document those decisions and report how much uncertainty remains in the final estimates.
Five Problems That Break Cross Platform Joins
| Problem | What Goes Wrong | Error Type |
|---|---|---|
| Identity resolution | One person appears under several IDs, or one ID covers several people | Duplicated or merged rows |
| Event schema | The same label, such as view or session, means different things | Mislabeled rows |
| Data pipelines | Time zones, late-arriving events, reloaded batches, and schema drift affect records | Missing or duplicated rows |
| Attribution | Last touch credits one channel for several contributing touchpoints | Biased conclusion |
| Privacy and consent | Opt-outs and aggregation thresholds remove rows unevenly | Missing or biased rows |
Identity resolution can fail without changing any visible field. A panel respondent replaces a phone, receives a new device ID, and appears as a new participant. The sample count rises, but the number of people does not. Any per-person rate then uses the wrong denominator.
Event schema problems concern meaning, not whether a join runs. Two platforms may export a column called session, while one ends sessions after inactivity and the other ends them at logout. The records match by field name, but the joined values do not represent comparable events.
Where records and conclusions go wrong
Data pipelines can change counts even when definitions stay fixed. If a failed batch is reloaded without deduplication, that day's events may appear twice. If one platform stores local time and another UTC, events can fall on different calendar days. Check reload handling, timestamp conventions, late arrivals, and schema changes before comparing daily totals.
Attribution affects the conclusion drawn from records. A last-touch rule assigns all credit to one channel, even when several touchpoints preceded the outcome. The other channels can then appear ineffective. Removing them on that basis may also remove exposures that contributed to the final touch.
Privacy and consent can leave some groups with fewer records than others. People who decline tracking may differ from those who consent, while aggregation thresholds can suppress small groups. Compare coverage across segments and report which populations the joined data represents.
Missing identity links aren't only a compliance issue. They determine which conclusions you can defend.
In a 2025 cross-media report on attribution trust, 74% of surveyed organizations said privacy regulations create costly measurement blind spots, and 41% reported increased challenges in cross-channel attribution. The report also attributes 68% to IAB Europe respondents concerned about lack of cross-platform data access and transparency. These figures describe different concerns, so treat each as a separate signal rather than a shared measure of join quality.
The table's error types overlap: identity resolution and pipeline failures can duplicate rows, while pipeline and privacy issues can leave rows missing. Checks should therefore target the mechanism, not just the visible error. Verify identity uniqueness, event definitions, pipeline completeness, attribution rules, and consent-related coverage. Then document any uncertainty that remains before combining results.
Choosing Between Client-Side IDs, Server-Side Tracking and Event Hubs
| Architecture | Where Events Are Captured | Identity Method | Main Risk | Best Fit |
|---|---|---|---|---|
| Client-side IDs | Browser or app SDK writes events directly | Platform or cookie IDs that reset or expire | Blockers and consent refusals drop events | Single-platform products and fast setup |
| Server-side tracking | Your own server receives and forwards events | First-party user ID set at login | You own uptime and the endpoint | Products needing a controlled schema |
| Unified event hub | Every source streams into one warehouse or queue | Canonical ID mapping table | Mapping errors reach every report | Many sources and several analysts |
The comparison below shows the three capture paths side by side.
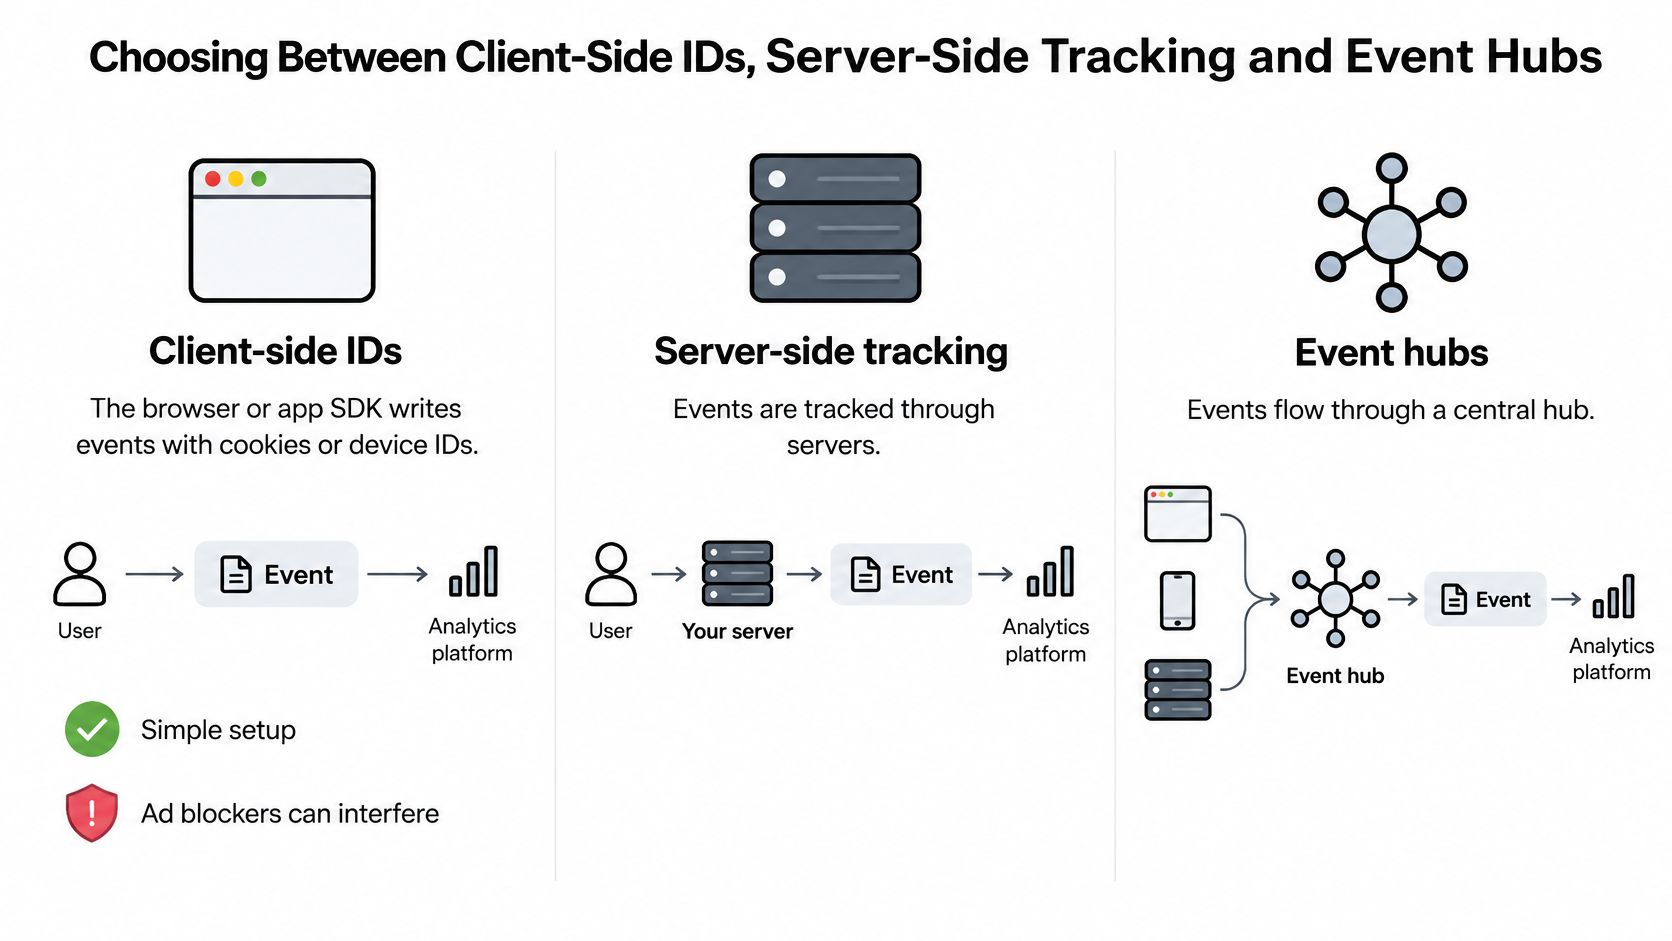
A mail-room analogy keeps them distinct. Client-side capture is letters posted directly into each recipient's mailbox, fast but easy to block or lose. Server-side tracking is a central sorting office you run yourself, where you stamp each letter before it moves on. A unified event hub is one archive where every letter gets indexed under a shared catalogue.
What each choice costs you
Client-side IDs are the simplest to install. The browser or app SDK writes events using cookies or device IDs, and you're collecting data quickly. The weakness is that you don't control the environment. Ad blockers stop events from firing, consent refusals remove them, and cookie expiry resets identity, so a returning person looks new. You're measuring whoever the browser lets you see.
Server-side tracking moves capture to infrastructure you own. Events pass through your server, which attaches a first-party user ID set at login, so identity survives across devices for signed-in users. You control the schema and fewer events vanish in the browser. In exchange, you own uptime, scaling, and the endpoint's reliability. If your server drops events, that's your data loss, and you'll need engineering time to prevent it.
A unified event hub sends every source into one warehouse or queue under a shared event schema, with a canonical ID mapping table translating each platform's identifier into one internal key. This suits settings with many sources and several analysts, and it's the usual pattern in research when survey records must link to administrative records through a documented linkage key. The risk is concentration. One wrong mapping rule propagates into every downstream report, so schema governance becomes real ongoing work rather than setup work. Guidance on bringing multiple sources into one governed environment covers the integration side of that decision.
The short video below walks through how these capture paths differ in practice.
A hybrid approach can work well. Server-side capture feeding a hub gives you controlled identity at collection and one governed place to join. Decide using three criteria. How much data loss can your conclusions tolerate, what latency do your decisions require, and how strong an audit trail do you need when someone asks where a number came from?
How to Build a Cross Platform Pipeline Step by Step
A sound pipeline takes raw exports in and produces a joined table at a declared grain, with metrics computed from written definitions rather than improvised during analysis.
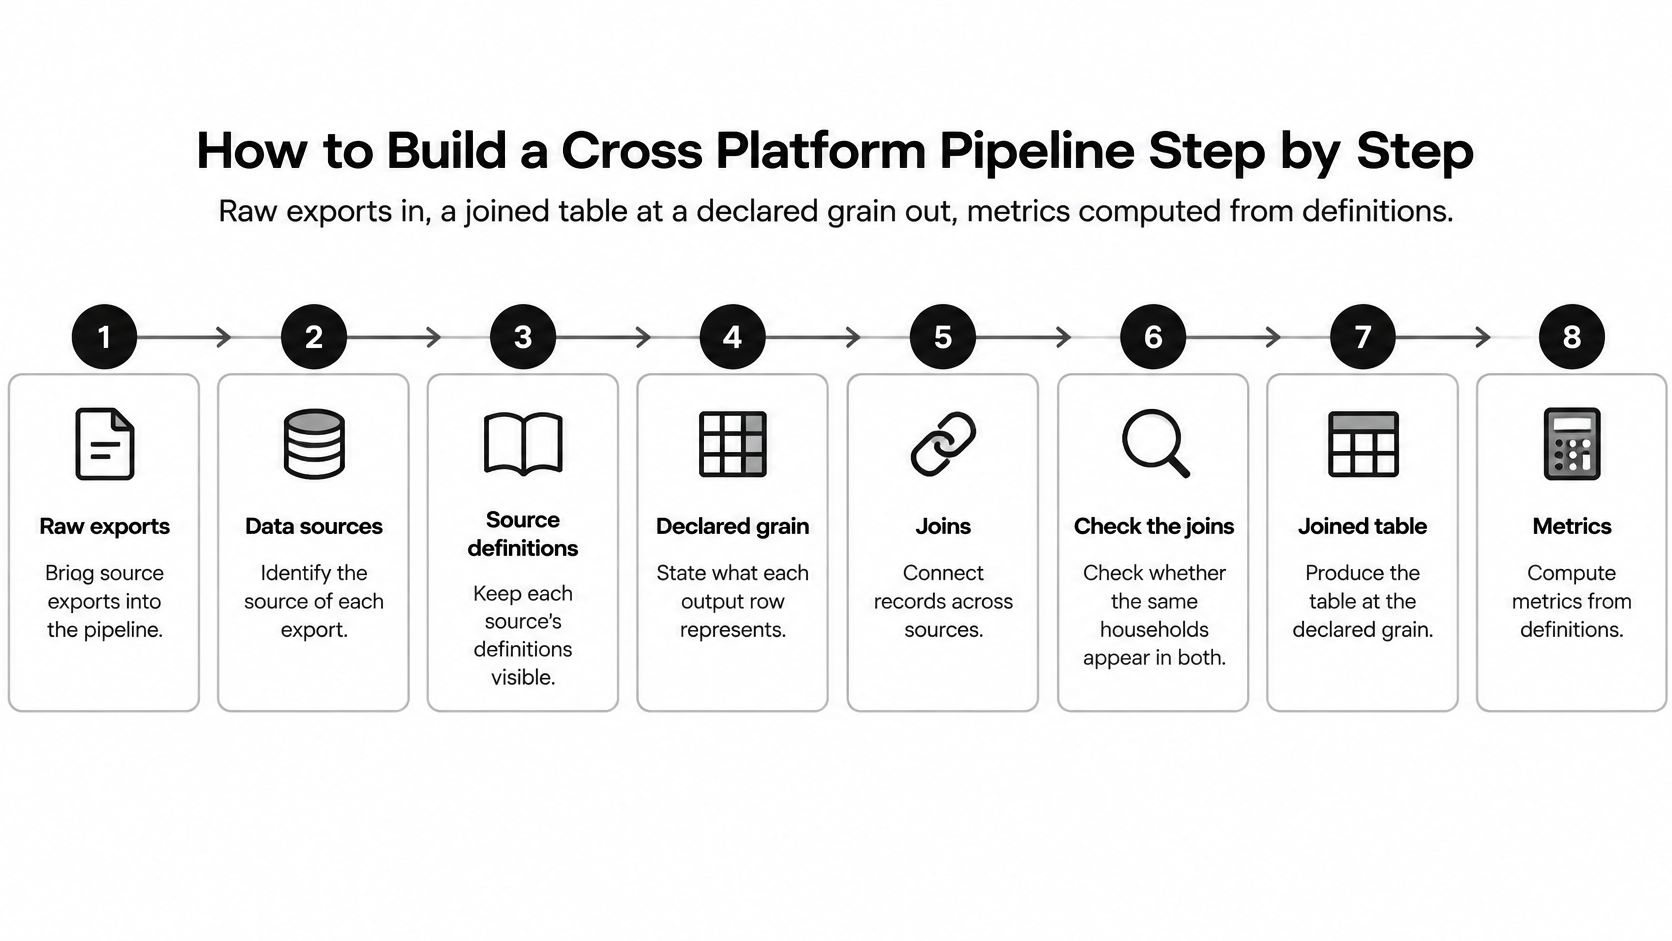
Inventory each source. Record the platform, export method, grain (event, session, user, or day), and time zone for every input. The common slip is assuming every timestamp is UTC, which misaligns sources that store local time without any obvious warning.
Write a metric dictionary. Give each metric one row with its platform definition, unit, numerator, and denominator. The slip is copying labels from dashboards without their definitions, so two metrics with the same name end up meaning different things.
Choose the join key and matching rule. Use a consented login ID or a salted hash of an identifier, and decide in advance whether unmatched rows are kept, flagged, or dropped. Dropping them without a record is the mistake, because you lose the ability to report how much of your data never matched.
Standardize the schema. Apply common field names, UTC timestamps, and typed columns, and put a source column on every row. Don't overwrite source fields. Once you replace the original values, you can't trace a strange result back to where it came from.
Deduplicate on a stated key before joining. Removing duplicates first keeps them visible and countable. Deduplicating after aggregation hides them inside totals, where nobody notices the inflation.
Build the joined table at the declared grain. Every row should represent exactly what you said it represents, and a match-rate column should show how each source pair linked. Teams working to unify revenue and product analytics hit the same requirement, since a joined table without match rates hides where the linkage failed.
Compute metrics from the dictionary. The joined table supplies rows, the dictionary supplies meaning. If a metric's denominator can't be reconstructed from documented fields, it isn't ready to report.
Log each run. Record export dates, the transformation version, and row counts before and after each step. These counts are what make a later discrepancy diagnosable instead of mysterious.
Working rule. If you can't state what one row in your joined table represents, you don't have a dataset yet. You have a pile of records.
The grain decision in step six deserves emphasis because it's where capable analysts most often get confused. Joining event-level data to user-level data without aggregating first multiplies rows, and every subsequent count inherits that multiplication. Declare the grain, aggregate each source to it, then join. The checks in the next section run against this joined table before any metric leaves your workspace.
Verification Checks Before Any Number Ships
Run these checks after each pipeline stage, not only at the end. A failure caught at staging costs minutes. The same failure caught after publication costs credibility. Keep raw tables untouched throughout, so every check can be repeated against the original inputs. Profiling each source before joining, covered in this overview of data profiling tools and checks, gives you the baseline counts these tests compare against.
| Check | How to Run It | Pass Condition | Failure Signal |
|---|---|---|---|
| Row-count reconciliation | Compare source export counts with staged rows per day | Difference within a tolerance set before the run, with each gap explained | Gaps on specific dates point to lost or reloaded batches |
| Match-rate audit | Count matched rows per join, split by segment | Match rate reported per source pair and segment | A match rate that varies by region, device, or consent group signals selection bias |
| Duplicate key test | Count rows per deduplication key after each load | Exactly one row per key at the declared grain | Duplicates inflate reach, frequency, and conversions |
| Definition spot-check | Sample 50 raw events per platform and read them against the metric dictionary | Each sampled event matches its documented meaning | Same label, different event, usually a schema mismatch |
| Join-rule sensitivity | Rerun the metric under strict and loose matching rules | Change stays within the tolerance stated in the report | Large swings mean the conclusion depends on the matching rule |
| Known-answer test | Insert a synthetic event with a known path and trace it | It appears exactly once in the output | A missing or doubled trace shows a pipeline fault |
Logging that supports the checks
Verification only works if someone can retrace what happened. The NIST Privacy Framework calls for audit and log records to be determined, documented, implemented, and reviewed in accordance with policy, incorporating data minimization. In practice, log dataset IDs, transformation versions, row counts, and who accessed outputs. Don't log personal fields you don't need. The log should prove the process, not become a second copy of sensitive data.
Finish with a reproducibility test. Rebuild the joined table from raw exports in a clean environment and confirm the headline metric matches within your stated tolerance. If it doesn't, your result depends on something undocumented in your workspace, and that dependency will surface eventually, usually at the worst moment.
Metrics and Governance That Keep Results Comparable
A unified table can create false precision. When each platform's metric measures a different underlying event, merging them into one column produces a number that looks exact and means nothing consistent. The 2025 IAB Unified Media Planning Playbook documents this directly, noting that YouTube, Hulu, and TikTok define a view differently, including differences in time spent, audibility, and viewability, and that completion and engagement rates are calculated differently across platforms.
| Metric | Platform-Native Definition | Comparability Grade | Reporting Label |
|---|---|---|---|
| View | Counted after a minimum time on screen on one platform and at auto-play start on another | Not comparable unless adjusted | Platform-native, observed |
| Completion rate | Different denominator on each platform | Adjusted after recomputing the denominator | Observed, recomputed |
Grading before merging
Keep platform-native definitions as separate columns rather than overwriting them with a blended value. Add a comparability grade to each metric, direct, adjusted, or not comparable, and label every value as observed or modeled. Report an interval or a data-quality grade beside headline numbers so readers see the uncertainty instead of discovering it later. The same discipline applies outside media, whether you're reconciling survey waves or tracking resale profits after marketplace fees, where each platform's fee definition changes what profit means.
Pair exposure with outcomes. Nielsen reported that in 2025, 60% of marketers incorporated both reach and frequency metrics and ROI when evaluating cross-media campaigns, as covered in reporting on that shift to holistic measurement. Reach without an outcome tells you distribution. An outcome without reach tells you nothing about efficiency.
Governance is people, not software. Name a data owner per source who answers definition questions, an analyst who documents transformations, and a reviewer who signs off before definitions change. Structured approaches to assigning those responsibilities are laid out in these data governance frameworks. The cautionary evidence is old but relevant. A 2012 survey of federal agencies found that among agencies using analytics, 46% reported low integration into management and only 8% reported high integration. A dashboard alone isn't governance.
Where Agentic Analytics Changes Cross Platform Work
A cross-platform report can disagree with another because the records do not represent comparable audiences. For example, the same households may appear in both sources but be counted as separate audiences. Before interpreting performance, check whether identities, definitions, and records support the comparison. Finding a mismatch can take hours of manual profiling.

The join problem varies by field. In marketing reach analysis, DISQO's 2025 consumer research offers an example of consumers researching on one device and seeing advertising on another. That pattern raises questions about whether device-level records capture the same path, but it does not by itself show how many records a join misses. In clinical research, linking hospital visits to a disease registry through a pseudonymous patient key calls for match rates by site. A weak match at one site could otherwise look like a treatment difference. In public health and economics, linking survey responses to administrative benefit records brings another concern: missing records may be related to the outcome being studied.
What an agent actually changes
Agentic analytics is data analysis performed by AI agents that can plan an investigation, execute analytical steps with real tools and code, inspect intermediate results, revise the approach, validate outputs, and synthesize a complete analysis. The agentic analytics reference page explains how this differs from chat-based tools. A generated answer gives you a result; an analysis should also show how the result was reached.
For cross platform work, an agent can help organize the checks before a join. It can profile sources for missingness, cardinality, and match rates, then propose a plan for review. With code execution, it can run those checks, inspect failures, and revise the analysis. The analyst still needs to confirm that records are comparable and deduplicated, and document unresolved uncertainty. A social media ai agent may handle content workflows, but research joins call for inspectable code and clear definitions.
PlotStudio AI provides Plan Mode to show an analysis plan before execution, runs Python locally, and supports Jupyter export. Those features can help preserve the plan and analysis code for review; they do not, on their own, establish a complete reproducible record. An agent also cannot know that a platform changed its view definition unless someone documents the change. Nor can it decide what counts as the same person. You set the matching rule and the estimand, then review the checks and report what remains uncertain.
Choosing a Tool That Passes Your Own Checks
Evaluate tools with a pair of sources you already report separately. Before trusting a joined result, check whether records are comparable, deduplicated, and documented. A general guide to AI analytics platform capabilities can help frame your evaluation, but the decisive evidence comes from how a tool handles your data.
Tests worth running
- Export test. Can you export data and results in a structured, machine-readable format? This lets you preserve the analysis if you change providers.
- Join diagnostics test. Does the tool show match rates, cardinality, and duplicate records before combining the sources? Check whether unmatched records remain visible.
- Dictionary test. Can you document each metric's definition and view it beside the output? Compare definitions across sources before treating similarly named measures as equivalent.
- Audit test. Can you inspect and rerun the code and transformations that produced the joined result?
- Execution test. Does the code run locally or in the cloud, and does that fit your data's sensitivity and access rules?
- Model test. Can you select the model provider, including an option to use your own key?
Two red flags should stop an evaluation. A single blended KPI with no visible definitions conceals whether the underlying measures are comparable. Results that cannot be rerun from raw exports cannot be checked against the original records, so they are not a defensible basis for research.
What is the best AI tool for research data analysis? Choose one that exposes the join rules and diagnostics your analysis requires, and lets you verify its outputs on your own sources. The right choice depends on the data, the matching rule, and the checks you need to retain.
Can an AI agent decide what counts as the same person? No. You define the matching rule and the estimand. The tool should make the rule and the resulting checks inspectable, including the uncertainty left by unmatched or duplicated records.
A useful trial ends with a documented decision: whether the joined view is defensible, which records failed to match, and what limitations remain. If the tool hides those details, keep the sources separate until you can establish comparability.