To do data analysis in qualitative research, pick a method first, then work through five steps: prepare and anonymize your data, read it closely, code it, group the codes into categories and themes, and test your interpretation against the raw text. Thematic analysis suits most interview studies. Software helps you organize and retrieve text, but you do the interpreting.
The hard part is volume and ambiguity. One hour of interview can produce 20 to 40 pages of transcript, and a manual transcription often takes 4 to 6 hours per hour of audio. With no plan, you end up with a stack of highlighted pages and no argument. Beginners often stop at coding, or summarize topics instead of building themes, and reviewers notice.
This guide walks through the method choice and the five steps using one worked example, with a codebook template, a memo template, and a tool comparison. We build PlotStudio AI, a desktop workspace for statistical analysis, so we also show where qualitative work meets numbers in mixed-methods projects.
What qualitative analysis is and how to pick a method
Qualitative data analysis is the systematic process of reading, coding, and interpreting non-numerical material, such as interview transcripts, field notes, documents, and open-ended survey answers, to find patterns of meaning. Your method decides how you code, so choose it before you open a transcript.
What qualitative data analysis involves
Quantitative analysis tests numbers with statistics. In qualitative analysis, you are the instrument. You read words, decide what they mean in context, and defend that reading with evidence. Software can sort and retrieve text, but it cannot decide what a participant meant.
Guides list anywhere from four to seven steps, and they split the same work in different ways. This guide uses five: prepare, read, code, build themes, and verify.
In qualitative work, the software organizes the data and you produce the analysis.
Six common methods compared
Researchers usually choose among a handful of established approaches. The table sets them side by side so you can match one to your question.
| Method | Best for | What you produce |
|---|---|---|
| Thematic analysis | Patterns of meaning across interviews or open-ended responses | A small set of themes backed by quotes |
| Content analysis | Categorizing and counting what appears in documents, media, or responses | Categories, often with frequencies |
| Narrative analysis | How people structure and tell their stories | Story structures, turning points, plots |
| Grounded theory | Explaining a social process from the ground up | A core category and a conceptual model |
| Discourse analysis | How language builds meaning, identity, or power | Patterns in word choice and framing |
| Framework analysis | Applied or policy research with set questions and team coding | A matrix of cases by themes |
Thematic analysis is the safe default when you are new to the work and have interviews or focus groups. Choose content analysis when you need counts across many documents. Choose grounded theory only when you plan to keep collecting data until a theory emerges.
Inductive or deductive, and a worked example
An inductive approach builds codes from the data itself. A deductive approach starts with codes drawn from theory or from your interview guide. Many studies mix both: a few starting codes, plus new ones as the data surprises you.
Throughout this guide we use one hypothetical study. You interview 12 new graduate nurses for 45 minutes each about their first year on the job, and you analyze the transcripts with inductive thematic analysis. The research question is "How do new nurses experience support during their first year?" Every example below comes from that study.
Step 1. Prepare and organize your data
Preparing your data means turning every recording and note into clean, anonymized, consistently named text that you can code. Do it right after each interview, not after the last one, so analysis can start while you are still collecting.
Transcribe and check every recording
Budget your time before you start. In our example, 12 interviews of 45 minutes give you 9 hours of audio. At 20 to 40 pages per audio hour, expect roughly 180 to 360 pages of text. Manual transcription at 4 to 6 hours per audio hour means 36 to 54 hours of typing.
An automatic transcription service saves most of that time, but you still need to listen back and correct names, medical terms, and mishearings. Decide in advance whether you transcribe verbatim, including false starts and filler, or in clean verbatim, and apply that rule to every file.
A transcript you have not checked against the audio is a draft, not data.
Anonymize and organize your files
Set up your file system before you code. A short routine keeps participants safe and keeps your later comparisons possible:

- Replace names, employers, and towns with participant IDs such as N01 to N12.
- Store the key that links IDs to real names in a separate, encrypted location.
- Name files consistently, for example
N03_interview_transcript.docx. - Record attributes such as role, unit, and months of experience in one spreadsheet.
- Back up your files, and follow your IRB or ethics approval on storage.
The attribute spreadsheet matters more than it looks. Later you will want to ask whether night-shift nurses describe support differently from day-shift nurses, and you can only do that if attributes were recorded at the start.
Choose a tool for managing the data
Pick your tool now, because moving a coded project between programs is painful. Computer-assisted qualitative data analysis software (CAQDAS) stores documents, lets you tag passages, and retrieves everything under a tag.
| Tool | Type | Good for |
|---|---|---|
| Excel or Google Sheets | Spreadsheet | Small projects, simple code-by-participant matrices |
| Taguette | Free, open source | Highlighting and tagging text documents |
| QualCoder | Free, open source | Coding text, images, audio, and video |
| NVivo | Commercial CAQDAS | Large projects with attributes, queries, and models |
| ATLAS.ti | Commercial CAQDAS | Large projects, networks, multimedia data |
| MAXQDA | Commercial CAQDAS | Mixed-methods work and team coding |
For a study of 12 interviews, a spreadsheet or a free tool is enough. Move to a commercial package when you have many documents, several coders, or media files. Whatever you choose, remember that none of them analyzes the data for you.
Step 2. Read, reflect, and write first memos
Read every transcript from start to finish before you code anything. The goal is to understand each participant's story as a whole, so your codes later do not strip passages of their context.
Read for the whole story
Read each transcript twice. On the first pass, read without a pen and just follow the story. On the second pass, mark what strikes you, including surprises, contradictions, and moments that confirm or break your assumptions.
Keep four questions in front of you while you read:
- What is this person trying to tell me about my research question?
- What did I not expect to hear?
- How does this account differ from the others I have read?
- Where do my own assumptions show up in how I am reading?
The last question is the one people skip. If you catch yourself irritated by a participant's complaints, that is data about your own position, and it affects how you interpret everything that follows.
Write memos as you read
A memo is a dated note recording a thought about the data, a code, or a relationship between them. Memos are where analysis actually begins, and they form part of your audit trail when you write up the method. Keep one file or one memo field per entry, using a consistent template:
Memo title:
Date and time:
Source: (participant ID, page or timestamp)
What I noticed:
Why it might matter:
Question for the next interview:
Related codes:
Early memos explore what participants are saying and doing. Later memos connect categories and test emerging explanations. Write a memo whenever you stop and think "that's interesting", even if it is one sentence.
Memos turn reading into analysis, and they prove to reviewers how your thinking developed.
Step 3. Code the data line by line
Coding means attaching short labels to segments of text so you can retrieve and compare them later. Code every segment that speaks to your research question, using the participant's own words where possible and your interpretation where needed.
Start with open coding
Open coding is a first pass through the text, line by line, asking "what is happening here?" You will use two kinds of codes. In vivo codes use the participant's exact words, such as "sink or swim". Interpretive codes are your label for what the passage means, such as "fear of asking questions".

Some practical rules keep this pass productive. Code meaning units, which can be a phrase or a paragraph, rather than every sentence. Allow several codes on one segment. Name codes for what is happening, not just the topic: "guessing alone at 3 a.m." tells you more than "night shift".
A good code names what is happening in the passage, not the topic it belongs to.
You can also distinguish manifest content, which is what participants say on the surface, from latent content, which is the meaning implied beneath it. Descriptive studies often stay at the manifest level. Thematic analysis usually pushes toward the latent.
Build a codebook
A codebook is your running list of codes with definitions. Without one, you will use the same label for two ideas by transcript five and two labels for one idea by transcript ten. Copy this template into your spreadsheet or tool:
Code: Alone on night shift
Definition: Participant describes working without a senior colleague available
Include when: No one to call, supervisor unreachable, unclear escalation
Exclude when: Short staffing without isolation (use "Short staffing")
Example quote: "I was alone on nights and nobody told me who to call." (N07)
Version note: Split from "Lack of support" after transcript 6
Revise the codebook as you go. Merge duplicates, split codes that hold two ideas, and note each change. Version notes are cheap to write and valuable when a reviewer asks how your codes evolved.
Check coding consistency
If more than one person codes, have a second coder independently code two or three transcripts, then compare. Discuss every disagreement and update the codebook. Many teams report Cohen's kappa for the overlap. Landis and Koch label 0.61 to 0.80 as substantial agreement and above 0.80 as almost perfect.
Not every method wants this. Reflexive thematic analysis treats the researcher's interpretation as part of the method, so its authors argue for discussion and reflection instead of agreement statistics. Match your consistency check to your method, and state which one you used.
Use AI as an aid, not an analyst
You can use ChatGPT or a similar model to suggest first-pass codes, draft a codebook from a sample, or summarize a long transcript. The risks are real, though. A model can invent quotes, flatten ambiguity, and miss context that you picked up in the room.
Treat its output as a suggestion you verify against the transcript. Also check your ethics approval before you paste any participant material into an external tool. If the data is identifiable, assume it should not go there without explicit permission.
Step 4. Group codes into categories and themes
Group your codes into categories by similarity, then identify themes by asking what idea runs through several categories. A category describes what participants talked about. A theme explains what it means.
Sort codes into categories
Start by listing every code with how many participants used it. Then cluster related codes. In a spreadsheet, that means a column for the category next to each code. In CAQDAS, you drag codes into a tree structure, where parent nodes hold child codes.
In our nurse study, an initial pass could easily produce well over 100 codes. Clustering reduces them to a dozen or so categories, such as "Gaps in formal support", "Informal support", and "Fear of asking". Then reread the data under each category to confirm every excerpt belongs. A passage that does not fit needs a new code, and that code may reveal a new category.
Turn categories into themes
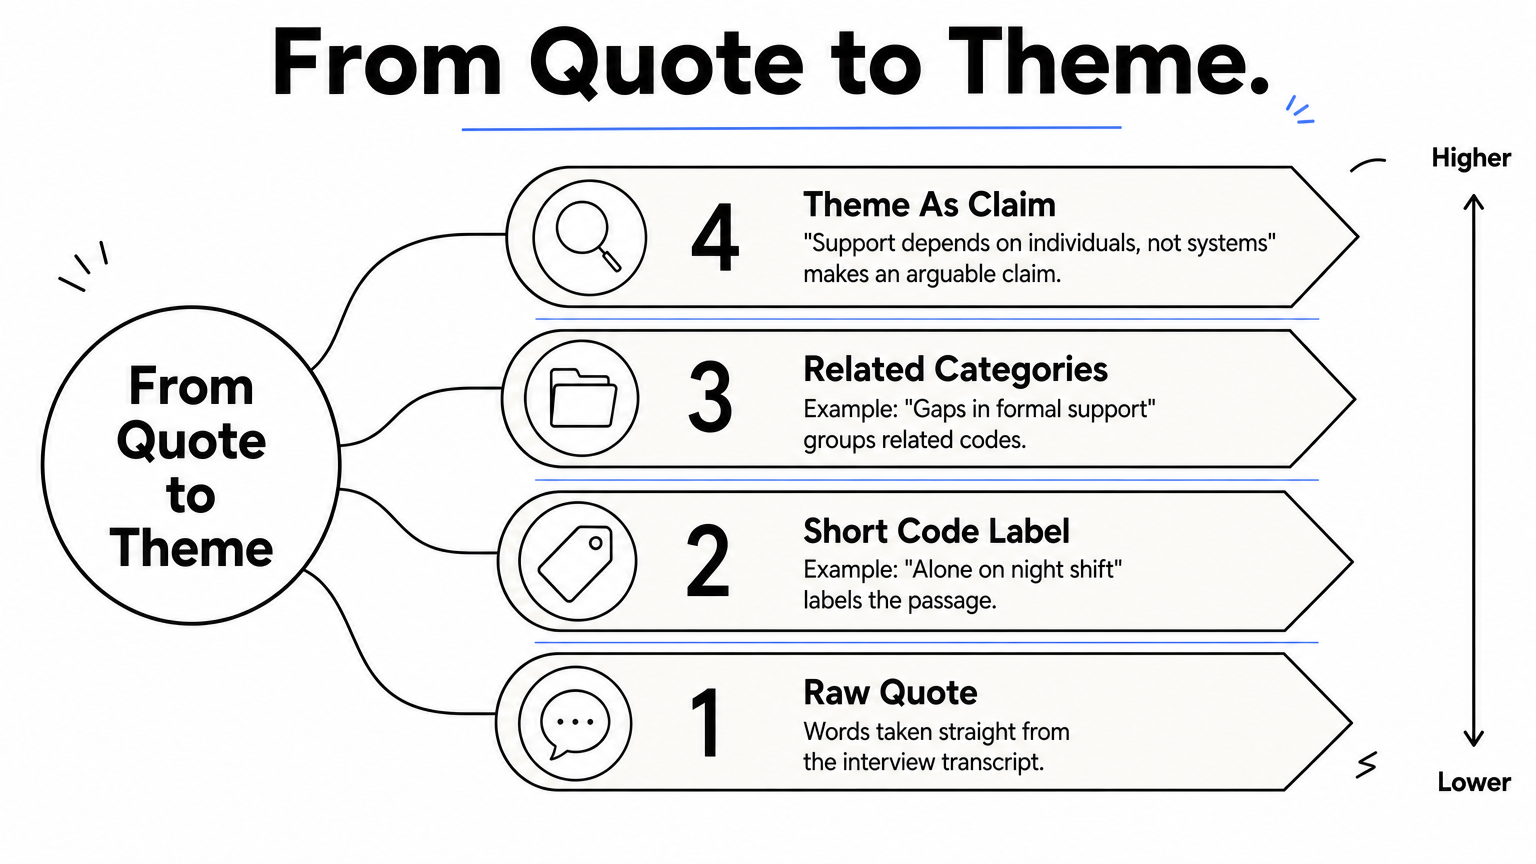
A theme threads the underlying meaning through several categories. "Support" is a topic. "Support depends on individuals, not systems" is a theme, because it makes a claim you can argue with evidence. The table shows the full chain for three hypothetical quotes.
| Quote | Code | Category | Theme |
|---|---|---|---|
| "I was alone on nights and nobody told me who to call." | Alone on night shift | Gaps in formal support | Support depends on individuals, not systems |
| "My preceptor texted me after every hard shift." | Preceptor check-ins | Informal support | Support depends on individuals, not systems |
| "Orientation covered the software, not patients." | Orientation mismatch | Gaps in formal support | Support depends on individuals, not systems |
Most interview studies end with a handful of themes, often three to six. If you have fifteen, you probably have categories, and you need to ask what unites them.
A theme is a claim about the data, not a label for a topic.
Test each theme against the data
Before you accept a theme, run it through four checks:
- Do several participants support it, not just one vivid speaker?
- Can you state it in a single sentence that someone could disagree with?
- Is it distinct from your other themes, or are two themes really one?
- Which participants contradict it, and what does that tell you?
Go back to the transcripts for every failed check. Negative cases are the most useful evidence you have, because they show where your theme stops working and sharpen its boundaries.
Step 5. Verify, interpret, and report your findings
Verify your interpretation by testing it against the raw data, then report each theme with its evidence. Analysis is finished when new transcripts stop producing new codes and your themes survive a hard look from someone else.
Check saturation and avoid premature closure
Saturation means additional data no longer adds new codes or categories. Premature closure is the opposite error: you stop at the first tidy set of themes, and participants' experiences are only partly understood. It is the most common failure in qualitative analysis.
Avoid it by analyzing while you collect. If transcript 8 surprises you, you can ask about it in interviews 9 to 12. Postponing all analysis until data collection ends removes that option and leaves you with a mountain of text to code at once.
Strengthen trustworthiness
Reviewers will ask how you know your reading is credible. These practices answer that question:
- Audit trail: keep your memos, dated codebook versions, and decisions.
- Peer debriefing: walk a colleague through your coding and themes.
- Member checking: share findings with participants and ask whether they recognize their experience.
- Negative case analysis: report where the data contradicts a theme.
- Reflexivity statement: say how your background shaped your reading.
If a reviewer cannot trace a theme back to participant quotes, the analysis is not finished.
Write up themes and connect them to numbers
Structure each theme the same way: state the claim, define it, give two or three short quotes with participant IDs, and note variation. You can say "8 of 12 participants described this" to show breadth, but avoid percentages and statistical language with samples this small.
If your design is mixed methods, or you want to compare how often a theme appears across groups, export a participant-by-theme table as a CSV. PlotStudio AI is a desktop workspace for datasets like that. You can ask in plain English whether theme presence differs by shift, and it plans the test, runs Python on your machine, and builds the figure. It does not read or code your transcripts, so the interpretation stays with you.
With 12 participants, review the proposed test in Verification Mode, because small counts usually call for exact tests rather than chi-square. Also check your IRB rules before you upload anything, since information sent to a model provider follows that provider's policies. The free trial includes 30 credits and needs no credit card.
Where to go from here
Good qualitative analysis is a disciplined sequence: choose a method that fits your question, prepare and anonymize the data, read until you know each participant's story, code with a living codebook, build themes that make claims, and verify them against the evidence. Tools and AI can speed the sorting. They cannot read a transcript the way you can.
Start with your next transcript, not with software. Write one memo, code one interview, and see whether your codebook holds. If your project includes numbers alongside the words, you can try PlotStudio AI free on the coded table and keep your interpretation of the interviews where it belongs, with you.