Only 12% of surveyed organizations had governance embedded across the data lifecycle with automation and business accountability, according to SAPinsider's enterprise data and analytics benchmark. That's the buying problem: enterprise BI software connects sources, prepares data, defines shared metrics, and delivers reports at scale, but trustworthy numbers require accountable owners and reproducible workflows, not just dashboards.
What Enterprise BI Software Does and Why Enterprises Buy It
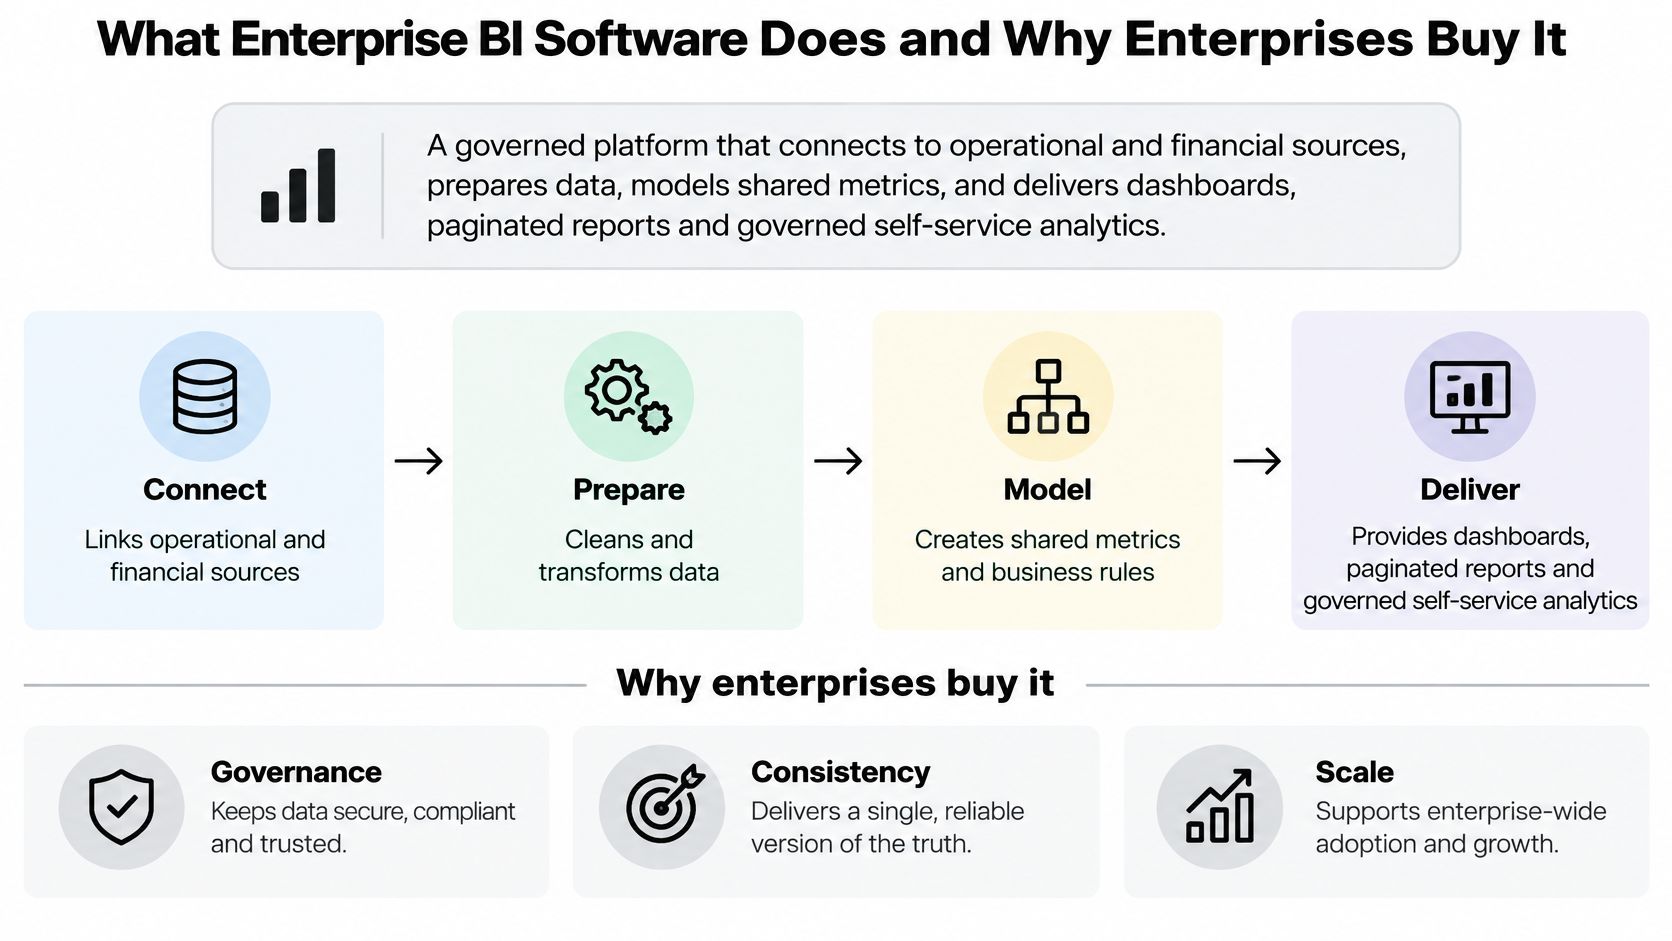
Enterprise BI software is a governed analytics platform, not a chart builder with more users. It connects operational and financial sources, prepares data, models shared metrics, and delivers dashboards, paginated reports, and governed self-service exploration. The intended result is straightforward: the same number should mean the same thing across departments.
In Gartner's BI and data analytics market guide, 81% of surveyed business leaders said their organizations used BI and analytics software, while 46% reported adopting it within the previous two years; banking and retail/food-service each had more than 30% of respondents reporting use. This is a management capability extending beyond specialist reporting teams.
The workflow below shows why connection, preparation, and modelling matter before delivery.
The difference becomes visible when departments disagree
Say a retailer's finance team reports revenue after returns, while marketing reports sales before returns. Distribution groups orders by shipment date; finance uses the accounting period. Each spreadsheet may be internally consistent, yet executives can't reconcile the totals.
An enterprise deployment should resolve those differences explicitly. Analysts define which transactions qualify, which date controls reporting, and which adjustments apply. Users then explore certified measures rather than rebuilding the calculation independently.
That changes the role of analytics. Instead of waiting for periodic executive dashboards, inventory managers can review replenishment needs, distribution teams can investigate fulfilment delays, and marketing managers can assess advertising performance using approved definitions.
Software supports better decisions but doesn't guarantee them
The economic argument concerns management practice, not software ownership. A study of large publicly traded firms associated data-driven decision-making with output and productivity approximately 5–6% higher than expected, after accounting for other investments and information-technology usage.
That finding isn't a promised return from purchasing a BI licence. Managers still need to ask useful questions, act on findings, and check whether the underlying measures represent the business accurately.
Buying principle: Judge enterprise BI by whether people can repeat a trusted decision workflow, not by whether a demonstration produces an attractive chart.
A single analyst can clarify spreadsheet assumptions in a conversation. Enterprise infrastructure must preserve those assumptions for people who weren't present when the analysis was built.
Core Capabilities to Compare Across Platforms
Capability checklists are where BI evaluations go wrong. Vendors present features as a flat list, but in production they behave as a dependency stack: connectivity feeds preparation, preparation feeds modelling, and modelling determines whether the numbers people explore and report can be reproduced. A weakness near the bottom of that stack invalidates everything displayed above it.
A complete capability scope spans data-source connectivity, preparation, semantic modelling, visualization, reporting, natural-language query, automated insights, and content management. That breadth is a useful corrective to evaluations dominated by how polished a demo dashboard looks.
Core enterprise BI capabilities and what to test
| Capability | What it covers | What to test in a proof of concept |
|---|---|---|
| Data-source connectivity | Databases, spreadsheets, cloud services, external feeds | Join two real sources with known differences and reconcile row counts to the source systems |
| Data preparation | Joins, type fixes, transformations, reusable logic | Rebuild an existing production transformation and compare outputs row by row |
| Semantic modelling | Shared measures, dimensions, hierarchies, entity relationships | Have two departments query the same metric independently and confirm one result |
| Interactive visualization | Filters, drill-down, cross-filtering, dashboards | Time a drill-down on your largest table under realistic concurrent load |
| Paginated reporting | Fixed-format, print-ready reports for finance and compliance | Reproduce a statutory or board report in its exact layout |
| Natural-language query | Plain-English questions translated into queries | Confirm the generated query is visible and matches your business definition |
| Automated insights | Alerts and automated explanations of metric changes | Verify an alert fires correctly on a metric change you already know occurred |
| Analytics catalog and lifecycle | Certified content, search, versioning, retirement of stale assets | Deprecate a metric as its owner and confirm downstream users see the change |
Test the assumptions behind the interface
A connector appearing in a product menu says little about integration quality. Test what happens when authentication tokens expire, when a source table is deleted, when timezones cross, and when the schema changes mid-quarter. For joins, inspect unmatched records and unexpected row multiplication rather than stopping at whether the operation completes.
The semantic layer decides whether two analysts get the same answer. It should hold shared measures, dimensions, hierarchies, and relationships while still permitting exploration. If a revenue figure shifts when an analyst adds a product attribute, the model contains an incorrect relationship or aggregation rule, and no amount of visual polish compensates for it.
Natural-language query inserts another translation step between a question and the data. Ask an ambiguous question, such as which customers churned last quarter, then inspect how the platform resolved customer eligibility, quarter boundaries, and the definition of churn. A fluent explanation of the result does not prove the generated query matched your intent.
Paginated reporting needs its own acceptance test. Producing a dashboard screenshot tells you nothing about whether the platform can deliver a fixed-format report with stable headers, footnotes, page breaks, and predictable export behaviour, which is what finance and compliance consumers receive.
Score the workload rather than the feature label
Rate each capability against one of four categories:
- Required: The capability must pass before purchase, such as access enforcement or financial reconciliation.
- Operational: The capability works, but consumes measurable administration or specialist effort.
- Unproven: The vendor demonstrated it, but your team has not reproduced it with representative data.
- Out of scope: The capability is not needed for the planned deployment.
Score both today's workload and the workload you expect three years from now. A failed modelling requirement cannot be offset by awarding extra points for visual polish. A platform can be excellent at exploration and still be the wrong choice for maintaining certified enterprise metrics.
Deployment and Integration Models Compared
Where must the data remain? Answer that before comparing deployment convenience. Distinguish source storage, cached extracts, query execution, model inference, logs, and exported results, because they may occupy different environments.
Deployment labels describe architectures, not security guarantees. A self-managed installation still needs secure operations, while a hosted service still needs appropriate identity, residency, and contractual controls.
Enterprise BI deployment models
| Deployment model | Where data and compute run | Best fit | Main trade-off |
|---|---|---|---|
| Cloud SaaS | Vendor-hosted, in a chosen provider region | Fast rollout across many departments | Less control over residency and upgrade timing |
| Self-managed on-premises | Your data centre | Strict residency and legacy sources | Higher infrastructure and staffing cost |
| Hybrid | Warehouse in your environment, BI layer hosted | Regulated data alongside cloud analytics | Two environments to secure and govern |
| Embedded | Analytics served inside your product through an API | Customer-facing reporting | Tenant isolation and licensing complexity |
| Local desktop with own model key | Analysis on the analyst's machine, AI calls through your own provider key | Sensitive files, individual or small-team analysis | No central semantic layer or shared access |
Follow the complete data path
For cloud SaaS, test where extracts and backups reside and what happens when a source becomes unavailable. For on-premises, test installation, recovery, patching, and access to legacy systems. Hybrid evaluations should include gateway failure and the propagation of identity between environments.
Embedded deployments require tests that ordinary internal dashboards don't. Authenticate as separate customers and attempt to retrieve another tenant's records through filters, exports, and API requests. Confirm how usage is licensed before exposing analytics to customers.
For a property-data workflow, teams planning to integrate with RealtyAPI.io should include its integration documentation in connector design, then verify identifiers, refresh behaviour, and error handling against their actual application. A broader data integration solutions evaluation should also distinguish moving data from querying it where it already resides.
Local Python execution doesn't mean every part of an AI workflow stays local. Inspect what context goes into model requests and where those requests are processed. Our bring-your-own-key option lets us use the AI model your institution or employer already pays for, changing both the cost discussion and the approved data path.
The risk of unsanctioned tools is concrete: IBM's 2025 Cost of a Data Breach report found that 20% of studied organizations experienced a breach involving shadow AI, with those incidents adding approximately $200,321 to average breach costs. Those findings concern breached organizations, not all enterprises, but they strengthen the case for approved connections, sanctioned AI tools, and traceable sharing.
Governance and Security Controls That Keep Numbers Trustworthy
Governance isn't a policy checklist. It's an operating model that determines who can define a measure, approve a change, investigate a discrepancy, and withdraw an unreliable result.
Gartner's descriptions of data-quality and governance capabilities include profiling, monitoring, transformation, matching, active metadata, remediation, and policy enforcement. Buyers should translate those categories into observable controls rather than accepting a governance badge.
Measure failures before publishing reports
Capture these measurements on representative data:
- Missingness and duplicates: Identify affected fields, business entities, and reporting groups.
- Referential integrity and join match rates: Show which records lack valid parents or fail to match.
- Freshness: Compare source-update times with the reporting cutoff.
- Lineage coverage: Identify transformations and outputs without traceable inputs.
- Policy violations: Record unauthorized access attempts and inappropriate exports.
These measurements answer different questions. Profiling can expose a changed column type before a scheduled report fails. Match-rate analysis can reveal that a customer join excludes valid orders. Certified metadata can steer analysts away from an obsolete field.
A quality score alone isn't enough. Require the underlying checks, affected records, and remediation decisions so a steward can determine whether the problem changes the business conclusion.
Assign authority as well as ownership
A metric owner needs decision rights, not merely a name beside a dashboard. Specify who approves the definition, who maintains the implementation, and who resolves disagreements between departments.
Centralized ownership suits measures that must remain comparable across the organization, such as consolidated financial reporting. Federated ownership suits domain-specific measures when business units need local expertise or different operating definitions. Federation still requires shared naming, documentation, and escalation rules.
Say regional teams measure active customers differently because their products have different purchase cycles. Don't hide the discrepancy inside separate dashboards. Preserve the regional definitions, label them clearly, and create an approved enterprise measure for cross-region comparisons.
A practical business intelligence best-practices framework should connect these responsibilities to release approval and retirement, not stop at dashboard creation.
Accountability means someone can explain why a metric changed, approve that change, and identify every report affected.
Treat access and change history as analytical controls
Test restricted users at the data layer, including exports and indirect queries. Row-level restrictions should protect sensitive records while allowing approved aggregates, without exposing individuals through narrow filters.
Retain dataset versions, transformation logic, approvals, execution timestamps, and methodological assumptions. For research outputs, preserve generated code and notebook exports alongside the written interpretation.
The decisive governance exercise is small: select a shared metric, trace it to source, and change its definition. Check who approved the edit, which dependent reports changed, how users were notified, and whether the previous result remains reproducible.
Where Embedded, AI-Assisted and Real-Time Analytics Change Buying Decisions
New analytical interfaces change where buyers need evidence. A customer-facing chart, a forecast, and an autonomous investigation have different failure modes even when the vendor groups them under AI-powered BI.
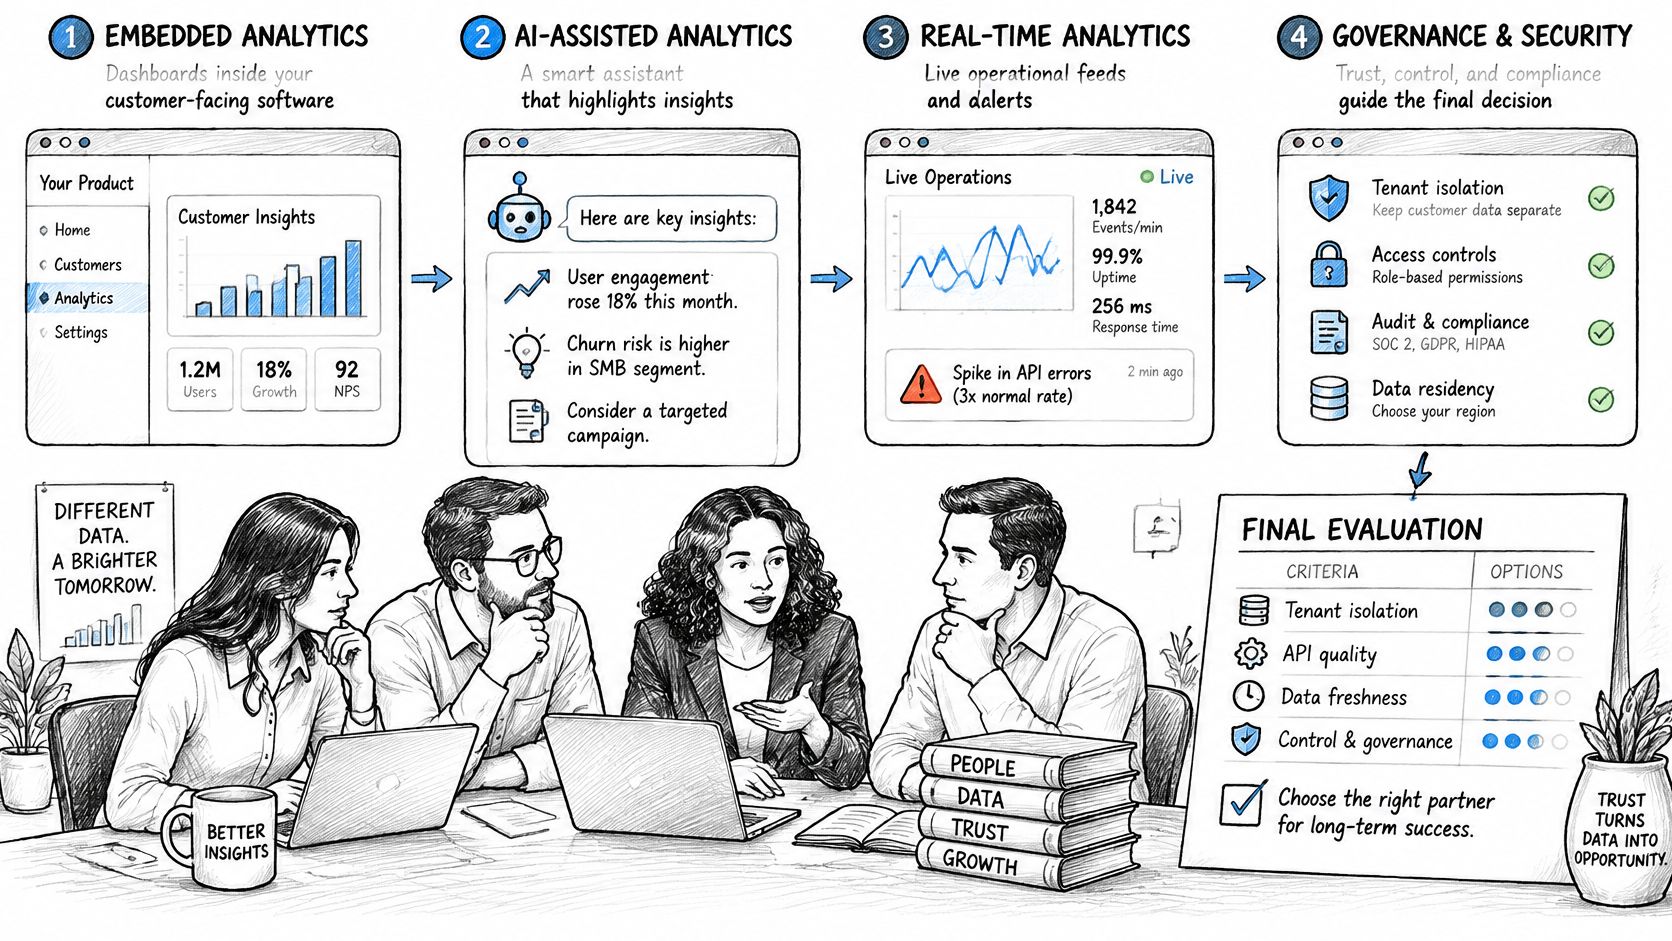
The illustration provides a visual overview of the analytical and security concerns.
Verify the control that each capability changes
Embedded analytics places reporting inside a customer-facing product. Verify tenant isolation through the complete application, including API responses and downloaded files, rather than judging only the dashboard experience.
Machine learning inside BI adds forecasting, anomaly detection, and segment discovery. Verify that users can inspect the training window, model assumptions, validation design, and relevant diagnostics. A historical fit isn't evidence of reliable future predictions.
Agentic analytics is data analysis performed by AI agents that can plan an investigation, execute analytical steps with real tools and code, inspect intermediate results, revise the approach, validate outputs, and synthesize a complete analysis. Verify that the system exposes those steps. A multi-step investigation is easier to audit than a single answer only when its code, intermediate results, and checks are available.
Real-time analytics reduces the delay between events and reporting. Verify how the system handles late arrivals, duplicates, corrections, and incomplete windows. Faster delivery also means invalid records can influence decisions before a steward reviews them.
For a visual complement to the workflow discussion:
Adoption isn't assurance
A 2025 global enterprise analytics survey reported 43% of organizations using AI-powered analytics in production, while only 8% of employees in most firms used advanced analytics tools and 24% of organizations planned to triple that participation within 12 months. Production deployment and workforce readiness are distinct milestones; neither establishes analytical validity.
Automation also needs reconciliation controls. Finance teams can use CEF reconciliation software insights from CEFCore as context when specifying how ledger discrepancies should be investigated rather than merely summarized. The same distinction matters in business intelligence automation: detecting a change isn't equivalent to explaining its cause.
Release gate: Before acting on a high-stakes AI-generated figure, require traceable inputs, validation evidence, stated uncertainty, known failure conditions, and a named human reviewer.
Descriptive comparisons don't establish causation. Clinical, policy, and financial decisions require review appropriate to their consequences, regardless of how confidently the software narrates its answer.
Role-Specific Value and Common Enterprise Use Cases
The same platform serves different roles, but it doesn't remove their different analytical requirements. A business analyst needs consistent reporting; a researcher may need an adjusted estimate with defensible assumptions.
Treat the gaps below as requirements to test, not universal limitations of every product. Extensions and connected analytical environments can change what a deployment supports.
Role-specific value and gaps in enterprise BI
| Role | Core question | What enterprise BI delivers | Gap to plan around |
|---|---|---|---|
| Business analyst | Which region missed target, and why? | Governed dashboards and drill-downs | Ad hoc questions wait on the certified model |
| Data scientist | Which features drive churn? | Governed feature data and exports | Limited support for model training and iteration |
| Product manager | Did the release change activation? | Cohort and funnel reports on a schedule | Event-level detail often lags the dashboard |
| Researcher | Does the treatment effect hold after adjustment? | Shared datasets and repeatable queries | Few inferential tests such as adjusted estimates |
For product teams, the critical distinction is between observing activation and attributing a change to a release. A product manager analytics workflow should preserve event definitions, cohort eligibility, and exposure timing before interpreting a funnel.
Agree on the measure before building the view
Monthly revenue and margin reporting needs an approved treatment of returns, discounts, tax, currency conversion, and cost allocation. Specify the accounting cutoff and whether margin refers to gross margin or another contribution measure. Otherwise, business-unit comparisons can reflect accounting differences rather than operating performance.
For inventory and distribution monitoring, define the event that constitutes stock availability and the point at which an order counts as fulfilled. A warehouse can report goods as dispatched while the customer-facing team still considers the order incomplete. Choose measures such as stockout status, available inventory, and on-time delivery only after resolving those boundaries.
Customer retention tracking requires an eligible starting population, an inactivity rule, and a treatment of reactivation. Subscription cancellation, account inactivity, and absence of repeat purchase aren't interchangeable churn definitions.
Useful acceptance questions include:
- Business analysts: Can the regional variance be decomposed without changing the certified total?
- Data scientists: Can feature extracts be reconstructed using only information available at prediction time?
- Researchers: Can the analysis preserve participant-level structure and distinguish exploratory findings from confirmatory tests?
The practical conclusion is that BI should distribute validated business measures, while specialist workflows investigate questions those measures can't answer. Requiring a dashboard platform to handle every research task can obscure the capabilities that matter most to its main users.
Enterprise BI Versus Notebooks and Ad-Hoc Tools
Choose according to who must trust the output and how many people must reuse it. Enterprise reporting and investigative analysis are related workloads, but they fail in different ways: a governed dashboard loses credibility when a certified number can't be reconciled, and an investigation loses credibility when its steps can't be retraced.
PlotStudio AI addresses the second failure mode. Users upload a dataset and state an objective; a coordinated team of agents plans the methodology, writes and runs Python on the user's machine, inspects the output, and saves a reproducible Analysis Page.
PlotStudio AI, enterprise BI and notebooks compared
| Dimension | PlotStudio AI | Enterprise BI platforms | Notebooks and ad-hoc tools |
|---|---|---|---|
| Primary user | Analysts, researchers, and teams without a data team investigating a dataset | Business users across departments | Individual analysts and data scientists |
| Shared, governed metric definitions | Workspace-level profiles rather than an enterprise semantic layer | Strong through a certified semantic layer | Definitions generally live in code |
| Multi-step investigation | Plans, runs Python, inspects output, and revises | Primarily dashboards and queries; investigate added AI capabilities separately | Author-directed, step by step |
| Code and methodology visibility | Generated Python and a description of each step | Inspect model and query access in the selected platform | Full when the author documents the work |
| Local execution | Code runs on the user's machine | Usually server-hosted | Local or hosted according to setup |
| Scale to many concurrent users | Analysis runs on the user's machine; sharing happens through the exported PDF report or Jupyter notebook bundle | Designed for concurrent use | Requires shared infrastructure for wider delivery |
| Reproducibility | Saved Analysis Pages and Jupyter export | Requires version control and controlled model releases | Requires disciplined code, data, and environment management |
Separate investigation from distribution
The workflow exposes the generated code and a textual description of each analytical step. Plan Mode lets the analyst review, edit, and approve the methodology before execution, and charts, statistics, methods, and outputs stay attached to the saved analysis. Those artifacts make review possible. They don't prove that every methodological choice was correct.
The distinction matters because an answer is an output, while an analysis is an investigation. For a treatment-effect question, reviewers need to examine adjustment variables, missing-data handling, assumptions, confidence intervals, and sensitivity to alternative specifications, not just the reported coefficient. A platform that exposes the reasoning lets a second analyst challenge it. A platform that shows only the result asks for trust it hasn't earned.
For teams weighing AI tools for data analysis, PlotStudio AI functions as a Julius AI alternative when multi-step investigation, local Python execution, methodology visibility, and reproducibility rank highest. That comparison doesn't make it a substitute for centralized enterprise access or a shared semantic layer.
Notebooks remain appropriate when analysts want direct control over implementation and execution. Evaluating Jupyter notebook alternatives should include exportability and the ability to keep working with the code outside the original interface, since an investigation locked inside one tool is hard to audit for anyone without access to it.
Choose enterprise BI when many departments must consume certified numbers under shared controls. Choose notebooks or a local analysis tool when a team needs to investigate a dataset and show precisely how the result was produced. In a mixed architecture, certify the stable outputs of investigative work instead of forcing every exploratory step into a dashboard model.
Run a Proof of Concept on Your Own Data Before You Buy
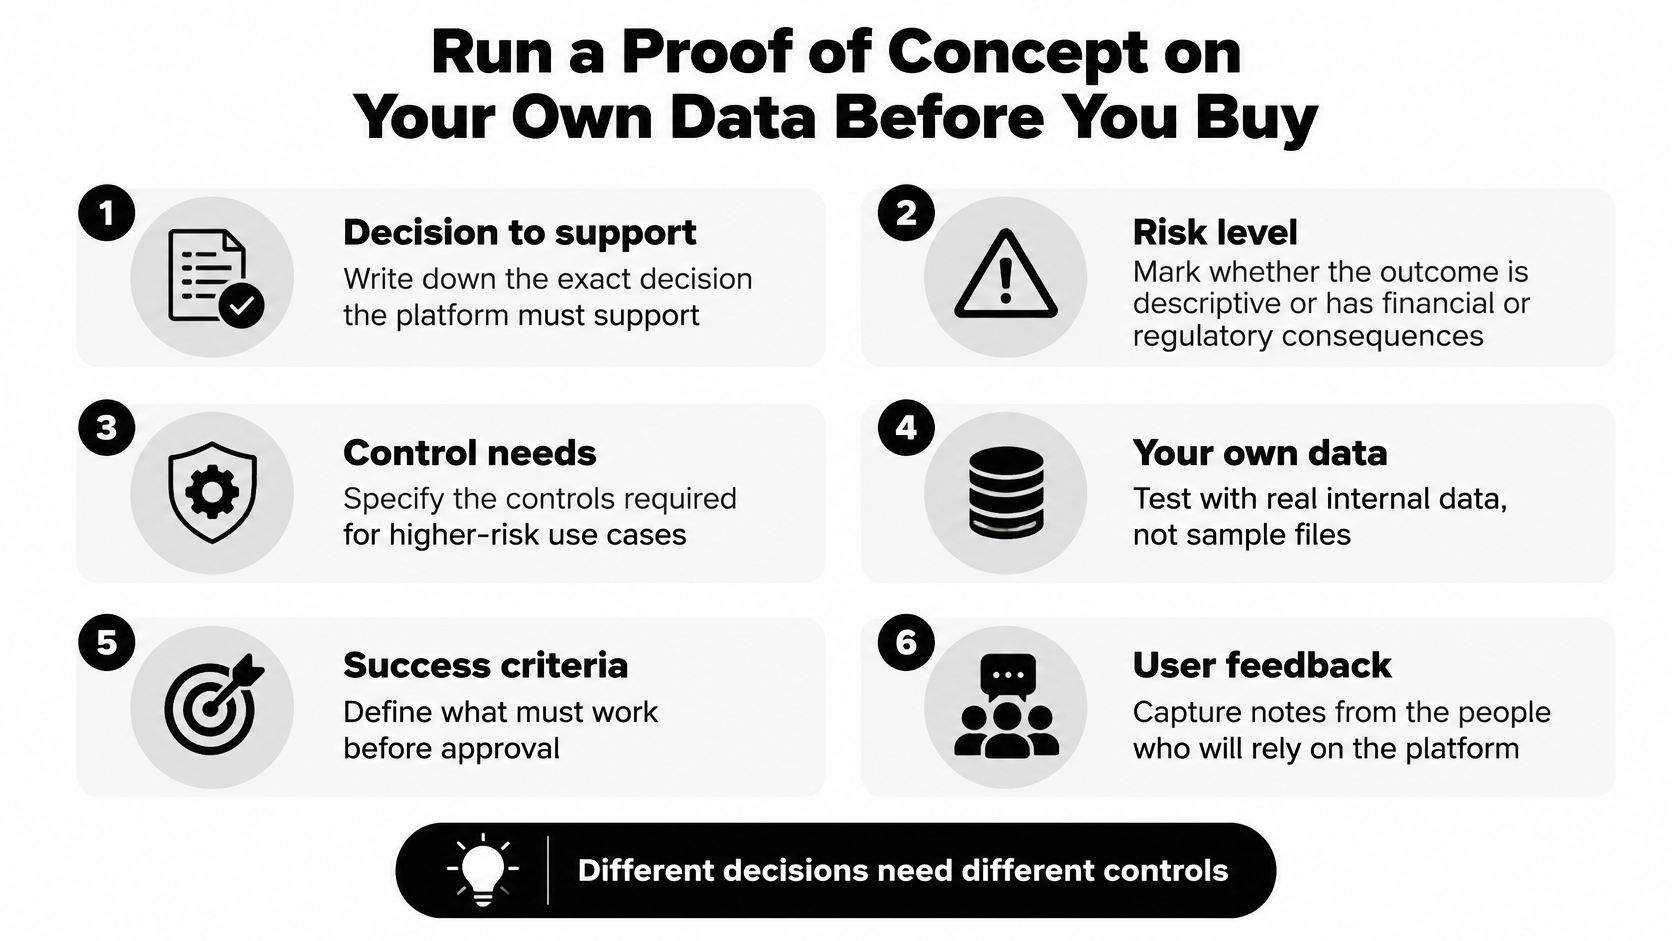
Write down the decision the platform must support and its risk level before scheduling the demonstration. A descriptive sales dashboard and a report supporting a regulated decision need different acceptance criteria.
Use a written test plan that procurement, security, analysts, and business owners can all evaluate. Define acceptable discrepancies, required evidence, and rejection conditions before anyone sees the vendor's polished sample dashboard.
The checklist below keeps the evaluation tied to decisions and users.
Run the acceptance tests in order
Choose representative datasets, including the messiest. Include operational records, a financial extract, and a source with known quality problems where appropriate. Preserve an unchanged baseline so competing platforms receive equivalent inputs.
Profile before building anything. Measure missingness, duplicate rates, and join match rates. Examine unmatched records and row multiplication separately, because a successful join can still produce an invalid total.
Build a governed metric. Have separate departments confirm the definition and independently reconcile the result. Record exclusions, date logic, aggregation rules, and the accountable owner. Agreement on the displayed total isn't sufficient if users reached it through incompatible assumptions.
Time a change request. Change a business rule and follow it from definition edit through review, testing, publication, and notification. Include the staff effort required, not just the time spent clicking through the interface.
Test access as a restricted user. Attempt direct queries, drill-through, exports, and access through saved content. Confirm sensitive rows remain hidden and approved aggregates still work.
Reproduce a figure independently. Export available lineage, code, model settings, and data-version information. Ask a colleague who didn't build the report to reconstruct the result. If essential logic exists only in the original author's memory, the test hasn't passed.
Calculate total ownership cost over three years. Include licences, infrastructure, source-query charges, onboarding, administration, support, and change management. Model expected adoption and workload growth without assuming the pilot's usage pattern will remain constant.
Reconcile before retiring the previous system
When replacing spreadsheets or an existing BI platform, run both through a complete reporting cycle. Reconcile key metrics at the transaction and transformation levels, not just the final total. Offsetting errors can make incorrect systems appear to agree.
Keep a discrepancy log with an owner and resolution for each difference. Distinguish legitimate definition changes from migration defects, and obtain business approval before changing the official reporting baseline.
For a research-team evaluation, our free desktop trial runs locally and lets users watch the full multi-agent workflow live. Use an approved dataset and a question with a known reference result, then assess the plan, intermediate checks, exported code, and final interpretation. Watching the process is useful only if the team also verifies the result.
Frequently Asked Questions
What is enterprise BI software?
Enterprise BI software is a governed analytics platform that connects operational and financial sources, prepares data, models shared metrics, and distributes dashboards, paginated reports, and self-service exploration. Its enterprise value comes from controlled reuse: people in different departments can work from approved definitions without rebuilding the underlying calculation.
The relevant buying question isn't whether the platform can display your data. It's whether your organization can maintain, secure, explain, and reproduce the numbers as users and requirements change.
Is enterprise BI the same as a dashboard tool?
No. A dashboard is a presentation and interaction layer. Enterprise BI also needs semantic modelling, access enforcement, certified content, ownership, and lifecycle management.
A dashboard tool may be sufficient for a small, clearly bounded reporting task. When reports influence decisions across departments, test how the system handles conflicting definitions, source changes, deprecated measures, and restricted records.
What is the best AI tool for research data analysis?
The best choice matches the research question, data structure, review requirements, and analyst's skills. A team investigating treatment effects or longitudinal outcomes needs more than natural-language summaries: it needs visible methods, appropriate diagnostics, uncertainty estimates, and reproducible outputs.
An agentic research tool can support that investigative work, while enterprise BI is better suited to distributing certified measures across departments. Neither removes the researcher's responsibility to justify assumptions or distinguish association from causation.
Should a team replace its notebooks with enterprise BI?
Usually not as a wholesale replacement. Keep notebooks for exploratory analysis, specialist modelling, and workflows requiring direct code control. Move stable, widely reused measures into governed reporting once their definitions and validation are established.
The boundary should follow the work. Analysts may investigate a retention pattern in a notebook, while managers monitor the approved retention measure in BI. Preserve the connection between the analytical implementation and the published definition so they don't diverge.
For a low-pressure comparison with your existing workflow, download and try PlotStudio AI using an approved dataset and a result your team can independently verify. Review the analysis plan, inspect the locally executed Python, and export the work before deciding whether it belongs alongside your enterprise BI platform.