Public health analytics software collects, links, analyzes, and reports surveillance and population data so epidemiologists can produce defensible evidence without a programmer, a design principle reflected in Epi Info's 1985 release. Choose it for traceable methods and repeatable decisions, not dashboard polish; PlotStudio AI is a research analysis option for authorized extracts, not a replacement for surveillance infrastructure.
What Public Health Analytics Software Is and Where It Came From
Say an epidemiologist receives laboratory confirmations, case interviews, and population estimates. The immediate question isn't which chart looks best. It's whether the records describe comparable cases, whether the denominator fits the population at risk, and whether someone else could reconstruct the resulting rate.
That operational independence shaped the category. According to CDC's history of public health informatics, epidemiologists responding to the 1976 swine flu crisis used a refrigerator-sized Digital Equipment PDP-11 running the FORTRAN program SOCRATES, a predecessor that influenced Epi Info's first release in 1985. Users could define questions, enter data, and produce tables without routing every request through programmers.
The category's functions extend well beyond visualization.
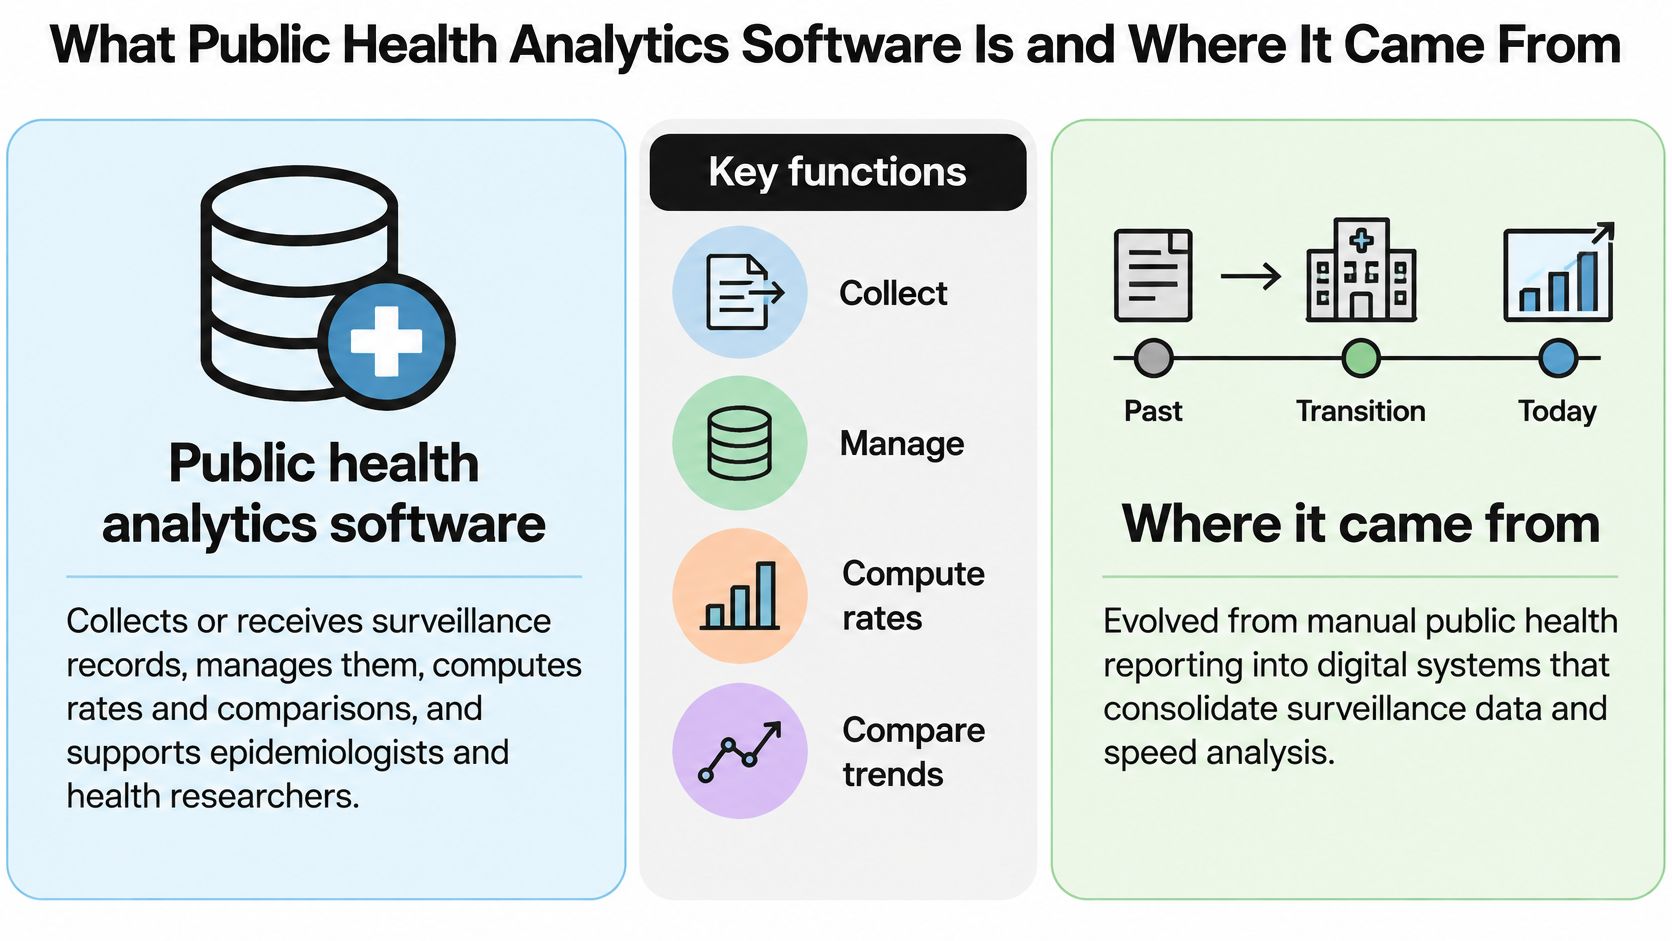
National infrastructure followed: CDC's surveillance history describes NETSS standardizing state-to-CDC case reporting from 1990 and CDC WONDER becoming publicly available on the web in 1995, supporting counts, rates, percentages, confidence intervals, and standard errors.
A display isn't a decision system
A 2025 review in the Journal of Medical Internet Research found that direct empirical links between dashboard usability, usefulness, actual use, and resulting decisions or actions were largely missing. The purchasing implication is straightforward: attractive displays aren't evidence that an agency will make better decisions.
Dashboard display versus a public health decision system
| Layer | What the user sees | What is still required | Fails when |
|---|---|---|---|
| Indicator dashboard | Rates, maps, trend lines | Cohort definition and exclusions | The number cannot be traced to records |
| Surveillance query | Counts, rates, percentages, confidence intervals | Standard errors and comparable denominators | Jurisdictions use different codes |
| Linked analysis | Joined lab, case, and encounter data | Match rate and join uncertainty | Unmatched records are dropped silently |
| Decision record | Recommended action and owner | Method, assumptions, and re-run path | Leaders cannot audit the statistic later |
Before reviewing features, require record-level traceability, visible subgroup gaps, and an independent re-run. A decision system should preserve the cohort, exclusions, statistic, uncertainty, and action owner, not merely the final image.
Data Sources Standards and Linkage Tests
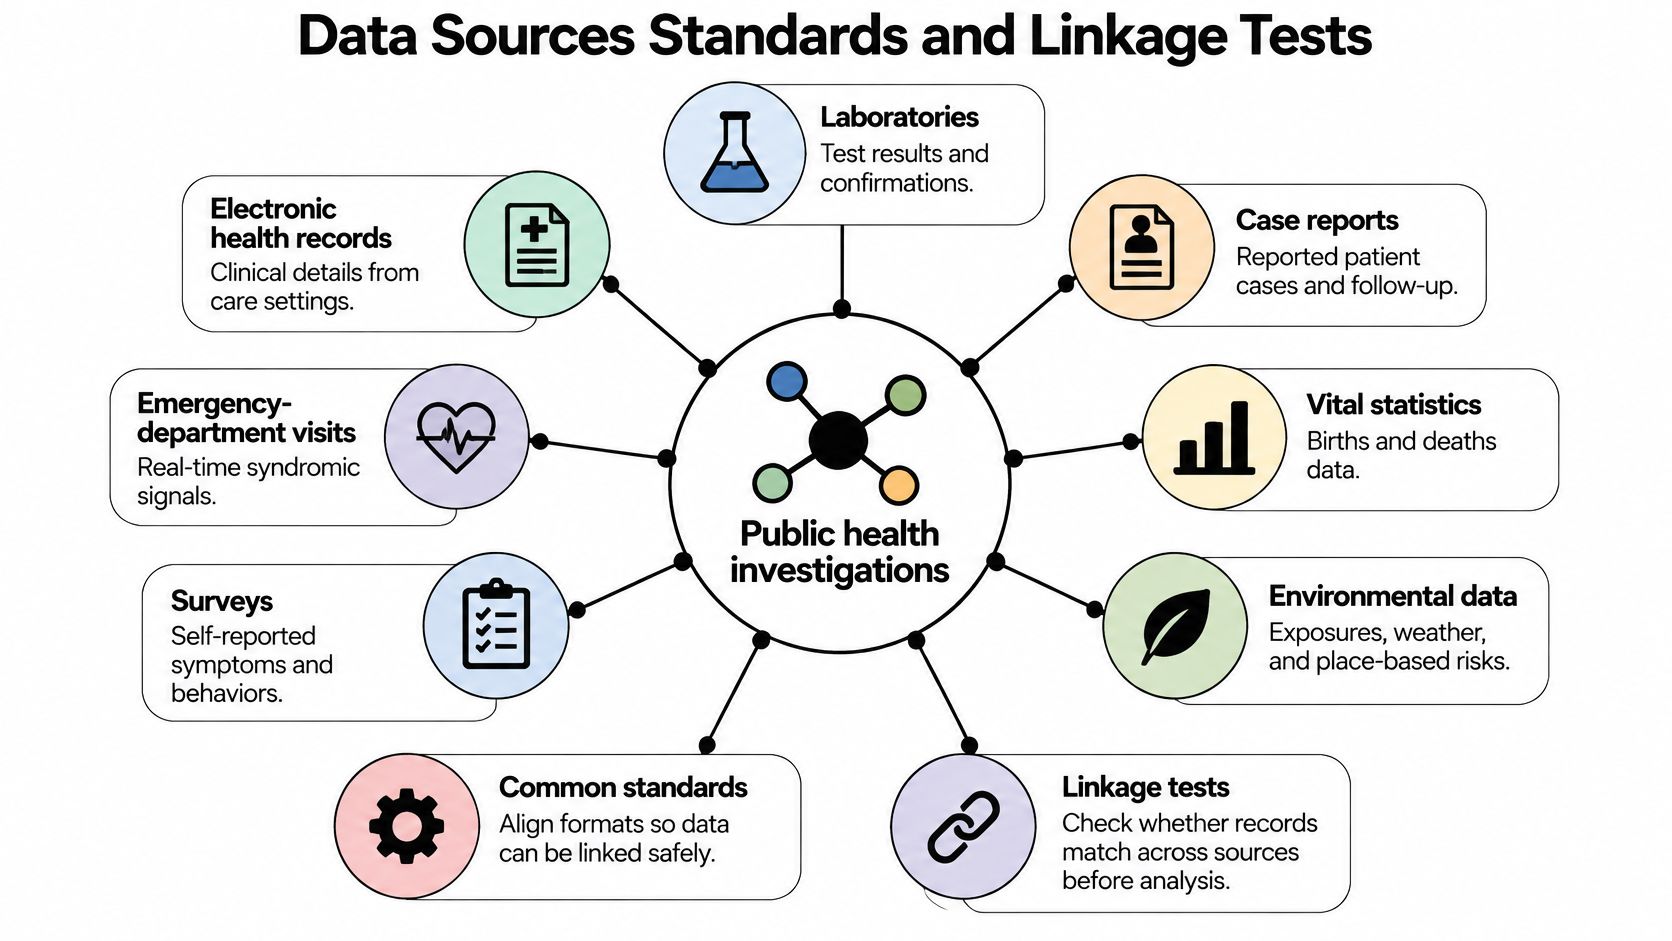
An investigation can span laboratories, electronic health records, case reports, vital statistics, emergency-department encounters, surveys, and environmental observations. A CSV export moves a file; it doesn't establish compatible definitions, update behavior, or a reliable linkage process.
The source map makes those dependencies explicit.
The CDC data modernization assessment framework calls for APIs, shared exchange standards, and connected or federated repositories. For jurisdictions that can't pool identifiable records, the architecture should make clear which transformations happen locally and which outputs cross organizational boundaries.
Treat exchange and validation as separate jobs
HL7's FHIR documentation describes reusable resources and four exchange approaches: REST interfaces, documents, messages, and service invocation. Think of resources such as Patient, Observation, and Encounter as the nouns; exchange patterns determine how those nouns move.
The NHSN Digital Quality Measures Reporting implementation guide specifies FHIR-based electronic surveillance submission. Conformance establishes an exchange contract, but analysts still need cleaning, transformation, and cohort validation before calculating a health measure.
For architectural planning, Rite NRG's explanation of batch and streaming pipeline patterns is useful context for choosing scheduled extracts versus continuous ingestion. The analytical consequences of combining systems also deserve attention in cross-platform analytics, particularly when update schedules differ.
Run ingestion tests before modeling
- Map codes. Use a versioned value set and quarantine unknown values rather than guessing their meaning.
- Validate fields and time. Check required identifiers, event dates, reporting dates, and impossible sequences.
- Preserve provenance. Retain source system, source identifier, extraction time, and transformation version on harmonized records.
- Measure linkage. Publish the match rate, unmatched count, and ambiguous-match count, separating records from people or events.
- Repeat the transformation. Identical inputs and configuration should produce the same cohort.
- Trace the metric. Follow an aggregate result through its numerator, denominator, and eligible source records under authorized access.
This introductory interoperability video offers additional context.
Standardized exchange reduces manual compilation only when validation runs before the model. Otherwise, automation moves incompatible records faster.
Features That Produce Defensible Health Evidence
Start with case and denominator management, not model selection. Specify whether the unit is a person, episode, specimen, or encounter, then define eligibility, geography, and observation window. A repeated positive test shouldn't become another person in the numerator.
Next, require frequencies, rates, percentages, confidence intervals, and standard errors, with exportable tables behind maps and charts. Stratification should follow the question: an overall rate may conceal differences by age or place, while sparse strata can produce unstable estimates.
Match capabilities to analytical questions
Core capabilities and their watch-outs
| Capability | Question it answers | Typical output | Watch-out |
|---|---|---|---|
| Rate and interval | Is this higher than expected? | Rate per denominator with confidence interval | Wrong denominator or time window |
| Stratification | Who bears the burden? | Age, place, sex, or race and ethnicity tables | Small cells overstate certainty |
| Quality profile | Can this file be analyzed? | Missingness, duplicate, date and code report | Silent row drops change the rate |
| Record linkage | Are these the same event? | Match rate and unmatched residual | Poor matches bias equity comparisons |
| Anomaly check | Is this cluster real? | Baseline comparison with reporting-completeness check | A reporting change looks like an outbreak |
| Cohort or survival | What happens over time? | Kaplan-Meier curve or Cox model with stated assumptions | Censoring and competing risks ignored |
Profile quality before fitting models. Inspect missingness by source and subgroup, not just overall; a complete outcome column doesn't rescue an exposure field that is selectively absent. A practical data-profiling workflow should produce explicit cleaning decisions and retained exclusion counts.
For surveillance signals, compare a spike against an appropriate baseline and inspect reporting completeness, backlogs, and definition changes. The VirusFAQ guide to epidemiological analysis provides related methodological context, but the operational requirement is inspectable evidence for each alert.
Keep assumptions beside results
For time-to-diagnosis, vaccination, or outcome questions, define time origin, event, censoring, and follow-up before choosing a survival method. Use Cox proportional-hazards models only when their assumptions are defensible; assess competing events when they prevent the outcome of interest.
Require effect estimates and intervals, confounder rationale, diagnostics, and sensitivity analyses where relevant. When analysts search many outcomes or strata, distinguish exploratory signals from prespecified confirmatory tests and address multiplicity.
Practical rule: Store the transformation, statistical method, assumptions, and interpretation with the figure. A chart copied into a briefing shouldn't lose its methodological identity.
Research-side agents can plan analyses, execute local Python, and preserve code with results. They don't replace the analyst's responsibility for the question, comparison group, causal interpretation, or publication claim.
Edge, On-Premises and Cloud
Choose deployment by where identifiable data may reside and where computation must occur. Start with an approved data-flow diagram showing source systems, analytical engines, temporary files, logs, exports, and external model calls.
The labels alone aren't enough. A desktop interface can call remote services, while a cloud application can impose different controls on source records and published aggregates.
| Deployment | Suitable task | Data boundary to establish | Required artifact |
|---|---|---|---|
| Edge | Field collection and validation with intermittent connectivity | Device storage, synchronization, and loss response | Validated extract with synchronization history |
| On-premises | Case-level linkage and controlled analysis | Agency servers, accounts, backups, and administrator access | Access-controlled cohort and transformation log |
| Cloud | Authorized shared analysis or aggregate publication | Hosting, identity, retention, and interjurisdictional access | Versioned intake and reproducible publication pipeline |
| Hybrid | Local linkage followed by approved aggregate publication | Exactly which records or outputs cross each boundary | Documented handoff with disclosure review |
Inspect the complete computation path
An edge workflow should handle interrupted transfers without duplicating records. An on-premises workflow should keep linkage keys and small-cell disclosure processing inside the authorized boundary. For buyers assessing agency-controlled infrastructure, what on-premises deployment means is a useful starting point.
Cloud deployment isn't permission to pool records. Specify whether the shared environment receives identifiable data, pseudonymized records, or aggregates, and document who approves each transfer.
- Computation: Identify where transformations, statistical tests, and AI inference run.
- Logging: Establish whether prompts, exceptions, or telemetry contain record-level values.
- Retention: Define deletion for temporary extracts, exports, backups, and cached results.
- Recovery: Test whether an authorized analyst can reconstruct a published result after a workstation or service failure.
Local Python execution is a useful boundary, but it doesn't establish the privacy of the entire workflow. External calls, notebook attachments, and exported reports require separate review.
How to Choose Among Public Health and Research Tools
Buy for the job, not for a category label. A public query service, field investigation suite, surveillance exchange stack, and research workspace solve different parts of the workflow.
CDC WONDER's documentation describes menu-driven queries across mortality, cancer incidence, HIV/AIDS, tuberculosis, vaccinations, natality, and census datasets, with dynamically calculated statistics and downloadable outputs including plain text and tab-separated values. CDC's Epi Info overview describes forms, databases, epidemiologic statistics, maps, graphs, and reporting for practitioners, including users without an IT background.
Compare the work each option preserves
Public health analytics options by job
| Option | Primary job | Method visibility | Where computation runs | Best fit |
|---|---|---|---|---|
| PlotStudio AI | Multi-step investigation with Python, charts, tests, and a saved Analysis Page | Inspectable plan, code, and QA findings | Local desktop Python execution; assess external AI calls separately | Researchers analyzing an authorized extract |
| CDC Epi Info | Forms, database, statistics, maps, graphs, and reports | Epidemiologic procedures in a public-domain suite | Desktop | Field investigations and epidemiology teaching |
| CDC WONDER | Menu-driven public-use dataset queries | Query selections and system-calculated statistics | CDC web service | Public mortality, cancer, HIV, TB, natality, and census lookups |
| Agency FHIR stack | Electronic surveillance submission and pre-analysis processing | Implementation guides and configured validation rules | Jurisdiction-approved infrastructure | Routine surveillance and NHSN reporting |
| Chat-with-data tools | Prompted summaries and quick charts | Require accessible code and transformation history | Verify the selected product's execution environment | Exploration when outputs remain independently checkable |
Agentic analytics is data analysis performed by AI agents that can plan an investigation, execute analytical steps with real tools and code, inspect intermediate results, revise the approach, validate outputs, and synthesize a complete analysis. An answer is an output; an analysis is an investigation.
Our desktop application accepts a dataset and plain-English objective, then specialized agents plan, code, execute, and narrate the analysis. The upload profiler audits schema, types, missingness, distributions, and a quality score; the QA agent checks assumptions, data leakage, and statistical issues.
Test artifacts rather than promises
Researchers considering a Julius AI alternative should compare multi-step investigation, local Python execution, methodology visibility, and persistence directly. Our workspace preserves Analysis Pages and supports Plan Mode, Jupyter export, and PDF export, giving reviewers artifacts beyond a chat transcript.
Before purchase, use an authorized representative extract and require:
- Visible transformations: Inspect joins, filters, recoding, and exclusion counts.
- Statistical completeness: Obtain appropriate intervals and diagnostics, not bare counts.
- Portable evidence: Export executable code and a readable report.
- Human approval: Review the plan before calling an analysis confirmatory.
- Re-run proof: Have an independent analyst reproduce the cohort and principal estimate.
Generic BI can remain the indicator-monitoring layer. Research software should earn its place by preserving the investigation behind an important result, not by claiming to replace every operational system.
Implementation Roadmap for a Public Health Analytics Program
Rollout should advance through gated phases, with a named owner for every source feed and published indicator. A successful installation isn't the exit condition; a defensible analytical artifact is.
Establish ownership before deployment
- Scope the decisions. Name the decisions the program must support, such as selecting an exposure site for investigation or reviewing a vaccination schedule. Exit only when each indicator has a documented population, denominator, time window, and interval rule.
- Map the sources. Inventory laboratory, case, encounter, and vital-record feeds; version the value sets and agree on linkage keys. Each join needs a published match-rate definition and an owner responsible for unmatched records.
- Validate retrospectively. Apply rejection rules and profiling to a historical extract before connecting publication outputs. Independent analysts must reproduce identical cohort counts from the frozen input and configuration.
- Deploy and train. Configure access, minimum necessary fields, and the approved computation path. Staff should demonstrate that they can interpret intervals, exclusions, and caveats, while every published rate points to saved analytical code.
- Review operational use. Schedule a post-deployment decision review. Retain an indicator only with a documented use, a justified monitoring purpose, or an explicit improvement plan; otherwise, retire it.
Passing a technical test isn't permission to publish. Assign separate approval for analytical validity and disclosure risk.
Budget for maintaining mappings, resolving legacy-system discrepancies, and training staff who inherit the workflow. Keep test extracts and expected outputs under version control so a changed feed or software release can trigger regression testing.
A feed without an accountable owner is an unresolved operational dependency. Don't hide that dependency inside the analytics team's cleaning script.
Use Cases, KPIs and Measurable ROI
Consider an outbreak line list with symptom onset, laboratory confirmation, exposure site, and report receipt. An analyst builds an epidemic curve, stratifies by place, and checks whether recent onset dates are incomplete before recommending additional specimen collection. The useful output is a reviewed next action, not merely a peak.
A vaccination cohort requires a different investigation. Unequal follow-up and censoring make crude outcome percentages difficult to compare; define time origin carefully, address confounding, and choose survival or cumulative-incidence methods appropriate to the event structure.
Measure whether the investigation changed work
Use cases and the measure that proves the analysis mattered
| Use case | Minimum method | Decision supported | Proof of value |
|---|---|---|---|
| Outbreak line list | Epidemic curve plus reporting completeness | Where to investigate next | Hours from file receipt to a reviewed curve |
| Vaccination cohort | Survival or cumulative incidence with censoring | Whether a schedule needs review | Assumptions and censoring rules stored with the figure |
| Equity comparison | Stratified rates and a missingness threshold | Whether a disparity claim is valid | Analysis stopped or caveated when cells are incomplete |
| Research extract | Profile, clean, test, and export code | A manuscript or briefing table | A second analyst reproduces the cohort |
For an equity comparison, the correct outcome may be to withhold a disparity claim because subgroup missingness makes its direction uncertain. For an authorized research extract, success may be a manuscript table reproduced independently after a corrected source file arrives.
Aynur Science published “I Used Agentic Analytics to Clean and Analyse 4,240 Patient Records” using our application. That is an example of a research workflow, not evidence of improved population outcomes; our domain-specific methods include Cox PH for survival analysis, IV/2SLS for causal inference, and GARCH for volatility, each requiring question-appropriate review.
Define the re-run measure before purchase
Track successful independent re-runs divided by attempted re-runs, recording whether failures came from missing inputs, unavailable environments, changed definitions, or incorrect code. Pair that measure with median time from case receipt to a reviewed rate, denominator-and-interval documentation coverage, published linkage coverage, and eligible vulnerable-population stratification.
A broader healthcare data analytics workflow should distinguish analytical turnaround from clinical or policy effectiveness. Logins and generated charts don't establish either.
Estimate net operational value as reconciliation hours avoided multiplied by loaded staff cost, plus separately valued rework avoided, minus licensing, validation, and training costs. Compare equivalent baseline and post-deployment periods, avoid double-counting staff time, and publish assumptions; divide net benefit by total cost if reporting ROI as a ratio.
Privacy, Auditability and When Not to Trust the Rate
A 2025 review of U.S. public health dashboards found that only 22% included data specific to vulnerable populations, while 20% of sampled state dashboards were temporarily inaccessible when revisited. The review also identified limited coverage of upstream factors such as social determinants, climate, and workforce development.
More analytical sophistication doesn't fill those gaps. An accessible chart can still describe a selectively observed population.
Establish explicit stop rules
- Unstable equity claims: Withhold or qualify a disparity estimate when plausible missing-data scenarios could reverse its direction.
- Unverified signals: Investigate reporting completeness, backlog releases, and definition changes before interpreting a rise as an outbreak.
- Uncertain linkage: Retain unmatched records in the quality account and test how alternative linkage decisions affect estimates.
- Disclosure risk: Block publication until small cells, addresses, and linked clinical details meet the organization's approved controls.
Use role-based access, minimum necessary fields, and disclosure rules aligned with the release context. RDE Technologies' discussion of health informatics data protection offers relevant governance context; secure analytics for healthcare also requires examining extracts, model calls, and exported artifacts.
Record exclusions as evidence
An audit record should identify the operator, input version, value-set version, transformation, and reason for each exclusion category. Preserve enough information to reproduce the result without distributing identifiable records through logs or chat transcripts.
Software can expose uncertainty. An epidemiologist or physician-researcher must decide whether the remaining uncertainty permits a policy recommendation or publication claim.
Local execution helps control where analytical code runs. It doesn't remove the need to review external transmissions or authorize the research purpose.
Frequently Asked Questions
Is a dashboard enough for public health analytics?
No. A dashboard can communicate an indicator, but an operational decision also needs its denominator, exclusions, uncertainty, accountable owner, and supporting evidence. Require access to those artifacts before treating a displayed trend as a basis for intervention. If a demonstration shows a rate but cannot show how the numerator was assembled or which records were dropped, treat that rate as unverified.
What is the best AI tool for research data analysis on a public health extract?
Choose by the authorized workflow rather than an overall ranking. For a research file, PlotStudio AI fits investigations requiring inspectable Python, a reviewable plan, saved findings, and notebook export; routine case reporting still belongs in the appropriate surveillance infrastructure. The deciding test is transparency: users can see as much of the underlying analysis as they want, including the generated code, or let the AI run and return only the results.
Which data standard should public health software buyers ask about?
Ask about HL7 FHIR, then request the actual implementation guide and supported profiles. Exchange compatibility is not enough: the demonstration should also expose code mappings, validation failures, provenance, and linkage results for your source systems.
How should I start analyzing a de-identified public health extract?
Confirm authorization and disclosure risk, then profile missingness, duplicates, dates, and coding before modeling. Define the analysis unit and eligible population, calculate appropriate stratified estimates with intervals, and preserve executable steps so a colleague can check the result.
The strongest purchase evidence is a representative investigation that survives independent scrutiny. Download PlotStudio AI for Mac or Windows, run it on an authorized, de-identified extract, and exercise the upload profiler, a plain-English analysis with its underlying Python and step-by-step description, and an independent re-run of the same question before treating any output as decision-grade.