The right statistical software for regression analysis depends on how you work. Excel is enough for a quick linear model on a small dataset. R is the best free option if you can code. Stata and SPSS suit researchers who want established, widely cited tools, with Stata favoring command-based work and SPSS favoring menus. PlotStudio AI, our own product, suits researchers who want to describe a model in plain English and still see the code behind it.
Fitting a line is the easy part, because nearly every package does it. The hard parts are choosing a model that fits your outcome variable, checking its assumptions, and producing output you can defend in a methods section. A tool that hides those steps is as risky as one that buries you in syntax.
Below, each tool gets the same three checks: how it runs regression, who it suits, and what it costs or where it falls short. PlotStudio AI comes first because we make it, so its limits are stated as plainly as its strengths.
1. PlotStudio AI
How it handles regression

PlotStudio AI is a desktop workspace where you upload a dataset and describe the model in plain English. Specialized AI agents plan the analysis, write and run Python, and interpret the results. Before anything executes, Verification Mode lets you review the plan, edit the methods, and approve the assumptions.
- Domain methods such as Cox proportional hazards and IV/2SLS are applied where your field calls for them.
- Uploaded data gets a quality score (Clean, Usable, or Needs Cleaning) and a cleaning plan.
- Results export as a PDF report or a Jupyter notebook that reproduces the analysis with Run All.
You get the speed of a chat interface with the code and assumptions still in front of you.
Who it suits
It fits researchers and graduate students who know their question but do not want to write Python or R. Experienced analysts can use it to skip repetitive scripting, and they can inspect every generated line.
Analysis runs on your machine, and PlotStudio's servers do not store your dataset. Model calls still go to your configured provider, so check IRB and institutional rules before using clinical or patient data.
Cost and limits
The free trial gives you 30 credits with no credit card and no API key. Paid plans are below.
| Plan | Price per month | What you get |
|---|---|---|
| Free Trial | $0 | 30 credits, no card, no API key |
| Managed Credits | $69.99 | 300 credits, no API key |
| Bring Your Own Key | $39.99 | Unlimited queries with your OpenAI key |
| Academic Managed Credits | $29.99 | Approved researchers only |
| Academic BYOK | $14.99 | Approved researchers only |
PlotStudio assists your judgment and does not replace it. It does not claim feature parity with Stata or R, so confirm platform support for your computer on the site.
2. Microsoft Excel
How it handles regression
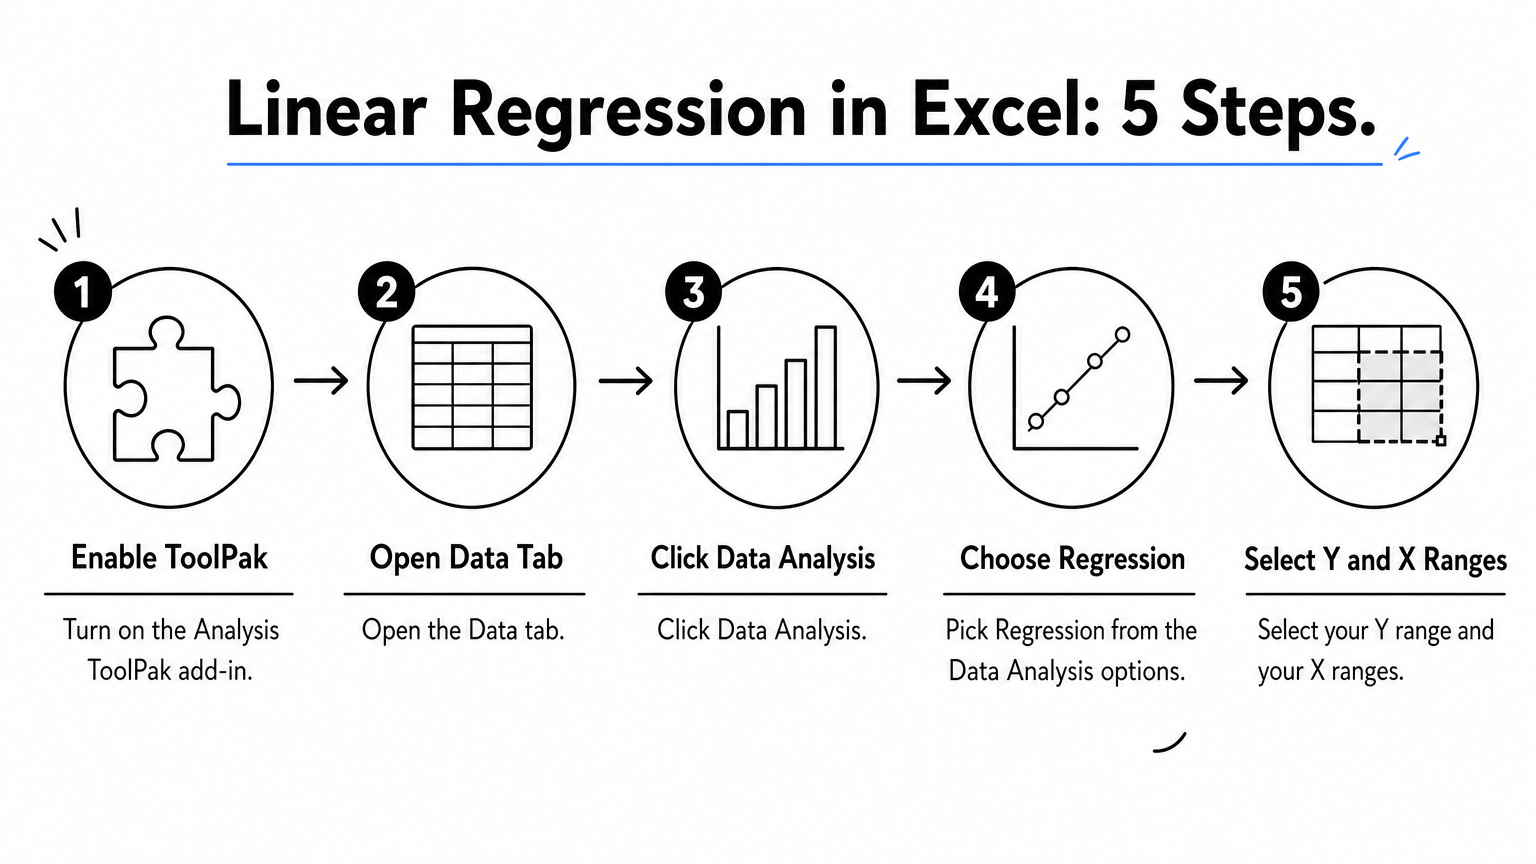
Excel runs linear regression through the Analysis ToolPak add-in. Enable it, open Data, then Data Analysis, then Regression, and select your Y and X ranges. The output includes R Square, coefficients, standard errors, p-values, 95% confidence intervals, and an ANOVA table.
That table holds the F-test for the whole model, and each coefficient gets its own t-test. For one predictor, the LINEST function or a chart trendline also works.
Excel handles a simple linear model well, and that is where its usefulness ends.
Who it suits
Excel suits students learning how regression works and anyone checking a quick relationship in a small dataset. It also suits teams whose data already lives in spreadsheets and who need a fast first look before moving to heavier software.
Cost and limits
The add-in is free with your Excel license. The limits matter, though. It fits linear models only, with no logistic regression and no robust standard errors. The Regression tool accepts up to 16 predictors and stops on blank cells, so clean your data first. Output is static, so you must rerun it when the data changes.
3. R with RStudio
How it handles regression
R fits linear models with lm() and logistic or Poisson models with glm(). Calling summary() returns coefficients, t-tests, and the F-statistic. Packages such as car, lmtest, and sandwich add diagnostics and robust standard errors, and ggplot2 handles plots.
model <- lm(outcome ~ age + dose + group, data = df)
summary(model)
R can fit almost any regression you can name, but it will also fit a wrong model without complaint.
Who it suits
R suits researchers who code or are willing to learn, and statisticians who need newer or specialized methods before commercial packages add them. Scripts are reproducible by default, which helps with peer review and replication.
Cost and limits
R is free and open source, and RStudio Desktop from Posit is free as well. The real cost is learning time. Beginners often get code to run before they understand the model it fit, so pair it with a textbook or a reviewer.
4. Stata
How it handles regression

Stata's regress command fits linear models, and logit and logistic handle binary outcomes. Adding vce(robust) gives robust standard errors in one option. Post-estimation commands such as estat hettest and estat vif check heteroskedasticity and collinearity, and xtreg covers panel data.
You can work through menus or save commands in do-files.
Stata's strength is that regression, diagnostics, and reproducible scripts sit in one consistent command language.
Who it suits
Stata is common among economists, epidemiologists, and public health researchers. It is a strong fit for panel, survey, and observational data, where its consistent syntax saves time. Reviewers in those fields also know its output well.
Cost and limits
Stata requires a paid license, and the price depends on edition and user type, with student and academic pricing available, so check Stata's price list. The command syntax takes time to learn. A license is a recurring budget line, which matters if you move between institutions.
5. IBM SPSS Statistics
How it handles regression
SPSS runs regression from the menus: Analyze, Regression, Linear. Binary logistic and ordinal options sit in the same menu. The Statistics button adds collinearity diagnostics and the Durbin-Watson test, and the Plots button produces residual plots.
Pasting the generated syntax saves your steps for later reruns.
SPSS lets you run a full regression with diagnostics without writing a single command.
Who it suits
SPSS fits researchers in psychology, social science, and health fields and courses that teach by menu. If your advisor or lab already uses it, matching their tool makes review easier.
Cost and limits
SPSS is commercial, with subscription and license options, so check IBM's current pricing and academic discounts. It costs more than R, and reproducibility depends on saving syntax, because clicking through menus leaves no record by default.
Which tool to pick
Match the tool to your skills and your model. Excel covers small linear models. R is the free, flexible choice if you code. Stata and SPSS are the paid, established options, one command-driven and one menu-driven. PlotStudio AI fits when you want plain-English requests with the code and assumptions visible.
Whichever you choose, check residuals and assumptions yourself, because no package can tell you whether a model suits your question. If you want to see how the plain-English approach feels on your own data, you can try PlotStudio AI free with 30 credits and no credit card.