ANOVA or t test? The answer depends on how many groups you compare. Use a t test when you compare the means of two groups, or one group against a known value. Use ANOVA (analysis of variance) when you compare the means of three or more groups. Both tests ask whether the gaps between group means are larger than random variation would produce. ANOVA answers that in a single test, which protects you from the false positives that pile up when you run many t tests.
This guide explains why the number of groups matters, how to pick the right test for your design, and how the two tests differ in assumptions and follow-up steps. It also works through a small example by hand, so you can see where the numbers come from, and lists the mistakes that most often cost researchers a reviewer comment.
At PlotStudio AI, we build a research analysis workspace that runs statistical tests, builds charts, and writes the interpretation. The test you choose still has to match your data, and that choice is yours to make. The sections below give you the rules to make it quickly and defend it in a methods section.
Why the number of groups decides the test
The number of groups decides the test because each extra t test you run adds another chance of a false positive. ANOVA examines all groups in one test, so your overall error rate stays at the level you chose, usually 5%.
The multiple comparisons problem
Suppose you compare three drug doses on blood pressure. That takes three pairwise t tests: low vs medium, low vs high, and medium vs high. Each test carries a 5% chance of flagging a difference that does not exist. Run all three, and the chance of at least one false positive climbs to about 14%.
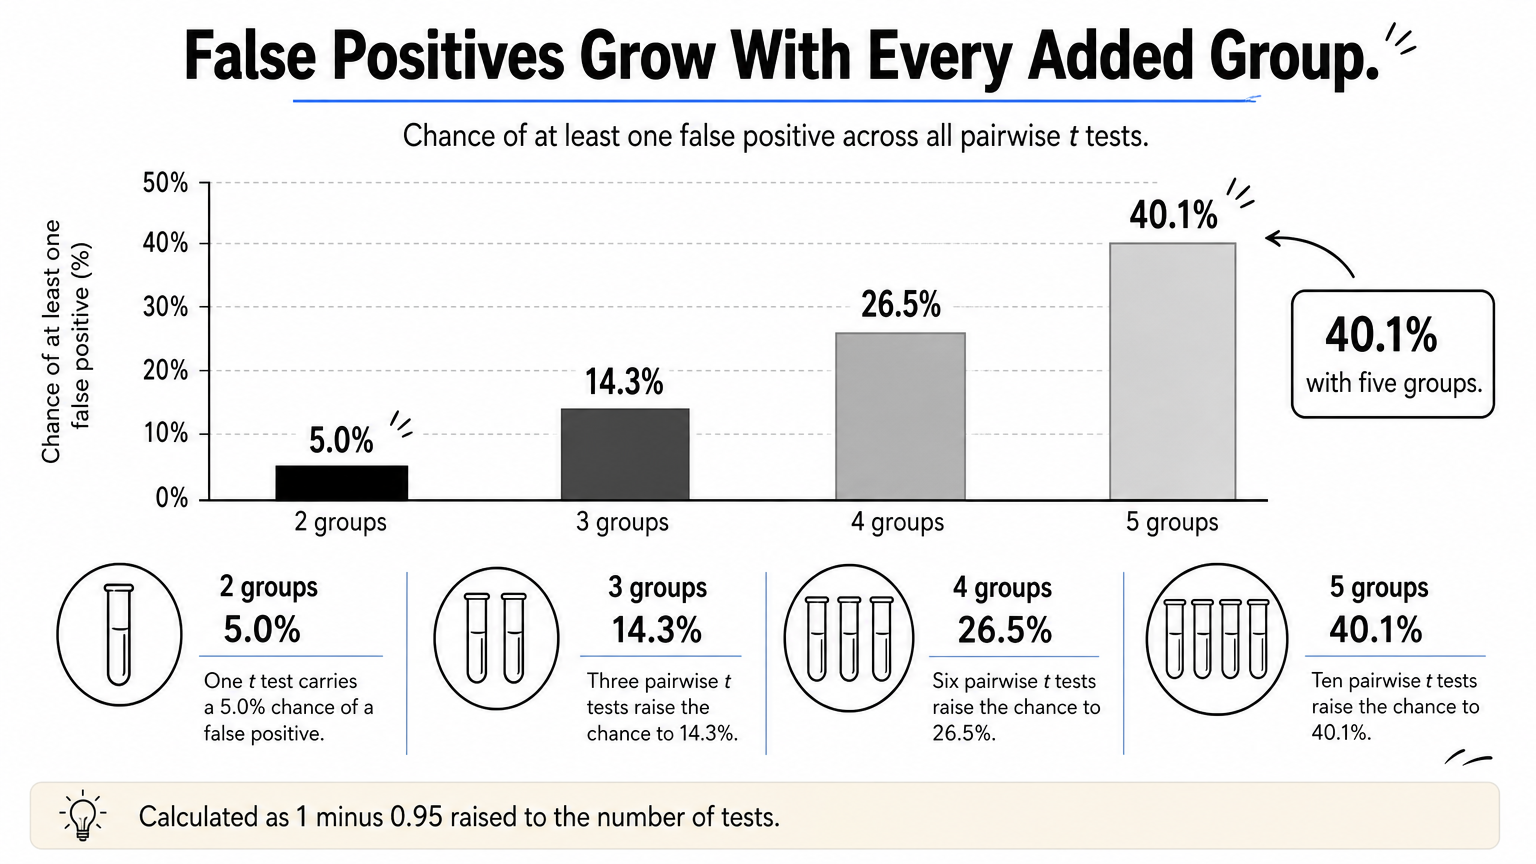
| Groups | Pairwise t tests needed | Chance of at least one false positive |
|---|---|---|
| 2 | 1 | 5.0% |
| 3 | 3 | 14.3% |
| 4 | 6 | 26.5% |
| 5 | 10 | 40.1% |
These figures use 1 − 0.95 raised to the number of tests. They treat the comparisons as independent, which pairwise tests are not, so the true inflation is somewhat smaller. It is still far above the 5% you intended. ANOVA avoids the problem by asking one question first: do the group means differ at all?
Two groups call for a t test and three or more call for ANOVA, because of error control, not convention.
Can you use ANOVA for two groups?
Yes, and you will get the same answer. With two groups, a one-way ANOVA produces an F statistic equal to the square of the pooled-variance (Student's) t statistic, and the p-values match exactly. So the question of ANOVA versus t-test for two groups is not about correctness.
Most analysts still choose the t test for two groups, for three practical reasons. It reports a signed difference, so you see which group is higher. It supports a one-sided hypothesis when you set a directional prediction in advance. And its Welch version, which many programs apply by default, handles unequal variances without extra steps.
When to use a t test or ANOVA for your data
Count your groups, then check whether the measurements are independent or repeated on the same subjects. Those two answers pick the test in nearly every case.
Four questions to ask
Work through these in order:
- What is your outcome? Both tests need a continuous outcome, such as blood pressure, concentration, or a test score. If the outcome is a category, such as recovered or not recovered, you need a different test, such as chi-square.
- How many groups or conditions do you compare? Two points to a t test. Three or more point to ANOVA.
- Are the observations independent or paired? Different people in each group means independent. The same people measured twice, or matched pairs, means paired or repeated.
- How many factors define the groups? One factor, such as drug type, means one-way. Two factors, such as drug type and sex, mean two-way, which also tests whether the factors interact.
Quick reference by study design
Once you know your answers, look up the design. The table includes the common rank-based fallbacks for when your data are clearly non-normal.
| Your design | Parametric test | Rank-based alternative |
|---|---|---|
| One group vs a known value | One-sample t test | Wilcoxon signed-rank |
| Two independent groups | Independent t test (Welch if variances differ) | Mann-Whitney U |
| Same subjects measured twice | Paired t test | Wilcoxon signed-rank |
| Three or more independent groups, one factor | One-way ANOVA | Kruskal-Wallis |
| Same subjects at three or more time points | Repeated measures ANOVA | Friedman |
| Two factors, independent groups | Two-way ANOVA | No simple equivalent |
A design with a baseline and a follow-up on the same patients is a paired t test, not an independent one. A design with a baseline, a 30-minute reading, and a 60-minute reading on the same patients needs repeated measures ANOVA.
Count the groups, then ask whether the same subjects appear in more than one of them.
How the two tests differ in practice
The two tests share a logic but differ in their statistic, their null hypothesis, and what you must do after a significant result. Knowing those differences keeps you from over-reading an ANOVA.
Hypotheses and test statistics
A t test computes the difference between two means divided by its standard error. ANOVA computes an F ratio: the variability between group means divided by the variability within groups. It is called analysis of variance rather than analysis of means because it judges differences in means by comparing variances. A large F says the groups sit farther apart than the scatter inside each group would explain.
| Feature | t test | ANOVA |
|---|---|---|
| Groups compared | One or two | Three or more (works for two) |
| Statistic | t | F |
| Null hypothesis | The two means are equal | All group means are equal |
| What a significant result says | These two means differ | At least one mean differs |
| Follow-up needed | None | Post hoc comparisons |
| Reported degrees of freedom | One value | Two values |
Assumptions and what to do when they fail
Both tests assume independent observations, an approximately normal outcome within each group, and roughly equal variances. Normality matters most in small samples, where one outlier can drag a mean. Around 30 per group is a common rule of thumb for leaning on the central limit theorem, though it is not a law. Check normality with a plot, not only a test.

For unequal variances, check with Levene's test and switch to Welch's t test or Welch's ANOVA. For clear non-normality in small samples, use the rank-based alternatives in the table above. Violated independence is the one problem that no alternative fixes. Repeated measurements on the same subject need a repeated measures design.
Follow-up tests after a significant ANOVA
A significant ANOVA only tells you that at least one mean differs. To find which pairs differ, run a post hoc test such as Tukey's HSD, or pairwise comparisons with a Bonferroni correction. These adjust for the number of comparisons, which is the problem ANOVA was meant to avoid. A t test needs no follow-up, because there is only one pair to interpret.
A significant ANOVA opens the question of which groups differ. It does not answer it.
A worked example with three treatment groups
Here is a small, made-up dataset: reduction in systolic blood pressure (mmHg) for five patients in each of three drug groups. It is deliberately simple so you can check every figure by hand.
The ANOVA by hand
| Group | Values | Mean |
|---|---|---|
| Drug A | 8, 9, 10, 11, 12 | 10 |
| Drug B | 12, 13, 14, 15, 16 | 14 |
| Drug C | 9, 10, 11, 12, 13 | 11 |

Each group has a sum of squared deviations of 10, so the within-group sum of squares is 30. The grand mean is 11.67, which gives a between-group sum of squares of 43.33.
| Source | Sum of squares | df | Mean square | F | p |
|---|---|---|---|---|---|
| Between groups | 43.33 | 2 | 21.67 | 8.67 | 0.005 |
| Within groups | 30.00 | 12 | 2.50 | ||
| Total | 73.33 | 14 |
The critical F for 2 and 12 degrees of freedom at the 5% level is about 3.89. Our F of 8.67 exceeds it, so you reject the null hypothesis that all three means are equal.
Which groups differ
Next, run Tukey's HSD. With three groups and 12 error degrees of freedom, the studentized range value is about 3.77. The threshold is 3.77 × √(2.5 ÷ 5) ≈ 2.67 mmHg.
| Pair | Mean difference | Exceeds 2.67? |
|---|---|---|
| B vs A | 4 | Yes |
| B vs C | 3 | Yes |
| C vs A | 1 | No |
Drug B outperforms both others, while A and C cannot be told apart. As a check on the two-group rule, a t test of B vs A alone gives t = 4.00 with 8 degrees of freedom. A one-way ANOVA on those same two groups gives F = 16.00, which is 4 squared. The effect size, eta squared, is 43.33 ÷ 73.33 ≈ 0.59, so drug group explains about 59% of the variance in this toy dataset.
The same data can yield one F test or three t tests, and only the F test keeps your error rate honest.
Mistakes to avoid and how to report results
Most errors come from using the wrong design, not from wrong arithmetic. Fix those and the reporting follows naturally.
Common mistakes
- Running repeated t tests across many groups without a correction, which inflates false positives as shown earlier.
- Stopping at the omnibus F. Reporting "ANOVA was significant" without a post hoc test leaves readers guessing which groups differ.
- Ignoring pairing. An independent t test on before and after measurements from the same patients throws away information and weakens the test.
- Skipping the assumption checks. Plot each group, look for outliers, and run Levene's test before trusting a pooled-variance result.
- Treating significance as importance. Report an effect size and a confidence interval alongside the p-value.
Reporting the result
Give the statistic, both degrees of freedom for ANOVA, the exact p-value, and an effect size. For the example above: F(2, 12) = 8.67, p = .005, η² = .59, followed by the Tukey results for each pair. For the two-group comparison: t(8) = 4.00, p = .004. State which post hoc method you used and how you checked the assumptions.
Running the test without writing code
In PlotStudio AI, you upload your CSV and ask in plain English to compare the outcome across your groups. With Verification Mode, you can review the proposed plan, including the chosen test and its assumptions, before anything runs. You can then inspect the generated Python and export the analysis as a PDF report or Jupyter notebook. The tool assists your analysis, but the choice of test and the scientific interpretation remain yours.
Which test to run
Start by counting groups. Two independent groups mean a t test, ideally the Welch version. Paired measurements mean a paired t test. Three or more groups mean ANOVA, followed by a post hoc test when the result is significant. Repeated measures on the same subjects need a repeated measures design, and badly non-normal small samples call for a rank-based alternative.
The reason is error control. Many t tests inflate your false positive rate, while ANOVA keeps it at the level you set. With two groups, the two tests agree, so the choice comes down to which output is more useful to you.
If you want to run these comparisons on your own dataset and see the code, tables, and figures together, try PlotStudio AI free. No credit card is required.